. 2023 Nov 27;14(1):7761.
doi: 10.1038/s41467-023-42497-8.

Synaptotagmin-7 outperforms synaptotagmin-1 to promote the formation of large, stable fusion pores via robust membrane penetration

Affiliations

Synaptotagmin-7 outperforms synaptotagmin-1 to promote the formation of large, stable fusion pores via robust membrane penetration

Kevin C Courtney et al. Nat Commun. .

Abstract

Synaptotagmin-1 and synaptotagmin-7 are two prominent calcium sensors that regulate exocytosis in neuronal and neuroendocrine cells. Upon binding calcium, both proteins partially penetrate lipid bilayers that bear anionic phospholipids, but the specific underlying mechanisms that enable them to trigger exocytosis remain controversial. Here, we examine the biophysical properties of these two synaptotagmin isoforms and compare their interactions with phospholipid membranes. We discover that synaptotagmin-1-membrane interactions are greatly influenced by membrane order; tight packing of phosphatidylserine inhibits binding due to impaired membrane penetration. In contrast, synaptotagmin-7 exhibits robust membrane binding and penetration activity regardless of phospholipid acyl chain structure. Thus, synaptotagmin-7 is a super-penetrator. We exploit these observations to specifically isolate and examine the role of membrane penetration in synaptotagmin function. Using nanodisc-black lipid membrane electrophysiology, we demonstrate that membrane penetration is a critical component that underlies how synaptotagmin proteins regulate reconstituted, exocytic fusion pores in response to calcium.


Conflict of interest statement

The authors declare no competing interests.

Figures
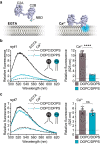
Fig. 1
Fig. 1. Syt7, but not syt1, efficiently penetrates membranes that harbor saturated PS.
a Illustration showing how an NBD labelled C2AB domain associates with a lipid bilayer in response to binding Ca2+. After binding Ca2+, the C2AB domain binds and partially penetrates the membrane, thus inserting the NBD dye into the hydrophobic core of the bilayer, causing a blue shift and an increase in fluorescence intensity. b Representative fluorescence emission spectra (left panel) of NBD labelled syt1, in the presence (solid lines) and absence (dotted lines) of Ca2+, and liposomes composed of 80:20 DOPC/DOPS (black) or DOPC/DPPS (blue). The syt1 C2AB domain is labeled on loop 3 of the C2B domain at position 367. Quantification of NBD-syt1 C2AB fluorescence emission at 525 nm in the presence of Ca2+ and liposomes composed of DOPC/DOPS (black) or DOPC/DPPS (blue), right panel. The data are normalized to the EGTA condition, shown as a horizontal black dotted line. c Representative fluorescence emission spectra (left panel) and quantification (right panel) of NBD labelled syt7, under the same conditions as (b). The syt7 C2AB domain is labeled on loop 3 of the C2B domain at position 361. Each condition was repeated five times on different days using fresh materials. Error bars represent standard error of the mean. **** represents p < 0.0001 and ns represents a non-significant difference between conditions determined by two-sided Student’s t-test.
Fig. 2
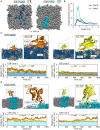
Fig. 2. Molecular dynamics simulations of syt1 and syt7 C2B•membrane interactions.
a End-point (450 ns) MD simulations of lipid bilayers composed of DOPC/DOPS or DOPC/DPPS. The PS lipids were initially placed as a cluster in the center of the membrane (see Supplementary Fig. 4 for the starting images) and then allowed to freely diffuse over time. b Radial distribution functions comparing the clustering behavior of DOPS and DPPS in the lipid bilayer at the end of the simulation shown in (a). c End point (1000 ns) MD simulations snapshots showing syt1 (orange) and syt7 (yellow) C2B domains interacting with lipid bilayers composed of DOPC/DOPS. Quantification of loop 1 and loop 3 depth from syt1 and syt7 into the DOPS-containing bilayers (blue shading) are shown in the lower panels. In each case, the loop depth is normalized relative to the position of the lipid phosphate group, indicated by a horizontal dotted line. d End point (1000 ns) MD simulations snapshots showing syt1 (orange) and syt7 (yellow) C2B domains interacting with lipid bilayers composed of DOPC/DPPS. Quantification of loop 1 and loop 3 depth from syt1 and syt7 into the DPPS-containing bilayers (light cyan shading) are shown in the lower panels. The loop residue that achieved the deepest depth of penetration, I367 for syt1 and L361 for syt7, is emphasized in white.
Fig. 3
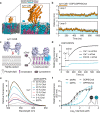
Fig. 3. Cholesterol enables syt1 to penetrate bilayers containing DPPS.
a MD simulations snapshot after 1000 ns of a syt1 C2B domain (shown in orange) interacting with a phospholipid bilayer composed of DOPC/DPPS/cholesterol. DOPC is shown in grey, DPPS in cyan and cholesterol in magenta. Residue I367 on loop 3 of syt1 is emphasized in white and the bound Ca2+ ions are shown in purple. b Quantification of the penetration depth of loop 1 (top panel) and loop 3 (lower panel) of the syt1 C2B domain into the DPPS-containing bilayer (light cyan shading) throughout the 1000 ns MD simulation. The loop depth is normalized relative to the position of the lipid phosphate group, indicated by a horizontal dotted line. c An illustration depicting an experimental C2 domain membrane penetration assay with the addition of a cholesterol-cyclodextrin complex, known as soluble cholesterol (sChol). In the absence of cholesterol, loop 3 in the C2B domain of syt1 C2AB only minimally penetrates the bilayer containing DPPS. When sChol is applied, cholesterol is donated into the DPPS bilayer, which enables syt1 C2AB to efficiently penetrate the membrane. d Representative time course examining NBD-labelled syt1 C2AB fluorescence in the presence of DOPC/DPPS (80:20) under the indicated conditions. Note: the fluorometer was briefly paused during the addition and mixing of Ca2+ and sChol into the cuvette, indicated by the vertical dashed lines. e Representative fluorescence spectra of NBD-labelled syt1 C2AB with various 100 nm liposome populations composed of DOPC/DPPS and increasing cholesterol. f Quantification of a liposome titration in the presence of NBD-labelled syt1 C2AB (I367C). The experiments were repeated on three separate occasions with fresh materials. The protein concentration was fixed at 250 nM and the fluorescence at 525 nm was monitored as the concentration of lipid increased from 0 to 500 µM. Error bars represent standard error of the mean from triplicate experiments.
Fig. 4
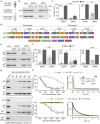
Fig. 4. Hydrophobic interactions dominate syt1 and syt7 membrane association.
a Illustration of the liposome-protein co-sedimentation assay. Proteins and liposomes are mixed, followed by sedimentation of the liposomes; the supernatant is subjected to SDS-PAGE to assay for protein depletion. b Representative Coomassie stained SDS-PAGE gels of syt1 and syt7 co-sedimentation samples, in the presence and absence of Ca2+, using liposomes composed of DOPC/DOPS or DOPC/DPPS. Throughout the figure, “Input” refers to the protein-only control sample. c Quantification of the replicated syt1 (n = 4) and syt7 (n = 3) co-sedimentation assays comparing binding to DOPS and DPPS containing liposomes. **** and ns represents p < 0.0001 and p = 0.4962, respectively. d Amino acid sequences of the penetration loops of syt1 and syt7 C2A and C2B domains. Unique residues at comparable positions between the two sequences are indicated by an asterisk (*). Unique residues with a difference in charge are indicated by an asterisk and exclamation point (*!). e Representative Coomassie stained SDS-PAGE gels of mutant syt1 and syt7 co-sedimentation samples, in the presence and absence of Ca2+, and liposomes composed of DOPC/DOPS or DOPC/DPPS. f Quantification of the mutant syt1 and syt7 co-sedimentation assays comparing binding to DOPS- and DPPS-bearing liposomes (n = 3). ****, * and ns represents p < 0.0001, p = 0.011 and p = 0.1049, respectively. g Representative Coomassie stained SDS-PAGE gels of WT and mutant syt1 and syt7 co-sedimentation samples containing between 100 and 500 mM salt. h Quantification of the WT and mutant syt1 co-sedimentation samples containing between 100- and 500 mM salt (left panel). Disassembly of Ca2+-dependent WT and mutant syt1 complexes with liposomes, measured by stopped flow rapid mixing with the Ca2+ chelator, EGTA (right panel) (n = 3). i Quantification of experiments performed using WT and mutant syt7, as described in (h) (n = 3). The molecular weights of syt1 and syt7 C2AB and the various mutants in (e, g) are consistent with (b). Each condition was repeated on different days using fresh materials. Error bars represent standard error of the mean. Conditions were compared using the two-sided Student’s t-test.
Fig. 5
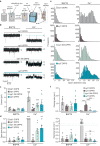
Fig. 5. Membrane penetration is required for syts to trigger the dilated open state of fusion pores.
a Illustration of the modified BLM protocol using lipid desiccation, which facilitated the formation of planar lipid bilayers containing DPPS. b Representative raw traces of syt1, syt1 5 W and syt7 ND-BLM recordings. ND3-syt1 experiments were performed with 20% DOPS in the BLM as a positive control for the effect of Ca2+ on fusion pore properties The remaining traces were performed with 20% DPPS in the BLM, in 0.5 mM BAPTA or 0.5 mM free Ca2+. c Quantification of the current passing through ND-BLM fusion pores under the indicated conditions. The statistical notations refer to comparisons between the corresponding BAPTA (n = 5) and Ca2+ conditions (syt1 DOPS and syt1 DPPS n = 6; syt1 5 W DPPS n = 7; syt7 DPPS n = 8). *** represents p = 0.0008 for syt1 DOPS and p = 0.0004 for syt1 5 W DPPS, * represents p = 0.0267 and ns represents p = 0.2853. d Quantification of the fraction of time that ND-BLM fusion pores remained in the open state under the indicated conditions. The statistical notations refer to comparisons between the corresponding BAPTA (syt1 DOPS and syt1 5 W DPPS n = 4; syt1 DPPS and syt7 DPPS n = 5) and Ca2+ conditions (syt1 DOPS n = 5; syt1 DPPS, syt1 5 W DPPS and syt7 DPPS n = 6). *** represents p = 0.0001; ** represents 0.0043; * represents 0.0491 and ns represents p = 0.9270. e Open dwell time distributions from the indicated ND-BLM fusion pore conditions. The data from each replicated condition are pooled. f Opening and closing rates of ND-BLM fusion pores derived from the indicated closed and open dwell time analyses, respectively. For BAPTA, syt1 DOPS and syt1 5 W DPPS n = 4; syt1 DPPS and syt7 DPPS n = 5. For Ca2+, syt1 DOPS n = 5; syt1 DPPS, syt1 5 W DPPS and syt7 DPPS n = 6). *** represents p = 0.0006 for syt1 DOPS and syt7 DPPS in comparison with syt1 DPPS and p = 0.0005 for syt1 DPPS and syt1 5 W DPPS; ns represents p > 0.05. Each condition in this figure was repeated on different days using fresh materials. Error bars represent standard error of the mean. Conditions were compared using the two-sided Welch t-test.

Similar articles

Cited by

References

    1. Wolfes AC, Dean C. The diversity of synaptotagmin isoforms. Curr. Opin. Neurobiol. 2020;63:198–209. doi: 10.1016/j.conb.2020.04.006. - DOI - PubMed
    1. Brose N, Petrenko AG, Sudhof TC, Jahn R. Synaptotagmin: a calcium sensor on the synaptic vesicle surface. Science. 1992;256:1021. doi: 10.1126/science.1589771. - DOI - PubMed
    1. Li C, et al. Ca2+-dependent and Ca2+-independent activities of neural and nonneural synaptotagmins. Nature. 1995;375:594–599. doi: 10.1038/375594a0. - DOI - PubMed
    1. Bhalla A, Tucker WC, Chapman ER. Synaptotagmin isoforms couple distinct ranges of Ca2+, Ba2+, and Sr2+ concentration to SNARE-mediated membrane fusion. Mol. Biol. Cell. 2005;16:4755–4764. doi: 10.1091/mbc.e05-04-0277. - DOI - PMC - PubMed
    1. Hui E, et al. Three distinct kinetic groupings of the synaptotagmin family: Candidate sensors for rapid and delayed exocytosis. Proc. Natl Acad. Sci. USA. 2005;102:5210–5214. doi: 10.1073/pnas.0500941102. - DOI - PMC - PubMed

MeSH terms