. 2023 Nov 10;24(22):16190.
doi: 10.3390/ijms242216190.

Structural and pKa Estimation of the Amphipathic HR1 in SARS-CoV-2: Insights from Constant pH MD, Linear vs. Nonlinear Normal Mode Analysis

Affiliations

Structural and pKa Estimation of the Amphipathic HR1 in SARS-CoV-2: Insights from Constant pH MD, Linear vs. Nonlinear Normal Mode Analysis

Dayanara Lissette Yánez Arcos et al. Int J Mol Sci. .

Abstract

A comprehensive understanding of molecular interactions and functions is imperative for unraveling the intricacies of viral protein behavior and conformational dynamics during cellular entry. Focusing on the SARS-CoV-2 spike protein (SARS-CoV-2 sp), a Principal Component Analysis (PCA) on a subset comprising 131 A-chain structures in presence of various inhibitors was conducted. Our analyses unveiled a compelling correlation between PCA modes and Anisotropic Network Model (ANM) modes, underscoring the reliability and functional significance of low-frequency modes in adapting to diverse inhibitor binding scenarios. The role of HR1 in viral processing, both linear Normal Mode Analysis (NMA) and Nonlinear NMA were implemented. Linear NMA exhibited substantial inter-structure variability, as evident from a higher Root Mean Square Deviation (RMSD) range (7.30 Å), nonlinear NMA show stability throughout the simulations (RMSD 4.85 Å). Frequency analysis further emphasized that the energy requirements for conformational changes in nonlinear modes are notably lower compared to their linear counterparts. Using simulations of molecular dynamics at constant pH (cpH-MD), we successfully predicted the pKa order of the interconnected residues within the HR1 mutations at lower pH values, suggesting a transition to a post-fusion structure. The pKa determination study illustrates the profound effects of pH variations on protein structure. Key results include pKa values of 9.5179 for lys-921 in the D936H mutant, 9.50 for the D950N mutant, and a slightly higher value of 10.49 for the D936Y variant. To further understand the behavior and physicochemical characteristics of the protein in a biologically relevant setting, we also examine hydrophobic regions in the prefused states of the HR1 protein mutants D950N, D936Y, and D936H in our study. This analysis was conducted to ascertain the hydrophobic moment of the protein within a lipid environment, shedding light on its behavior and physicochemical properties in a biologically relevant context.

Keywords: HR1; SARS-CoV-2; constant pH molecular dynamics; mutations; nonlinear and linear—Normal Mode Analysis; principal component analysis.


Conflict of interest statement

The authors declare no conflict of interest.

Figures

Figure 1
Figure 1
Organization of functional domains in SARS-CoV-2 (a), pre-fusion states (PDB: 6VYB) (b) and post-fusion states (PDB: 6XRA) (c): The N-terminal domain (NTD), receptor-binding domain (RBD), 685 (S1/S2) protease cleavage sites, fusion peptide (FP), heptad repeat (HR1), central helix (CH), connector domain (CD), heptad region 2 (HR2) transmembrane domain (TM), and cytoplasmatic tail (CT). The sequence of the HR1 of this study is shown in a grey box. The trimer chains of the SARS-CoV-2 sp are depicted in different colors: purple for chain A, green for chain B, and yellow for chain C. The structure of HR1 used for this study is highlighted in yellow for the pre-fusion state and in purple for the post-fusion state. 11 identified mutations are shown at the corresponding position and color coded in the HR1 structure.
Figure 9
Figure 9
Linear (a) and nonlinear (b) NMA for HR1. Initial (red), and final (blue) structure of transition. The intermediate states between the initial and final states are shown in gray.
Figure 2
Figure 2
Projection of two-dimensional that illustrates the distribution of various SARS-CoV-2 sp structures based on the lowest-frequency modes of PC1 and PC2. Red Circles: These represent 57 structures with glycoside bound. Blue Points: There are 34 with inhibitor bound. Light-Blue Points: Surrounding the 36 data points in light blue are mutants of SARS-CoV-2 sp.
Figure 3
Figure 3
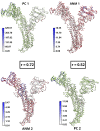
Comparison of PCA (PC1, PC2) and ANM (ANM1, ANM2) trajectories with eigenvector mapping to show the difference; white to blue colored bars represent the magnitude of residual motion in Å. Arrows indicate directions and lengths of eigenvectors corresponding to ANM (red) and PC (green).
Figure 4
Figure 4
(a) SARS-CoV-2 sp monomeric conformation in the open state. Blue arrows: Eigenvector associated with PC1 capturing the dominant conformational change in the SARS-CoV-2 sp monomer. Red arrow: eigenvector based on ANM2. (b) Projection of 131 structures onto PC1 and ANM2: glycosidic linkages, inhibitor linkages, and mutants. Red circles: Glycosidic bond. Blue circles: Inhibitor bond. Light blue circles: mutants.
Figure 5
Figure 5
(a) The network model for the monomeric open state of SARS-CoV-2 of PC1 with corresponding values of the mobility indicated in the color bar by the square fluctuation of the residues are shown as blue and white zones in the network structure in a scale of 0.01 Å to 5.47 Å. (b) Overlap between the 8 PCA modes with the highest rank and the 8 ANM modes with the lowest rank. The orange square in the visualization indicates a strong correlation (0.72) between these modes.
Figure 6
Figure 6
ANM representation of the SARS-CoV-2 sp monomer in the open and closed states. (a) SARS-CoV-2 monomer in the open state. On the left: PCA applied to the experimental structures. On the right: ANM representation of the theoretical structures. (b) SARS-CoV-2 monomer in the closed state. On the left: PCA applied to the experimental structures. On the right: ANM for the theoretical structures. For all generated structures, the residues showing mobility are highlighted in blue. The bar scale (white to blue) indicates the extent of their mobility in Å.
Figure 7
Figure 7
RMSF (Å) of Cα, showing flexibility in 60 residues of 11 mutants, from the pre- (a) and post- (b) fusion states. The y-axis represents the RMSF, while the x-axis corresponds to the amino acid residue numbers. All 11 analyzed mutations are characterized by a specific symbol coding scheme that allows the evaluation of fluctuations in the carbon alpha of the backbone during the simulation. The 11 mutants are marked with different colors.
Figure 8
Figure 8
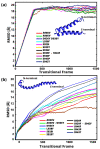
RMSD of backbone Cα shows different flexibility levels between the 60 residues of HR1 and associated mutants, for the pre (a) and post (b) fusional states. All 11 analyzed mutations are characterized by a specific symbol coding scheme.
Figure 10
Figure 10
Distribution of mode number vs. frequency of the 15 lowest modes using (a) Linear-NMA and (b) NonLinear-NMA for the pre (light blue bars) and post (blue bars) fusion of HR1.
Figure 11
Figure 11
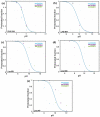
Protonated fraction vs pH of 5 residues of the three mutants (a) Glu 918, (b) Lys 964, (c) Lys 921, (d) Lys 933, (e) Lys 947, titrated in water. The dots represent the protonation ratio, the macroscopic titration curves for the mutant: D936Y (green), D936H (purple), and D950N (light blue). A fitting procedure (blue line) is based on the Henderson-Hasselbalch equation using pKaestimate reference values (Table 3). The error bars indicate the presence of estimated 95% confidence intervals.
Figure 12
Figure 12
Sequence and helical wheel representations of amphipathic structures of HR1 and its mutants, The hydrophobic moment <μH> is denoted to quantify the amphipathicity of the helices, <H> represents hydrophobicity. Hydrophobic and aromatic residues (yellow), charged residues (blue), uncharged polar residues (indigo), and glycine (gray). The hydrophobic phase of the peptide is indicated by the arrows.

Similar articles

References

    1. Zimmerman M.I., Porter J.R., Ward M.D., Singh S., Vithani N., Meller A., Mallimadugula U.L., Kuhn C.E., Borowsky J.H., Wiewiora R.P., et al. SARS-CoV-2 Simulations Go Exascale to Predict Dramatic Spike Opening and Cryptic Pockets across the Proteome. Nat. Chem. 2021;13:651–659. doi: 10.1038/s41557-021-00707-0. - DOI - PMC - PubMed
    1. Hu Y.-B., Dammer E.B., Ren R.-J., Wang G. The Endosomal-Lysosomal System: From Acidification and Cargo Sorting to Neurodegeneration. Transl. Neurodegener. 2015;4:1–10. doi: 10.1186/s40035-015-0041-1. - DOI - PMC - PubMed
    1. Gaudin Y., Ruigrok R.W.H., Brunner J. Low-pH Induced Conformational Changes in Viral Fusion Proteins: Implications for the Fusion Mechanism. J. Gen. Virol. 1995;76:1541–1556. doi: 10.1099/0022-1317-76-7-1541. - DOI - PubMed
    1. Gao J., Gui M., Xiang Y. Structural Intermediates in the Low pH-Induced Transition of Influenza Hemagglutinin. PLoS Pathog. 2020;16:e1009062. doi: 10.1371/journal.ppat.1009062. - DOI - PMC - PubMed
    1. Caffrey M., Lavie A. pH-Dependent Mechanisms of Influenza Infection Mediated by Hemagglutinin. Front. Mol. Biosci. 2021;8:777095. doi: 10.3389/fmolb.2021.777095. - DOI - PMC - PubMed