. 2023 Oct 27;14(11):2005.
doi: 10.3390/genes14112005.

The Novel Link between Gene Expression Profiles of Adult T-Cell Leukemia/Lymphoma Patients' Peripheral Blood Lymphocytes and Ferroptosis Susceptibility

Affiliations

The Novel Link between Gene Expression Profiles of Adult T-Cell Leukemia/Lymphoma Patients' Peripheral Blood Lymphocytes and Ferroptosis Susceptibility

Yu Wang et al. Genes (Basel). .

Abstract

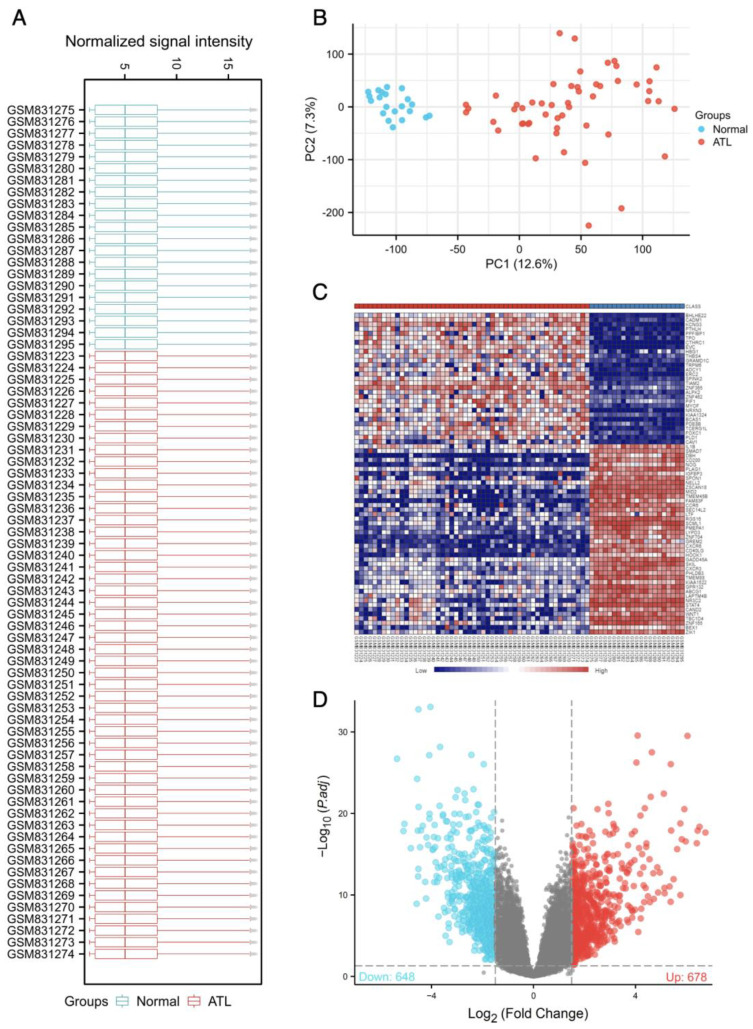
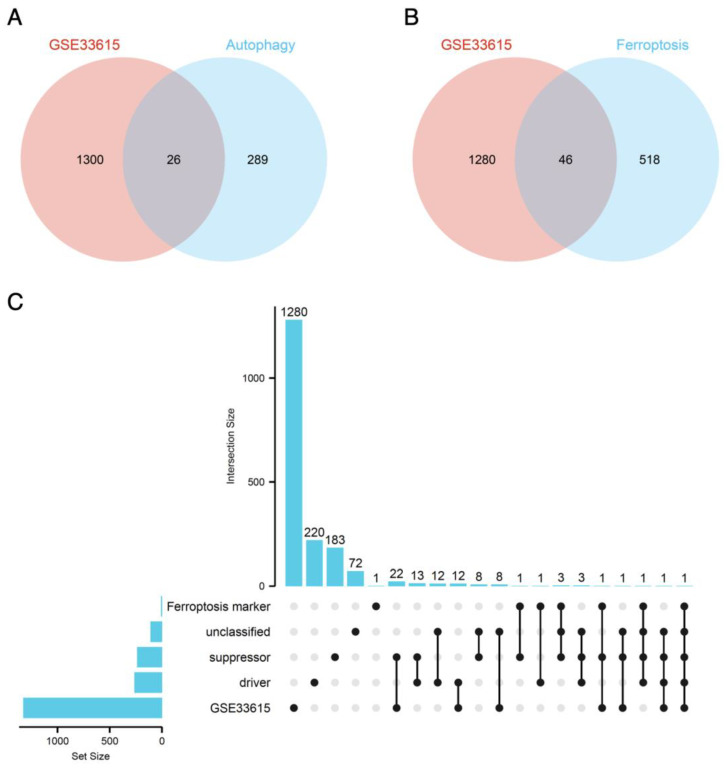
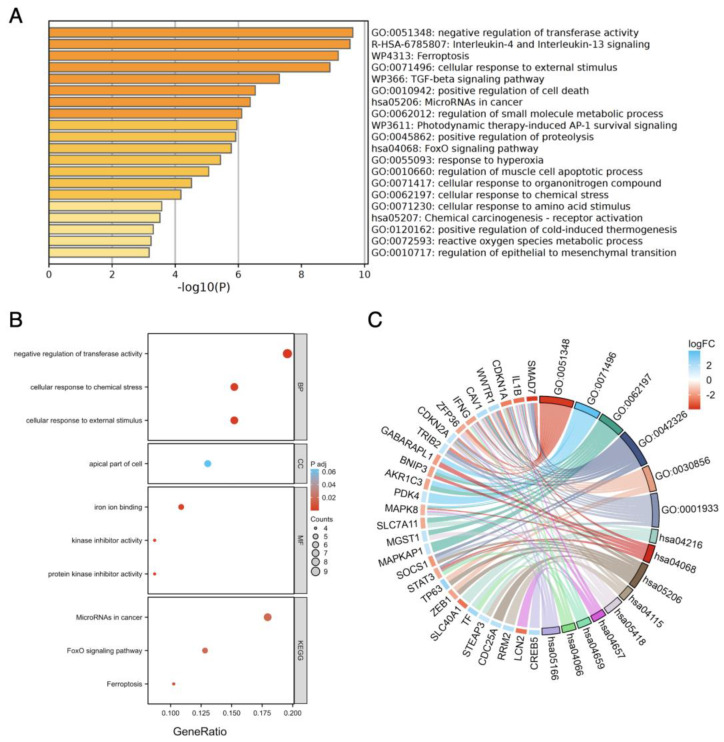
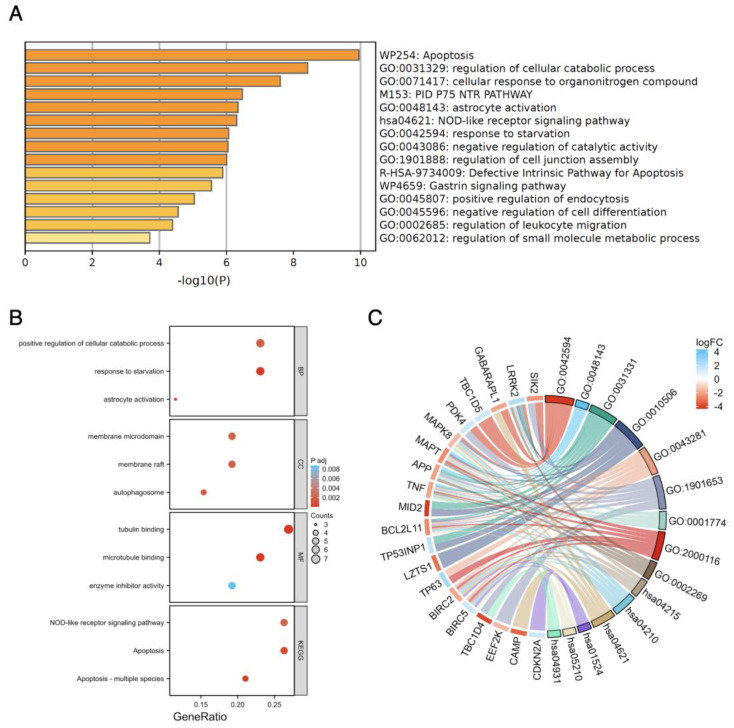
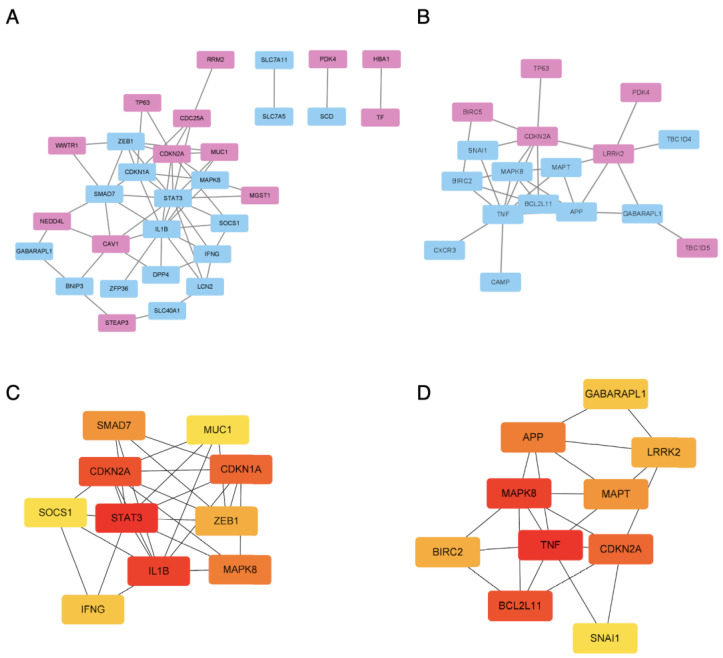
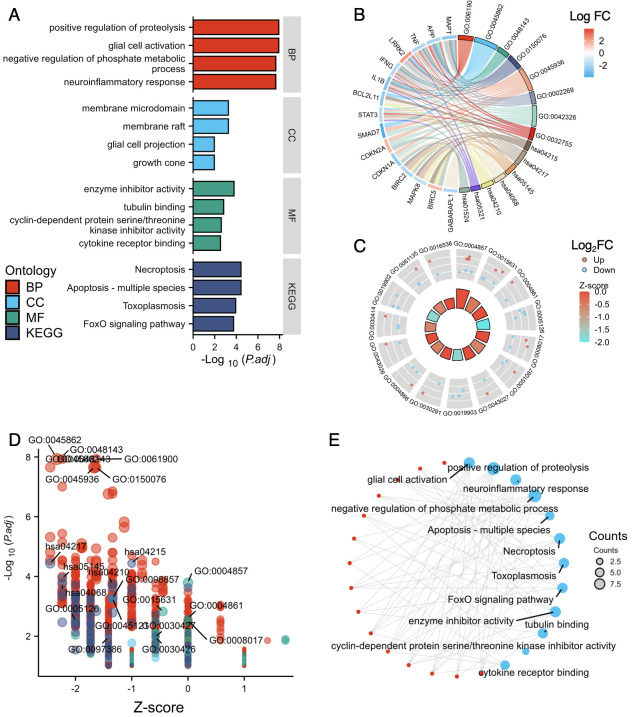
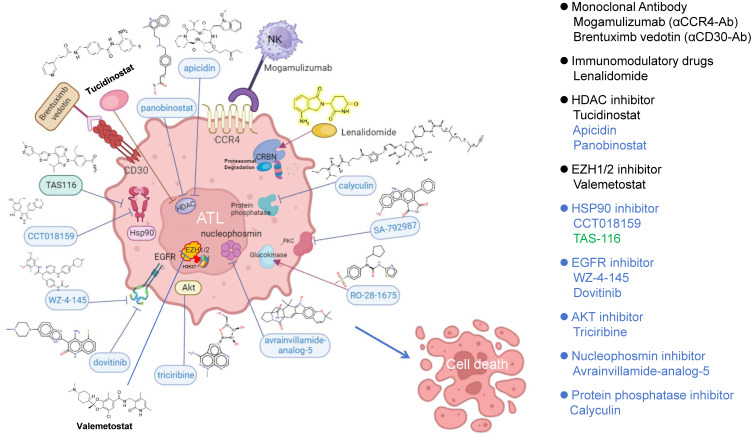
Ferroptosis, a regulated cell death dependent on iron, has garnered attention as a potential broad-spectrum anticancer approach in leukemia research. However, there has been limited ferroptosis research on ATL, an aggressive T-cell malignancy caused by HTLV-1 infection. Our study employs bioinformatic analysis, utilizing dataset GSE33615, to identify 46 ferroptosis-related DEGs and 26 autophagy-related DEGs in ATL cells. These DEGs are associated with various cellular responses, chemical stress, and iron-related pathways. Autophagy-related DEGs are linked to autophagy, apoptosis, NOD-like receptor signaling, TNF signaling, and the insulin resistance pathway. PPI network analysis revealed 10 hub genes and related biomolecules. Moreover, we predicted crucial miRNAs, transcription factors, and potential pharmacological compounds. We also screened the top 20 medications based on upregulated DEGs. In summary, our study establishes an innovative link between ATL treatment and ferroptosis, offering promising avenues for novel therapeutic strategies in ATL.

Keywords: adult T-cell leukemia/lymphoma (ATL); bioinformatic analysis; ferroptosis; precision medicine.


Conflict of interest statement

The authors declare no conflict of interest.

Figures

Figure 1
Figure 1
Identification of DEGs in the ATL GEO dataset GSE33625. (A) The cross−comparability evaluation of microarray data. (B) The gene cluster by PCA loading score. (C) The heat map of the dataset. (D) Volcanic plots of gene expression of ATL in GSE33615. 678 up-regulated genes (red dots) and 648 down-regulated genes (blue dots) were identified with a p-value < 0.05. Gray dots represent genes that are not statistically significant.
Figure 2
Figure 2
The pathway enrichment analysis of ATL whole gene expression profile by dataset GSE336156. (A) The Reactome analysis of GSE33615. (B) The KEGG analysis of GSE33615.
Figure 3
Figure 3
The ferroptosis- and autophagy-related DEGs in GSE33615. (A) A Venn diagram of GSE33615 DEGs and autophagy-related genes. (B) A Venn diagram of GSE33615 DEGs and ferroptosis-related genes. (C) An Upset diagram of GSE33615 DEGs along with ferroptosis marker, driver, suppressor, and unclassified.
Figure 4
Figure 4
The enrichment pathway analysis of ferroptosis−related DEGs. (A) The enrichment pathway analysis of ferroptosis-related DEGs by Metascape. (B) The advanced bubble chart shows GO/KEGG enrichment significant items of ferroptosis-related DEGs via the Xiantao website. (C) The chord plot shows the distribution of DEGs in different GO/KEGG-enriched functions. Symbols of DEGs are shown on the left side with their fold change values mapped by color scale. Gene involvement in each term was determined by colored connecting lines.
Figure 5
Figure 5
The enrichment pathway analysis of autophagy-related DEGs. (A) The enrichment pathway analysis of autophagy-related DEGs by Metascape. (B) The advanced bubble chart shows GO/KEGG enrichment significant items of autophagy-related DEGs via the Xiantao website. (C) The chord plot shows the distribution of DEGs in different GO/KEGG-enriched functions. Symbols of DEGs are shown on the left side with their fold change values mapped by color scale. Gene involvement in each term was determined by colored connecting lines.
Figure 6
Figure 6
The PPI analysis of ferroptosis-related DEGs and autophagy-related DEGs. (A) The PPI analysis of ferroptosis-related DEGs; red represents upregulated genes, blue represents downregulated genes. (B) The PPI analysis of autophagy-related DEGs; red represents upregulated genes, blue represents downregulated genes. (C) The top 10 ferroptosis-related DEGs via MCC. (D) The top 10 autophagy-related DEGs via MCC.
Figure 7
Figure 7
Enrichment pathway analysis of differentially expressed genes related to ferroptosis and autophagy. (A) The histogram shows the GO/KEGG enrichment analysis result of ferroptosis- and autophagy-related DEGs. (B) The chord plot shows the distribution of ferroptosis- and autophagy-related DEGs in different GO/KEGG-enriched functions. (C) The concentric circle graph displays the enrichment result data. The nodes in frame represent co-expressed gene clusters in specific biological process terms; red represents upregulated genes, blue represents downregulated genes. Each column in the inner circle corresponds to a term. The column height represents the p-value, with higher columns indicating smaller p-values. Z-scores are represented by color intensity, with negative values indicating that that rank is lower than expected. (D) The bubble graph illustrates the distribution of all the results obtained by enrichment. The node color represents the category corresponding to the terms. The size of node represents the amount of genes it encompasses. (E) The Cluego network diagram shows the relationship between the DEGs and terms; the blue nodes represent categories, red nodes represent molecules. A connection indicates that the molecule has an annotation for the corresponding categories.
Figure 8
Figure 8
Comparisons of the ferroptosis-related DEGs among ATL, PTCL, and AITL patients PBLs. A Venn diagram of GSE33615 (ATL) and GSE19069 (PTCL and AITL) DEGs.
Figure 9
Figure 9
Approved and ferroptosis-inducing drug candidates for ATL therapy. Four approved molecular targeting drugs (in black), ten potential ferroptosis inducers (in blue), and a novel Hsp90 inhibitor TAS-116 (in green) examined by us [99,100,101].

Similar articles

Cited by

References

    1. Ishitsuka K., Tamura K. Human T-cell leukaemia virus type I and adult T-cell leukaemia-lymphoma. Lancet Oncol. 2014;15:e517–e526. doi: 10.1016/S1470-2045(14)70202-5. - DOI - PubMed
    1. Uchiyama T.Y.J., Sagawa K., Takatsuki K., Uchino H., Uchiyama T., Yodoi J., Sagawa K., Takatsuki K., Uchino H. Adult T-cell leukemia: Clinical and hematologic features of 16 cases. Blood. 1977;50:481–492. doi: 10.1182/blood.V50.3.481.481. - DOI - PubMed
    1. Katsuya H., Ishitsuka K., Utsunomiya A., Hanada S., Eto T., Moriuchi Y., Saburi Y., Miyahara M., Sueoka E., Uike N., et al. Treatment and survival among 1594 patients with ATL. Blood. 2015;126:2570–2577. doi: 10.1182/blood-2015-03-632489. - DOI - PubMed
    1. Takasaki Y., Iwanaga M., Imaizumi Y., Tawara M., Joh T., Kohno T., Yamada Y., Kamihira S., Ikeda S., Miyazaki Y., et al. Long-term study of indolent adult T-cell leukemia-lymphoma. Blood. 2010;115:4337–4343. doi: 10.1182/blood-2009-09-242347. - DOI - PubMed
    1. Gessain A., Cassar O. Epidemiological Aspects and World Distribution of HTLV-1 Infection. Front. Microbiol. 2012;3:388. doi: 10.3389/fmicb.2012.00388. - DOI - PMC - PubMed

Publication types