

Depletion of preexisting B-cell lymphoma 2-expressing senescent cells before vaccination impacts antigen-specific antitumor immune responses in old mice
- PMID: 37997569
- PMCID: PMC10726819
- DOI: 10.1111/acel.14007
Depletion of preexisting B-cell lymphoma 2-expressing senescent cells before vaccination impacts antigen-specific antitumor immune responses in old mice
Abstract
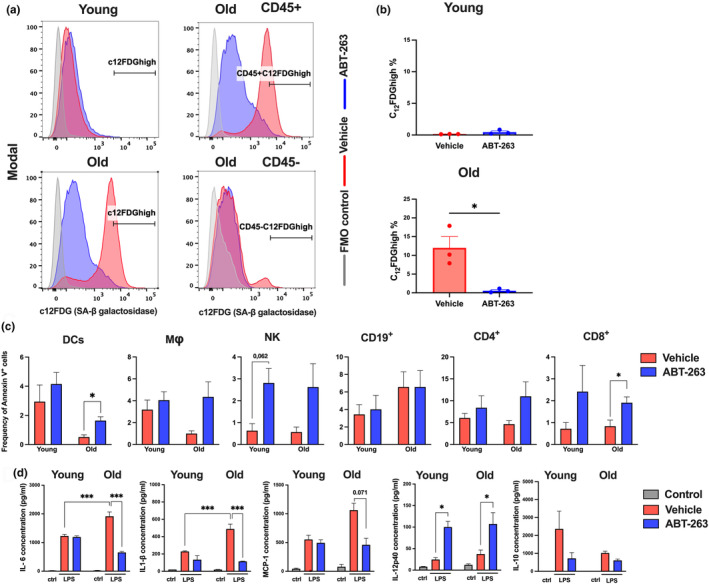
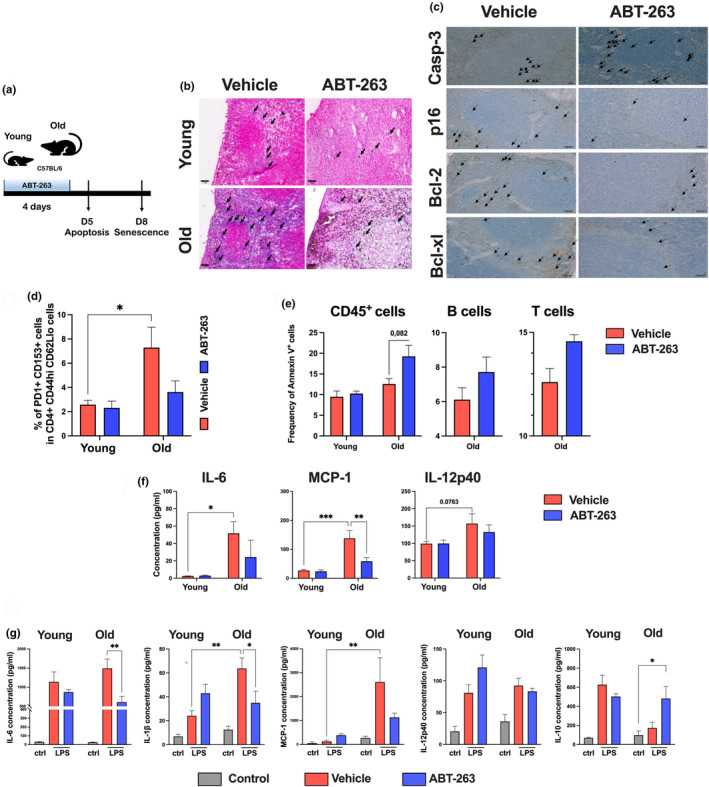
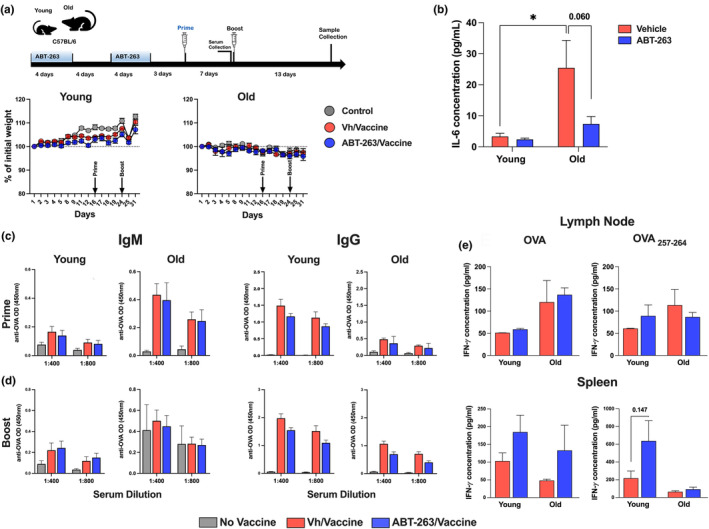
The age-related decline in immunity reduces the effectiveness of vaccines in older adults. Immunosenescence is associated with chronic, low-grade inflammation, and the accumulation of senescent cells. The latter express Bcl-2 family members (providing resistance to cell death) and exhibit a pro-inflammatory, senescence-associated secretory phenotype (SASP). Preexisting senescent cells cause many aging-related disorders and therapeutic means of eliminating these cells have recently gained attention. The potential consequences of senescent cell removal on vaccine efficacy in older individuals are still ignored. We used the Bcl-2 family inhibitor ABT-263 to investigate the effects of pre-vaccination senolysis on immune responses in old mice. Two different ovalbumin (OVA)-containing vaccines (containing a saponin-based or a CpG oligodeoxynucleotide adjuvant) were tested. ABT-263 depleted senescent cells (apoptosis) and ablated the basal and lipopolysaccharide-induced production of SASP-related factors in old mice. Depletion of senescent cells prior to vaccination (prime/boost) had little effect on OVA-specific antibody and T-cell responses (slightly reduced and augmented, respectively). We then used a preclinical melanoma model to test the antitumor potential of senolysis before vaccination (prime with the vaccine and OVA boost by tumor cells). Surprisingly, ABT-263 treatment abrogated the vaccine's ability to protect against B16 melanoma growth in old animals, an effect associated with reduced antigen-specific T-cell responses. Some, but not all, of the effects were age-specific, which suggests that preexisting senescent cells were partly involved. Hence, depletion of senescent cells modifies immune responses to vaccines in some settings and caution should be taken when incorporating senolytics into vaccine-based cancer therapies.
Keywords: Bcl-2; aging; cellular senescence; immune responses; senolytics; tumor growth; vaccination.
© 2023 The Authors. Aging Cell published by Anatomical Society and John Wiley & Sons Ltd.
Conflict of interest statement
The authors declare that the research was conducted in the absence of any commercial or financial relationships that could be construed as a potential conflict of interest.
Figures

Similar articles
-
Cellular Senescence in Diabetes Mellitus: Distinct Senotherapeutic Strategies for Adipose Tissue and Pancreatic β Cells.Front Endocrinol (Lausanne). 2022 Mar 31;13:869414. doi: 10.3389/fendo.2022.869414. eCollection 2022. Front Endocrinol (Lausanne). 2022. PMID: 35432205 Free PMC article. Review.
-
Synergism of BCL-2 family inhibitors facilitates selective elimination of senescent cells.Aging (Albany NY). 2022 Aug 8;14(16):6381-6414. doi: 10.18632/aging.204207. Epub 2022 Aug 8. Aging (Albany NY). 2022. PMID: 35951353 Free PMC article.
-
Senescent cells re-engineered to express soluble programmed death receptor-1 for inhibiting programmed death receptor-1/programmed death ligand-1 as a vaccination approach against breast cancer.Cancer Sci. 2018 Jun;109(6):1753-1763. doi: 10.1111/cas.13618. Epub 2018 May 22. Cancer Sci. 2018. PMID: 29675979 Free PMC article.
-
Early Treg suppression by a listeriolysin-O-expressing E. coli vaccine in heterologous prime-boost vaccination against cancer.Vaccine. 2012 Nov 6;30(48):6903-11. doi: 10.1016/j.vaccine.2012.09.001. Epub 2012 Sep 14. Vaccine. 2012. PMID: 22982404
-
Senescent cell clearance by the immune system: Emerging therapeutic opportunities.Semin Immunol. 2018 Dec;40:101275. doi: 10.1016/j.smim.2019.04.003. Epub 2019 May 11. Semin Immunol. 2018. PMID: 31088710 Free PMC article. Review.
Cited by
-
Mannan-Decorated Lipid Calcium Phosphate Nanoparticle Vaccine Increased the Antitumor Immune Response by Modulating the Tumor Microenvironment.J Funct Biomater. 2024 Aug 16;15(8):229. doi: 10.3390/jfb15080229. J Funct Biomater. 2024. PMID: 39194667 Free PMC article. Review.
References
-
- Acosta, J. C. , Banito, A. , Wuestefeld, T. , Georgilis, A. , Janich, P. , Morton, J. P. , Athineos, D. , Kang, T.‐W. , Lasitschka, F. , Andrulis, M. , Pascual, G. , Morris, K. J. , Khan, S. , Jin, H. , Dharmalingam, G. , Snijders, A. P. , Carroll, T. , Capper, D. , Pritchard, C. , … Gil, J. (2013). A complex secretory program orchestrated by the inflammasome controls paracrine senescence. Nature Cell Biology, 15, 978–990. - PMC - PubMed
-
- Baker, D. J. , Childs, B. G. , Durik, M. , Wijers, M. E. , Sieben, C. J. , Zhong, J. A. , Saltness, R. , Jeganathan, K. B. , Verzosa, G. C. , Pezeshki, A. , Khazaie, K. , Miller, J. D. , & van Deursen, J. M. (2016). Naturally occurring p16Ink4a‐positive cells shorten healthy lifespan. Nature, 530, 184–189. - PMC - PubMed
Publication types
MeSH terms
Substances
Grants and funding
LinkOut - more resources
Full Text Sources
Medical
