. 2023 Dec 21;97(12):e0117923.
doi: 10.1128/jvi.01179-23. Epub 2023 Nov 22.

HIV-1 Gag co-localizes with euchromatin histone marks at the nuclear periphery

Affiliations

HIV-1 Gag co-localizes with euchromatin histone marks at the nuclear periphery

Jordan Chang et al. J Virol. .

Abstract

The traditional view of retrovirus assembly posits that packaging of gRNA by HIV-1 Gag occurs in the cytoplasm or at the plasma membrane. However, our previous studies showing that HIV-1 Gag enters the nucleus and binds to USvRNA at transcription sites suggest that gRNA selection may occur in the nucleus. In the present study, we observed that HIV-1 Gag trafficked to the nucleus and co-localized with USvRNA within 8 hours of expression. In infected T cells (J-Lat 10.6) reactivated from latency and in a HeLa cell line stably expressing an inducible Rev-dependent HIV-1 construct, we found that Gag preferentially localized with euchromatin histone marks associated with enhancer and promoter regions near the nuclear periphery, which is the favored site HIV-1 integration. These observations support the innovative hypothesis that HIV-1 Gag associates with euchromatin-associated histones to localize to active transcription sites, promoting capture of newly synthesized gRNA for packaging.

Keywords: HIV-1 Gag; HIV-1 latency reversal; euchromatin localization; nuclear trafficking; retrovirus assembly; subcellular fractionation.


Conflict of interest statement

The authors declare no conflict of interest.

Figures

Fig 1
Fig 1
Gag nuclear localization occurred within 4 hours in a stable HeLa cell line expressing HIV-1 using a doxycycline-inducible promoter. (A) Schematic of the doxycycline-inducible HIV-1 viral integrant expressing Gag-mCerulean and rtTA plasmids integrated in HeLa cells (HIV-1 Gag-mCerulean rtTA HeLa). The viral expression construct contains a deletion in pol, frameshift mutation in env, mutation of the trans-activation responsive region (TAR), substitution of nef with rtTA, and insertion of TetO sites at the promoter. (B) HIV-1 Gag-mCerulean rtTA HeLa cells were induced with dox (2 µg/mL) in a time-dependent fashion every 4 hours, and subcellular fractionation was performed to isolate cytoplasmic and nuclear lysates. Western blotting was performed to observe full-length HIV-1 Gag. Fraction purity was assessed by calnexin (cytoplasmic) and Med4 (nuclear). (C) Densitometry of immunoblots of cytoplasmic and nuclear fractions at each time point shown as adjusted band volumes. Background subtraction was performed to obtain adjusted band volume. (D) Percent Gag localization was determined by (fraction band volume) / (total band volume of cytoplasmic and nuclear within each time point). Analysis was compiled over three independent replicates. Error bars indicate standard errors of the mean. Statistical significance: ****P < 0.0001.
Fig 2
Fig 2
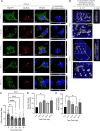
HIV-1 Gag co-localized with unspliced vRNA (USvRNA) shortly after Gag expression in integrated HeLa cells. (A) Confocal images of HIV-1 Gag-mCerulean rtTA HeLa cells at 8, 12, 16, 20, and 24 h.p.i. Visualization of Gag-mCerulean (false-colored green) and USvRNA (false-colored red) in the XY plane. Nuclei of cells were visualized by DAPI stain (blue). Cross-sections of Z-stacks subjected to co-localization analysis identified Gag and USvRNA co-localized signal (white) across XY, YX, and YZ planes. (B) 3D surface renderings of the nucleus (DAPI, blue) and the Gag-USvRNA co-localization channel (white) depict 8 and 24 h.p.i. time points. Bisecting the nucleus with an orthogonal clipping plane and rotating it at 90° demonstrate that Gag and USvRNA co-localization occurs within the nucleus. (C) The percentage of nuclear Gag was calculated from corrected cell fluorescence of confocal images. Quantitative analysis of HIV-1 Gag-mCerulean rtTA HeLa cells induced with doxycycline measuring nuclear HIV-1 Gag co-localization with USvRNA (D) and USvRNA co-localization with Gag (E) by Mander’s coefficient. Error bars indicate standard errors of the mean. Statistical significance: *P < 0.05, **P < 0.01, ***P < 0.001, ****P < 0.0001.
Fig 3
Fig 3
HIV-1 Gag preferentially localized to the euchromatin protein fractions in HeLa cells containing integrated HIV-1 DNA. (A) HIV-1 Gag-mCerulean rtTA HeLa cells were induced using 2-, 20-, 200, and 2,000-ng/mL doxycycline (dox). Gag was detected in euchromatin (Ch150) and heterochromatin (Ch500) fractions by immunoblot using anti-p24 antibody. Calnexin (cytoplasmic), Med4 (nuclear), H3K4me3 (euchromatin), H3K9me3 (heterochromatin), and total H3 (chromatin) were used to assess fraction purity. (B) Analysis of detected bands from Western blot measuring percent gag localization. Due to the lack of signal, 2-ng/mL dox induction was excluded from the analysis. (C) Percent euchromatin was analyzed from H3K4me3 Western blot signals, showing there were no changes in euchromatin levels resulting from dox treatment. (D) HIV-1 Gag-mCerulean rtTA HeLa cells were treated with 20-ng/mL dox in the presence of romidepsin (RMD) or vehicle control (dimethyl sulfoxide [DMSO]), fractionated, and analyzed by Western blot. Anti-p24 antibody was used to detect the Gag protein, and the same fractions were analyzed using anti-calnexin (cytoplasm), H3K4me3 (euchromatin), H3K27ac (euchromatin), H3K9me3 (heterochromatin), and H3 (total chromatin). (E) The percentage of Gag localization was determined via analysis of Gag band volumes. (F) Percent euchromatin was analyzed by H3K4me3 band volume, demonstrating that the addition of RMD increased euchromatin formation, as expected. Error bars indicate standard errors of the mean. Statistical significance: *P < 0.05, **P < 0.01, ***P < 0.001, ****P < 0.0001.
Fig 4
Fig 4
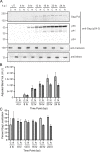
Nuclear Gag localization occurred within 8 hours in latently infected T cells treated with latency-reversal agents. (A) J-Lat 10.6 cells were treated with prostratin (2 µg/mL) every 4 hours for a total of 24 hours. Cells were subjected to subcellular fractionation to isolate cytoplasmic and nuclear protein fractions and probed via Western blot using anti-p24 antibody. Calnexin (cytoplasmic) and Med4 (nuclear) were used to assess fraction purity. (B) Immunoblot analysis of cytoplasmic and nuclear fractions at each time point was performed by measuring band volumes with background subtraction. (C) Percent of Gag localization was determined as shown in Fig. 1D.
Fig 5
Fig 5
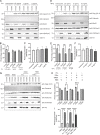
HIV-1 Gag preferentially localized to euchromatin in reactivated latently infected T cells. Western blot of J-Lat 10.6 euchromatin (Ch150) and heterochromatin (Ch500) protein fractions following induction with various concentrations of prostratin (A) or TNF-α (D). Percent Gag localization was determined from the adjusted band volume from Western blots of chromatin fractions following induction by prostratin (B) and TNF-α (E). HIV-1 Gag preferentially localized to the euchromatin fraction at lower levels of drug treatment. Percent euchromatin was analyzed by H3K4me3 band volume for both prostratin (C) and TNF-α (F) inductions. Neither of these drugs used altered euchromatin formation. (G) J-Lat 10.6 cells were separated into euchromatin (Ch150) and heterochromatin (Ch500) following prostratin or TNF-α induction in the presence of RMD. A Western blot probed using anti-p24 antibody was used to determine HIV-1 Gag localization. Fraction purity was assessed by antibodies targeting calnexin (cytoplasm), Med4 (nucleus), H3K4me3, H3K27ac (euchromatin), H3K9me3 (heterochromatin), and total H3 (chromatin). (H) Quantitation of Gag localization was determined by measuring the adjusted band volume of the Western blot. (I) Assessment of percent euchromatin was analyzed through H3K27ac adjusted band volumes, demonstrating that the addition of RMD increases euchromatin formation.
Fig 6
Fig 6
HIV-1 Gag co-localized with euchromatin histone marks at the nuclear periphery. (A) Immunofluorescence of euchromatin (H3K4me3 and H3K27ac) and heterochromatin (H3K9me3) histone mark (red) in HIV-1 Gag-mCerulean rtTA HeLa cells were imaged via confocal microscopy. Cross-sections of Z-stacks revealed that HIV-1 Gag (green) co-localizes (white channel) with each histone mark (white arrows) in the XY, XZ, and YZ planes. The chromatin space is outlined in white dashed lines. To examine the co-localized spots in 3D, surface renderings of Z-stacks of cells expressing Gag and stained for each chromatin mark were generated in Imaris, and the Gag:histone co-localization channel was highlighted by the spot function. (B) Mander’s coefficients of Gag co-localization with H3K4me3, H3K27ac, and H3K9me3 were calculated using the Imaris co-localization function. (C) The distance of Gag:histone co-localized spots to the periphery of the chromatin surface rendering was measured using Imaris. Error bars denote standard errors of the mean. Statistical significance: ****P < 0.0001.
Fig 7
Fig 7
Proposed model of HIV-1 Gag localization to the euchromatin at the nuclear periphery to facilitate gRNA packaging. Our results demonstrate that HIV-1 Gag is imported into the nucleus shortly after induction of viral gene expression or reactivation from latency. Once within the nucleus, HIV-1 Gag preferentially localizes with euchromatin marks associated with active promoters and enhancers near the outer edge of the nucleus. The model proposes that a subset of HIV-1 Gag is imported to the nucleus and associates with euchromatin marks at the nuclear periphery, where the provirus tends to be integrated. HIV-1 Gag may select and bind USvRNA co-transcriptionally for packaging into new virions. This figure was created with BioRender.

Update of

Similar articles

Cited by

References

    1. Dieudonné M, Maiuri P, Biancotto C, Knezevich A, Kula A, Lusic M, Marcello A. 2009. Transcriptional competence of the integrated HIV-1 provirus at the nuclear periphery. EMBO J 28:2231–2243. doi:10.1038/emboj.2009.141 - DOI - PMC - PubMed
    1. Albanese A, Arosio D, Terreni M, Cereseto A. 2008. HIV-1 pre-integration complexes selectively target decondensed chromatin in the nuclear periphery. PLoS One 3:e2413. doi:10.1371/journal.pone.0002413 - DOI - PMC - PubMed
    1. Burdick RC, Deleage C, Duchon A, Estes JD, Hu W-S, Pathak VK. 2022. Intranuclear positions of HIV-1 proviruses are dynamic and do not correlate with transcriptional activity. mBio 13:e0325621. doi:10.1128/mbio.03256-21 - DOI - PMC - PubMed
    1. Marini B, Kertesz-Farkas A, Ali H, Lucic B, Lisek K, Manganaro L, Pongor S, Luzzati R, Recchia A, Mavilio F, Giacca M, Lusic M. 2015. Nuclear architecture dictates HIV-1 integration site selection. Nature 521:227–231. doi:10.1038/nature14226 - DOI - PubMed
    1. Lelek M, Casartelli N, Pellin D, Rizzi E, Souque P, Severgnini M, Di Serio C, Fricke T, Diaz-Griffero F, Zimmer C, Charneau P, Di Nunzio F. 2015. Chromatin organization at the nuclear pore favours HIV replication. Nat Commun 6:6483. doi:10.1038/ncomms7483 - DOI - PMC - PubMed

Substances