[Preprint]. 2023 Nov 10:2023.11.10.566462.
doi: 10.1101/2023.11.10.566462.

c-Jun Signaling During Initial HSV-1 Infection Modulates Latency to Enhance Later Reactivation in addition to Directly Promoting the Progression to Full Reactivation

Affiliations

c-Jun Signaling During Initial HSV-1 Infection Modulates Latency to Enhance Later Reactivation in addition to Directly Promoting the Progression to Full Reactivation

Sara A Dochnal et al. bioRxiv. .

Update in

Abstract

Herpes simplex virus-1 (HSV-1) establishes a latent infection in peripheral neurons and can periodically reactivate to permit transmission and clinical manifestations. Viral transactivators required for lytic infection are largely absent during latent infection and therefore HSV-1 relies on the co-option of neuronal host signaling pathways to initiate its gene expression. Activation of the neuronal c-Jun N-terminal kinase (JNK) cell stress pathway is central to initiating biphasic reactivation in response to multiple stimuli. However, how host factors work with JNK to stimulate the initial wave of gene expression (known as Phase I) or the progression to full, Phase II reactivation remains unclear. Here, we found that c-Jun, the primary target downstream of neuronal JNK cell stress signaling, functions during reactivation but not during the JNK-mediated initiation of Phase I gene expression. Instead, c-Jun was required for the transition from Phase I to full HSV-1 reactivation and was detected in viral replication compartments of reactivating neurons. Interestingly, we also identified a role for both c-Jun and enhanced neuronal stress during initial neuronal infection in promoting a more reactivation-competent form of HSV-1 latency. Therefore, c-Jun functions at multiple stages during HSV latent infection of neurons to promote reactivation. Importantly, by demonstrating that initial infection conditions can contribute to later reactivation abilities, this study highlights the potential for latently infected neurons to maintain a molecular scar of previous exposure to neuronal stressors.


Figures
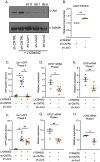
Figure 1:
Figure 1:. c-Jun depletion prior to latency establishment limits both Phase I gene expression and full reactivation.
A) Neurons were transduced with a non-targeting shRNA control lentivirus or one of three independent lentiviruses expressing shRNAs that target Jun (sh-cJun1, sh-cJun2, sh-cJun3). 5 days post transduction, LY294002 was added to neurons for 18 hours and western blotting for c-Jun or α-tubulin was performed. The percentage knockdown of c-Jun normalized to α-tubulin is shown. B-H) Following c-Jun depletion with sh-cJun3 (B-E) or sh-cJun2 (F-H), primary neurons were infected with Stayput-GFP at an MOI of 7.5 PFU/cell in the presence of acyclovir (ACV; 50 μM) for six days and then reactivated two days after the removal of acyclovir with LY294002 (20 μM). B) Quantification of relative latent viral DNA load at 8 days post-infection. Biological replicates from 3 separate dissections C & F) Quantification of the number of GFP-positive neurons at 48 hours post-stimulus. Individual biological replicates from at least 3 individual dissections. D-E, G-H) Relative viral gene expression at 18 hours post-stimulus compared to latent samples quantified by RT-qPCR for ICP27 (D,G), ICP8 (E,H) normalized to cellular control mGAPDH. Statistical comparisons were made using normal or non-normal (Wilcoxon, B, C, F) Paired t-Test. Biological replicates from at least 3 individual dissections. Individual biological replicates along with the means and SEMs are represented. * P < 0.05; ** P < 0.01.
Figure 2:
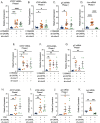
Figure 2:. c-Jun is not necessary for Phase I gene expression.
(A-K) Latently infected neurons were transduced with a non-targeting shRNA lentivirus or sh-cJun3, sh-cJun2, or sh-cJun1 at 6 days post-infection and reactivated 5 days later. In (A-G) neurons were reactivated with LY294002 and in (H-K) with forskolin. RT-qPCR was carried out at 18 hours post-reactivation for; ICP27 (A, E, & H), ICP8 (B, F, & I), gC (C, G, & J) and cellular Jun (D&K) at 18 hours post-stimulus is represented. N=6 biological replicates from at least 3 independent dissections. Statistical comparisons were made using non-normal (Mann-Whitney) t-Test. Individual biological replicates along with the means and SEMs are represented. * P < 0.05; ** P < 0.01.
Figure 3:
Figure 3:. c-Jun is necessary for full HSV-1 reactivation.
(A-F) Neurons were infected with HSV-1 and transduced at 6 days post-infection with a non-targeting shRNA lentivirus or sh-cJun3 (A-F) or sh-cJun2 (G-J) and reactivated 5 days later. Acyclovir was added for the first six days post-infection. (A,G) Quantification of Us11-GFP-positive neurons following reactivation with LY294002. (B-E, H-I) RT-qPCR for viral mRNA transcripts ICP27 (B), ICP8 (C), VP16 (D,H) gC (E,I), at 48 hours post-reactivation with LY294002. (F,J) Quantification of Us11-GFP-positive neurons following reactivation with forskolin. Individual replicates from at least 4 separate dissections are shown. Statistics determined by normal or non-normal (Wilcoxon-test, A, F-J) paired T-test. Individual biological replicates along with the means and SEMs are represented. * P < 0.05; ** P < 0.01. ns, not significant.
Figure 4:
Figure 4:. c-Jun is necessary for maximum de novo lytic infection in neurons.
(A-H) Neurons were transduced with a non-targeting shRNA lentivirus or sh-cJun3 and infected with HSV-1 Stayput-GFP in the absence of viral DNA replication inhibitors 5 days post-transduction at an MOI of 5 PFU/cell for 48 hours. (A) Quantification of the numbers of GFP-positive neurons. Replicates from 3 separate dissections are shown; Unpaired t-test. (B) qPCR for viral DNA copy number. (C) RT-qPCR for viral mRNAs ICP27, ICP8, VP16, and gC. (D) RT-qPCR for Jun. Replicates from 3 separate dissections are shown; Paired t-test. Individual biological replicates along with the means and SEMs are represented. * P < 0.05; ** P < 0.01.
Figure 5:
Figure 5:. c-Jun colocalizes with replicating viral DNA during HSV-1 reactivation.
(A-B) Latently infected neurons were reactivated with LY294002 and pulsed with 10 μM EdC for 1 hour to label viral DNA replication compartments. Nuclear stain Hoechst is shown in blue, and immunofluorescence was performed to visualize c-Jun in green. EdC-Pulse was visualized using click chemistry (shown in red). (A) Representative images of reactivating neurons. Scale bar = 10 μm. Pearson’s coefficient between c-Jun and EdC-Pulse featured in bottom left corner of merge. (B) Compiled Pearson’s coefficients. 35 individual neurons; 2 biological replicates.
Figure 6:
Figure 6:. Stress Signaling Events during De Novo HSV-1 Infection
(A-C) Neonatal sympathetic cultures were infected with Stayput-GFP in inoculation media with or without nerve growth factor (NGF) for 3.5 hours and subsequently fixed and stained for neuronal marker B III tubulin (magenta) or phosphorylated c-Jun (orange). Representative image of nuclear phosphorylated c-Jun is demonstrated Scale bar = 10 μm. (B) Mean signal intensity for phosphorylated c-Jun in the nucleus following infection. N=100 from 1 biological replicate. (C) Quantification of proportion of neurons with pc-Jun-positive nuclei pooled from several fields of view. (D-G) Neuronal cultures were latently infected. NGF was either included or omitted during the 3.5 hours inoculation period. Cultures were later reactivated with LY294002 20 μM. (D) Latent viral DNA load. Replicates from 3 dissections shown. The peak number of GFP-positive neurons 48 hours post-stimulus (E) and relative expression of ICP27 (F) or ICP8 (G) transcripts 18 hours post-stimulus were quantified to analyze full reactivation and Phase I gene expression, respectively. Replicates from 3 dissections shown. Statistical comparisons were made using normal or non-normal (Mann-Whitney, E) t-Test. Individual biological replicates along with the means and SEMs are represented. * P < 0.05; ** P < 0.01.

Similar articles

References

    1. Knipe DM, Cliffe A. 2008. Chromatin control of herpes simplex virus lytic and latent infection. Nat Rev Microbiol 6:211–21. - PubMed
    1. Matthews SM, Groves IJ, O’Connor CM. 2023. Chromatin control of human cytomegalovirus infection. mBio 14:e0032623. - PMC - PubMed
    1. Collins-McMillen D, Buehler J, Peppenelli M, Goodrum F. 2018. Molecular Determinants and the Regulation of Human Cytomegalovirus Latency and Reactivation. Viruses 10. - PMC - PubMed
    1. Guo R, Gewurz BE. 2022. Epigenetic control of the Epstein-Barr lifecycle. Curr Opin Virol 52:78–88. - PMC - PubMed
    1. Chen HS, Lu F, Lieberman PM. 2013. Epigenetic regulation of EBV and KSHV latency. Curr Opin Virol 3:251–9. - PMC - PubMed

Publication types