[Preprint]. 2023 Nov 11:2023.11.08.566246.
doi: 10.1101/2023.11.08.566246.

Systematic Dissection of Sequence Features Affecting the Binding Specificity of a Pioneer Factor Reveals Binding Synergy Between FOXA1 and AP-1

Affiliations

Systematic Dissection of Sequence Features Affecting the Binding Specificity of a Pioneer Factor Reveals Binding Synergy Between FOXA1 and AP-1

Cheng Xu et al. bioRxiv. .

Update in

Abstract

Despite the unique ability of pioneer transcription factors (PFs) to target nucleosomal sites in closed chromatin, they only bind a small fraction of their genomic motifs. The underlying mechanism of this selectivity is not well understood. Here, we design a high-throughput assay called ChIP-ISO to systematically dissect sequence features affecting the binding specificity of a classic PF, FOXA1. Combining ChIP-ISO with in vitro and neural network analyses, we find that 1) FOXA1 binding is strongly affected by co-binding TFs AP-1 and CEBPB, 2) FOXA1 and AP-1 show binding cooperativity in vitro, 3) FOXA1's binding is determined more by local sequences than chromatin context, including eu-/heterochromatin, and 4) AP-1 is partially responsible for differential binding of FOXA1 in different cell types. Our study presents a framework for elucidating genetic rules underlying PF binding specificity and reveals a mechanism for context-specific regulation of its binding.


Figures

Extended Data Fig. 1.
Extended Data Fig. 1.. PFs in yeast, but not in mammalian cells, bind to a large fraction of their consensus.
a) Bound fraction as a function of motif score for yeast PFs, Abf1 (left) and Reb1 (right). Dotted line represents the fraction of perfect consensus motifs that are occupied by the corresponding PFs. Abf1 and Reb1 binding data are from Ref 29. b, Same as panel a, but for human pioneer factor FOXA1 in MCF-7 cells (left) and A549 cells (right).
Extended Data Fig. 2.
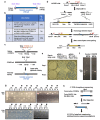
Extended Data Fig. 2.. ChIP-ISO procedure and quality test.
a) Diagram of ChIP-ISO library oligonucleotide design. The variable region of each sequence spans 193 bp, as indicated in blue. The BsaI / BbsI is the restriction enzyme recognition sites engineered in the 18 bp flanking primer sequences. b) Table summarizing the three subsets of our ChIP-ISO oligonucleotide library. c) Plasmid construction strategy. We start off with the native CCND1 enhancer sequence, cloned into the pAAVS1-Nst-MCS plasmid background. We then delete a 193 bp region containing all three FOXA1 binding sites, as well as a BbsI cutting site, and replace it with two BsaI cutting sites. Finally, we ligate the 193 bp ChIP-ISO oligonucleotides (blue) into this plasmid using the BsaI sites. Grey arrows represent primers used for ChIP-ISO amplicon sequencing. d) Strategy for integration of the plasmid library into the AAVS1 site using CRISPR/Cas9. Double-strand break is generated at the AAVS1 site by pSpCas9 (1.1). The region containing library and background sequences, as well as the selection marker (Neo), is integrated into the AAVS1 site (inside the first intron of PPP1R12C gene) by homology-directed repair. If integrated successfully, the promoterless Neo gene will be transcribed together with the endogenous PPP1R12C gene, and RNA splicing will happen between exon 1 and the splicing acceptor (SA) site. A 2A peptide is engineered before the Neo gene to make sure the translated Neo protein is folded independently. HA-L, left homologous arm; HA-R, right homologous arm. WT, a primer pair amplifying unintegrated AAVS1 site; KI, a primer pair amplifying AAVS1 site with successful integration. e) A549 colonies after integration with no Cas9 (left, control), eSpCas9, and wt Cas9. The colonies are selected with G418 for 12 days, and stained with methylene blue. f) PCR test on mixed colonies after integration. The “KI” primer pair (see d) amplifies across the integration junction, and therefore the band is only visible when the plasmid sequence is integrated into the right locus. g) Same as in panel f except that the PCR is carried out in 18 single colonies. 15 out of the 18 colonies show the right PCR band. h) Strategy of amplicon sequencing. After first round of PCR using the primer pair in panel c, we perform BbsI digestion, which cuts the native CCND1 enhancers, but not the synthetic ones. The second round PCR (with sequencing adaptors) can therefore selectively amplify the ISO library for sequencing.
Extended Data Fig. 3.
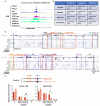
Extended Data Fig. 3.. CCND1 enhancer sequence and low-throughput test.
a) Genomic tracks of TF and histone modification ChIP-seq and ATAC-seq signals at the CCND1 enhancer in WT A549 cells. b) Conservation of DNA sequence within the ~200 bp CCND1 enhancer. Blue: conserved nucleotide, brown: non-conserved. TF motifs are outlined and color coded. Vertical black lines marks the exact 193 bp sequences use in our ISO library. c) Manipulation of the FOXA1 motifs in the CCND1 enhancer. Each motif is mutated, orientation reversed, or converted into a perfect consensus. d) Low-throughput FOXA1 and FOSL2 ChIP-qPCR for three biological replicates showing the impact of the AP-1 motif on their binding. P: positive control, Native: native CCND1 enhancer, Knock-in = AAVS1-integrated CCND1 enhancer (wt or AP-1 mut), N: negative control. *: p < 0.05, **: p < 0.01.
Extended Data Fig. 4.
Extended Data Fig. 4.. Genome-wide FOX1 / TF co-binding.
a) The same as Fig. 3a lower panel, except the x axis represents the percentage of a TF ChIP-seq peaks overlapped with FOXA1 peaks (Fig. 3a is the percentage of the overlapped FOXA1 peaks). b) Two examples of native sequence with co-binding events included in our ISO library. Top: a sequence with both FOSL2 and FOXA1 ChIP-seq peaks and their motifs in proximity. Dotted lines represent the boundaries of the ~200 bp library sequence. Blue bar: FOSL2 motif, orange bar: FOXA1 motif. Bottom: Same as top, but for a sequence with CEBPB / FOXA1 overlap. c) Histogram showing distributions of scores given by a sequence-trained CNN to sequences that were tested by ChIP-ISO, where the sequences are grouped according to ChIP-ISO signal. The CNN is trained to predict FOXA1 ChIP-seq data in A549 cells. d) Heatmap showing DeepLIFT-Shap feature attribution scores from the sequence-trained CNN at eight CCND1 enhancer variants. e) Top two motifs detected by TF-MoDISco in the genome-wide DeepLIFT-Shap negative feature attribution scores. The TF family of matching motifs is annotated for each motif, as is the number of seqlets used by TF-MoDISco to construct each motif.
Extended Data Fig. 5.
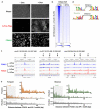
Extended Data Fig. 5.. Imaging and genomic data ± A-Fos induction.
a) Immunostaining of FLAG-tagged A-Fos and FOXA1 ± A-Fos induction. Scale bar: 20 μm. b) Heatmaps showing FOSL2 ChIP-seq signal across genome-wide FOSL2 binding sites ± A-Fos induction. c) More genomic tracks of FOSL2 and FOXA1 ChIP-seq ± A-Fos induction. Arrows 1-3 demarcate examples of AP-1 unique, AP-1 / FOXA1 overlapped, and FOXA1 unique sites, respectively. d) Definition of the forward and reverse orientation between FOXA1 and AP-1 motifs, as well as the distance in between. e) Distribution of the distances between FOXA1 and AP-1 motifs in the lost and unchanged sites upon A-Fos induction. The motif pairs with two different orientations are separately analyzed.
Extended Data Fig. 6.
Extended Data Fig. 6.. Differential expression analysis of the RNAseq ± A-Fos induction.
a) Volcano plot of RNAseq counts in ± A-Fos conditions. Red and blue represent up-regulated vs down-regulated genes in the presence of A-Fos induction, respectively. b) Differential regulation of genes proximal to lost, unchanged, and gained FOXA1 peaks. The genes close to the lost peaks are more likely to be down-regulated. c) CCND1 mRNA is downregulated in the presence of A-Fos, consistent with the lost of FOXA1 binding in the CCND1 enhancer.
Extended Data Fig. 7.
Extended Data Fig. 7.. More information related to in vitro EMSA-seq experiment.
a) Gel of recombinant proteins. Purified proteins were run on an 18% SDS-PAGE gel and stained with Coomassie Brilliant Blue. M: Molecular weight marker. b) Correlation between two EMSA-seq biological replicates. Both x and y axis shows the fraction bound at 15 nM FOXA1. c) Correlation between in vitro binding strength (fraction bound at 15 nM FOXA1) and total FOXA1 motif score in the CCND1 enhancer subset of the ISO library. Green, yellow, orange, and red dots correspond to CCND1 variants with three, two, one, or zero FOXA1 motifs. d) Plots showing five DNA shape parameters averaged across four sets of FOXA1 binding sites. DNA shape parameters include electrostatic potential (EP), helix twist (HelT), minor groove width (MGW), propeller twist (ProT), and roll. Four colors represent different range of in vitro binding strength. e) Box-and-whisker plots showing the changes of FOXA1 EMSA-seq signal on templates ±AP-1 motif.
Extended Data Fig. 8.
Extended Data Fig. 8.. The effect of chromatin states on FOXA1 binding.
a) Genomic tracks of TF and histone modification ChIP-seq and ATAC-seq signals at the AAVS1 safe-harbor locus in WT A549 cells. Arrow indicates locus where library sequences were inserted. The insertion site is near active histone marks, but not the repressive ones. b) ChIP-seq signals of repressive histone marks near the native sequences included in our ISO library in Fig. 6A. c) Heatmap of FOXA1, H3K9me3, H3K27me3, FOSL2, and Jun ChIP-seq signals for a set of ChIP-ISO library sequences derived from H3K27me3-marked genomic loci (top) and a set of control sequences with comparable FOXA1 binding level derived from euchromatic loci (bottom). d) Violin plot of H3K27me3 ChIP-seq signals for sequences in panel c at their native genomic loci (left) and ChIP-ISO signals of the same sequences at AAVS1 (right). Dark green: H3K27me3 set, and light green: control set from panel c. ****: p < 0.0001 and ns: non-significant. e) Same as panel d, but for FOXA1.
Extended Data Fig. 9.
Extended Data Fig. 9.. Differential binding of FOXA1 in HepG2 and MCF-7.
a) Immunostaining of FOXA1 (green), FOSL1 (red), and nuclei (DAPI) in fixed A549, HepG2, and MCF-7 cells. Right: Violin plots showing normalized FOXA1 (top) and FOSL1 (bottom) intensities in these three cell lines. Scale bar: 20 μm. b) Differential FOXA1 binding analysis in A549 and HepG2 cells, with heatmaps showing common (upper), A549-specific (middle), and HepG2-specific (bottom) peaks. FOSL2 and JUND ChIP-seq signals over the same regions are shown on the right.
Extended Data Fig. 10.
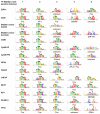
Extended Data Fig. 10.. Motifs that are predictive of FOXA1 binding in sequence-trained CNNs.
Top ranking motifs detected by TF-MoDISco in the genome-wide DeepLIFT-Shap positive feature attribution scores at sites predicted by a sequence-trained CNN to be bound by FOXA1 in a selection of cell types for which FOXA1 ChIP-seq data is available. The top five ranking motifs are shown, unless TF-MoDISco returned fewer than five motifs. The TF family of best-matching motifs is annotated for each motif.
Fig 1:
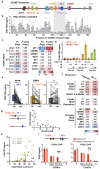
Fig 1:. ChIP-ISO assay allows highly parallel measurements of FOXA1 binding to thousands of integrated synthetic sequences.
a) Workflows for ChIP-ISO (1), EMSA-seq (2), and neural network analysis (3). b) Reproducibility of FOXA1 ChIP-ISO signal across two biological replicates. Black / gray dots represent sequences containing WT / mutated FOXA1 motifs. r: Pearson correlation. c) Histogram of the FOXA1 ChIP-ISO signals with the entire ISO library, fit by two Gaussian peaks (green and yellow: low and high peaks, respectively; red: superposition of the two). d) Comparison of FOXA1 ChIP-ISO signals with low-throughput ChIP-qPCR signals from three biological replicates over three individual ISO library sequences.
Fig 2:
Fig 2:. Co-binding of AP-1 strongly enhances FOXA1 binding to the CCND1e enhancer.
a) Map of the 193bp portion of the CCND1e explored in this study (chr11:69,654,913-69,655,105). Three FOXA1 motifs (orientations depicted by arrow directions) and motifs of potential co-binding TFs are labeled. b) ChIP-ISO signals over CCND1e variants containing scrambled sequences in a 10bp moving window (step size: 3bp). Bar: averaged ChIP-ISO signal; Dot: data from individual replica; X: missing data. Gray box highlights an area where the scrambles lead to particularly low FOXA1 ChIP-ISO signals, indicating that these sequences are critical for FOXA1 binding. c) The effect on FOXA1 binding by manipulating individual FOXA1 motifs (left) or mutating co-factor motifs (right). Each FOXA1 motif is either mutated (mut), orientation-reversed (rev), or converted into the strongest consensus (con). Both tables list the fold change and statistical significance of FOXA1 ChIP-ISO signal caused by these sequence variations. Two-tailed paired t-test. d) Example FOXA1 ChIP-ISO signals over CCND1e variants containing 0, 1, 2, or 3 original (ori) FOXA1 motifs or 1 consensus (con) FOXA1 motif. X: missing data. e) Box-and-whisker plots showing FOXA1 ChIP-ISO signals over otherwise identical CCND1e sequences containing WT or mutated AP-1, CEBPB, or SP1 motifs. Paired sequences are connected by a line. ****: p < 0.0001, ***: p < 0.001, **: p < 0.01, and ns: non-significant based on two-tailed paired t-test (same below, unless specified). f) Pearson correlation coefficient between FOXA1 ChIP-ISO signals and CCND1 sequence variables, calculated using the total set or the subset containing an AP-1 motif. These numbers reflect the level of impact of each variable on FOXA1 binding. g) FOXA1 ChIP-ISO signal as a function of the linear distance between the 3rd FOXA1 motif and the AP-1 motif. h) Relation between the FOXA1 ChIP-ISO signal and the total FOXA1 motif score over CCND1 variants ± AP-1 / CEBPB motifs. i) Effect of FOXA1 on AP-1 binding. Bar plots show FOXA1 and FOSL2 ChIP-qPCR for three biological replicates over integrated WT CCND1e or a variant with all three FOXA1 motifs mutated (Knock-in). ChIP-qPCR over a positive / negative control locus (P and N) and the native CCND1e are also shown. Error bars represent standard error (same below, unless specified).
Fig 3:
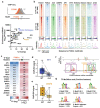
Fig 3:. AP-1 and CEBPB co-bind with FOXA1 and assist its binding genome-wide.
a) Bioinformatic analysis of FOXA1/TF co-binding. Top: Schematics of co-binding events. Bottom: for each TF, the dot plot shows the percentage of the overlapped FOXA1 ChIP-seq peaks (x axis) and the enrichment of its motif within FOXA1 peaks (y axis). TFs chosen for further analysis are labeled. AP-1 subunits are indicated in blue. b) Heatmaps of ChIP-seq / ATAC-seq and the corresponding intensity profiles in WT A549 cells over FOXA1 binding regions separated based on FOXA1 motif scores. Sequences in the top section contain strong consensus motifs (score >16), and the ones at the bottom contain weak motifs (score < 12). c) The effect on FOXA1 binding by mutating co-factor motifs. The ISO set used in panel c-e is derived from genomic sequences that show overlapped FOXA1 and TF ChIP-seq peaks in A549 and contain both motifs in proximity (<30bp). The table lists the fold change and statistical significance of FOXA1 ChIP-ISO signal upon mutations of co-factor motifs in these sequences. Two-tailed paired t-test. d & e) Box-and-whisker plots showing the changes of FOXA1 ChIP-ISO signal upon mutations of AP-1 (d) or CEBPB motif (e). f) DeepLIFT-Shap feature attribution scores highlighting features used by a sequence-trained CNN to predict FOXA1 binding in A549 cells at the CCND1e. g) Top 5 motifs detected by TF-MoDISco in the genome-wide DeepLIFT-Shap positive feature attribution scores at sites predicted by the CNN to be bound by FOXA1. The TF family of matching motifs is annotated for each motif, as is the number of seqlets used by TF-MoDISco to construct each motif.
Fig 4:
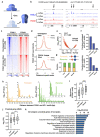
Fig 4:. AP-1 inhibition leads to motif-directed redistribution of FOXA1 binding in the genome.
a) Schematic showing the effect of A-FOS induction. Upon doxycycline-induced overexpression of A-FOS, it dimerizes with Jun and thus prevents Fos:Jun heterodimer formation and chromatin binding. b) Representative genomic tracks of FosL2 and FOXA1 ChIP-seq ± A-FOS induction in WT A549 cells. Arrows 1-3 demarcate examples of AP-1 unique, AP-1 / FOXA1 overlapped, and FOXA1 unique sites, respectively. In the presence of A-FOS, FOXA1 binding is significantly reduced at the overlapped site (2), but not the unique site (3). c) Heatmap of FosL2 and FOXA1 ChIP-seq signals over AP-1 / FOXA1 overlapped sites and FOXA1 unique sites ± A-FOS. d) Profiles of the average FOXA1 ChIP-seq intensities in panel c. e) Volcano plot showing differential FOXA1 binding ± A-FOS. Reduced (loss) and enhanced (gain) FOXA1 peaks in +A-FOS are highlighted. f) Overlap of loss / unchanged / gain FOXA1 peaks with AP-1. The upper panel shows the fraction that overlapped with FosL2 peaks, and the lower panel shows the fraction that contains AP-1 motifs. g) Distribution of the two orientations of FOXA1 / AP-1 motifs in loss / unchanged / gain peaks. Orange arrow: FOXA1 motif, blue pentagon: AP-1 (palindromic). h) Distribution enrichment of FOXA1 / AP-1 motif distances in loss peaks separated by the two orientations. Enrichment was calculated based on the histogram in Extended Data Fig. 5e using right-tailed two-proportion Z-test. i) The distributions of the maximum FOXA1 motif score per peak for loss / unchanged / gain FOXA1 peaks. j) Fold changes of the RNA-seq counts with A-FOS overexpression for the proximal genes near loss / unchanged / gain FOXA1 peaks. k) Top 10 enriched Gene Ontology (GO) terms of the proximal genes near the loss FOXA1 peaks.
Fig 5:
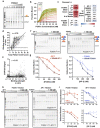
Fig 5:. In vitro study of FOXA1 binding and cooperativity with AP-1.
a) A representative EMSA-seq gel conducted on the ISO library with increasing levels of purified recombinant mouse FOXA1. The lower asterisk represents unbound oligonucleotides, and the upper asterisk indicates FOXA1-bound oligonucleotides. L: 100bp DNA ladder. b) FOXA1 bound fraction as a function of FOXA1 concentration measured by EMSA-seq. Data for a subset of the library, CCND1e variants, is plotted here. Green, yellow, orange, and red curves correspond to CCND1 variants with three, two, one, and zero FOXA1 motifs. The dotted line marks the fraction bound at 15 nM FOXA1, which is used to represent “binding strength in vitro” in c-e. c) Pearson correlation coefficient between FOXA1 binding strength in vitro and CCND1 sequence variables. d) Correlation between the binding strength in vitro and total (summed) FOXA1 motif score for each sequence. e) Correlation between the binding strength in vivo (measured by ChIP-ISO) and that in vitro (EMSA-seq). f) Representative EMSA gels with FOXA1 titration ± AP-1 (left) or AP-1 titration ± FOXA1 (right) using a CCND1 variant with the first two FOXA1 motifs mutated (FOXA112_mut). Different populations are labeled on the right side of the gel (FOXA1 = orange, AP-1 = blue). g) Quantification of the EMSA gel in panel f. Error bar represents standard error for three replicates. h & i) Same as f & g but using different DNA templates and with two replicates performed on each template. Top: CCND1 variant with all three FOXA1 motifs mutated (FOXA1all_mut). Bottom: CCND1 variant with the first two FOXA1 motif and AP-1 motif mutated (FOXA112_mut, AP-1mut).
Fig 6:
Fig 6:. FOXA1 binding is mostly determined by the local sequence, not the chromatin context.
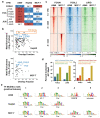
a) ChIP-ISO test cases where strong / weak FOXA1 motifs show low / high FOXA1 binding (set 1 and 2, respectively). Left: FOXA1 motif scores. Right: heatmap of FOXA1 ChIP-seq signals in WT A549. b) Heatmap of FOXA1 ChIP-ISO signals (left) and EMSA-seq signals (fraction bound at 15 nM FOXA1, right) for sequences in panel a. c) Heatmap of FOSL2, JUN, and CEBPB ChIP-seq signals in WT A549 (left) and number of FOXA1, FOSL2, and CEBPB motifs for sequences in panel a. d) Heatmap of FOXA1, H3K9me3, H3K27me3, FOSL2, and Jun ChIP-seq signals in WT A549 for a set of ChIP-ISO library sequences derived from H3K9me3-marked regions (top) and a control set with comparable FOXA1 binding derived from euchromatic loci (bottom). e) Violin plot of H3K9me3 ChIP-seq signals for sequences in panel d at their native genomic loci (left) and ChIP-ISO signals of the same sequences at AAVS1 (right). f) Same as panel e, but for FOXA1. g) Correlation between FOXA1 ChIP-ISO and ChIP-seq signals for all sequences derived from the native genome in our library. Orange: sequences from euchromatin, blue: H3K9me3-marked heterochromatin, green: H3K27me3-marked heterochromatin. h) Precision recall curves showing performance of neural networks trained on FOXA1 ChIP-seq data in A549 cells. Each plot shows performance of a CNN trained using only sequence (blue lines); Bichrom trained using sequence and H3K9me3 (orange lines); Bichrom trained using sequence and ATAC-seq (green lines); and Bichrom trained using sequence and a selection of five histone marks (red lines). The left plot shows the performance of the neural networks across all held-out test sites, while the right plot shows performance at FOXA1 motif instances that overlap H3K9me3 or H3K27me3 peaks. i) Schematic of CRISPRi method where KRAB-dCas9 is induced by doxycycline to ectopically write H3K9me3 to the endogenous CCND1e in A549 cells. This system is used to measure the effect of H3K9me3 deposition on FOXA1 binding. j) H3K9me3 (left) and FOXA1 (right) ChIP-qPCR signals on three biological replicates at a positive control region (P), CCND1e (C1 and C2), and a negative control region (N) with (orange) or without (beige) KRAB-dCas9 induction. ****: p < 0.0001 and ns: non-significant based on two-tailed unpaired t-test.
Fig 7:
Fig 7:. Cell-type-specific binding of FOXA1 correlates with differential expression of AP-1.
a) RNA-seq counts, reported in transcripts per million (TPM), for FOXA1 and various AP-1 subunits in WT A549, HepG2, and MCF-7 cell lines. Red and blue mark the highest and lowest expression for each gene. b) Bioinformatic analysis of FOXA1 / TF co-binding in HepG2 (top) and MCF-7 (bottom). For each TF, the dot plot shows the percentage of the overlapped FOXA1 ChIP-seq peaks (x axis) and the enrichment of its motif within FOXA1 peaks (y axis). AP-1 subunits are indicated in blue. c) Differential FOXA1 binding analysis in A549 and MCF-7 cells, with heatmaps showing common (upper), A549-specific (middle), and MCF-7-specific (bottom) peaks. FOSL2 and JUND ChIP-seq signals over the same regions are shown on the right. d) Occurrence probability of FOSL2 or JUND motif in common or differential FOXA1 peaks. Left: A549 vs MCF-7; Right: A549 vs HepG2. e) Top ranking motifs detected by TF-MoDISco in the genome-wide DeepLIFT-Shap positive feature attribution scores at sites predicted by a sequence-trained CNN to be bound by FOXA1 in A549, HepG2, and MCF-7 cells. The top five ranking motifs are shown unless TF-MoDISco returned fewer than five motifs. The TF family of best-matching motifs is annotated for each motif.

Similar articles

References

    1. Wang J. et al. Sequence features and chromatin structure around the genomic regions bound by 119 human transcription factors. Genome Res 22, 1798–812 (2012). - PMC - PubMed
    1. Arvey A., Agius P., Noble W.S. & Leslie C. Sequence and chromatin determinants of cell-type-specific transcription factor binding. Genome Res 22, 1723–34 (2012). - PMC - PubMed
    1. Spitz F. & Furlong E.E. Transcription factors: from enhancer binding to developmental control. Nat Rev Genet 13, 613–26 (2012). - PubMed
    1. Gordan R. et al. Genomic regions flanking E-box binding sites influence DNA binding specificity of bHLH transcription factors through DNA shape. Cell Rep 3, 1093–104 (2013). - PMC - PubMed
    1. Abe N. et al. Deconvolving the recognition of DNA shape from sequence. Cell 161, 307–18 (2015). - PMC - PubMed

Publication types