Multicenter Study
. 2023 Dec;29(12):3033-3043.
doi: 10.1038/s41591-023-02640-w. Epub 2023 Nov 20.

Large-scale pancreatic cancer detection via non-contrast CT and deep learning

Affiliations
Multicenter Study

Large-scale pancreatic cancer detection via non-contrast CT and deep learning

Kai Cao et al. Nat Med. 2023 Dec.

Abstract

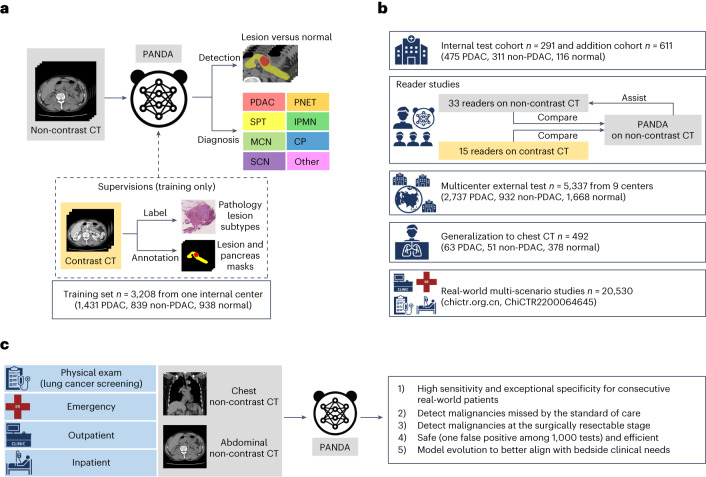
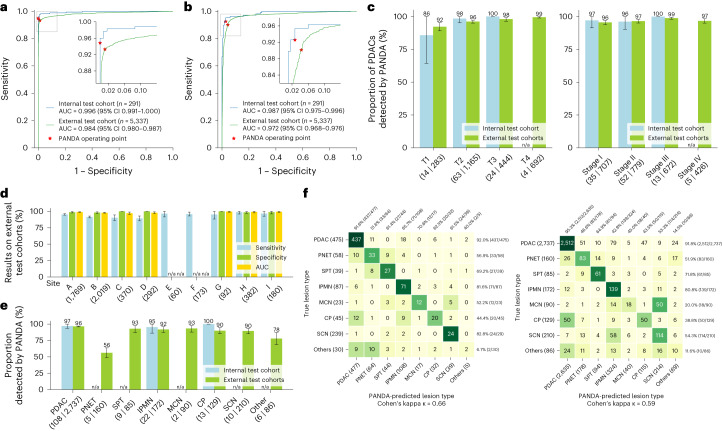
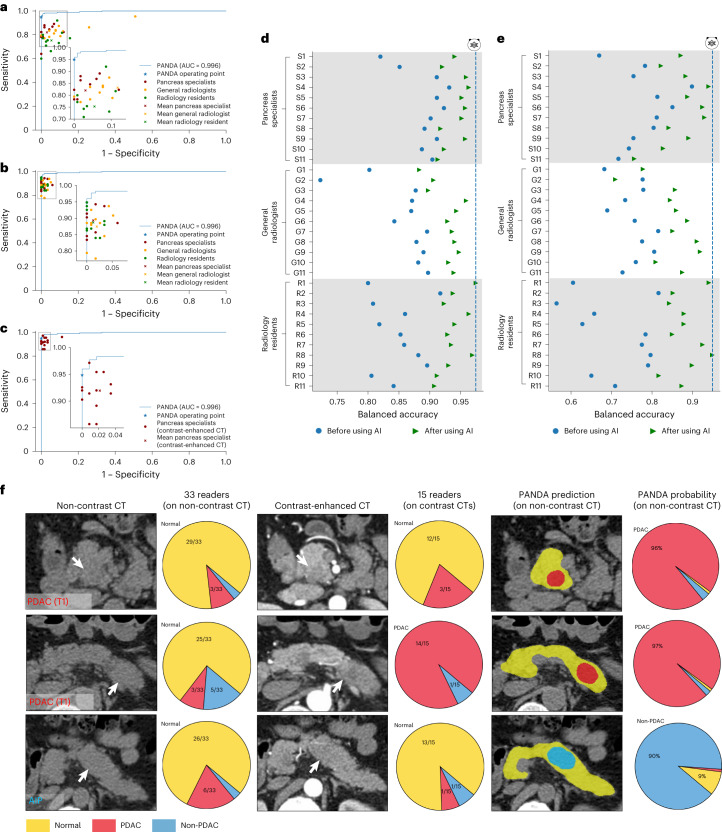
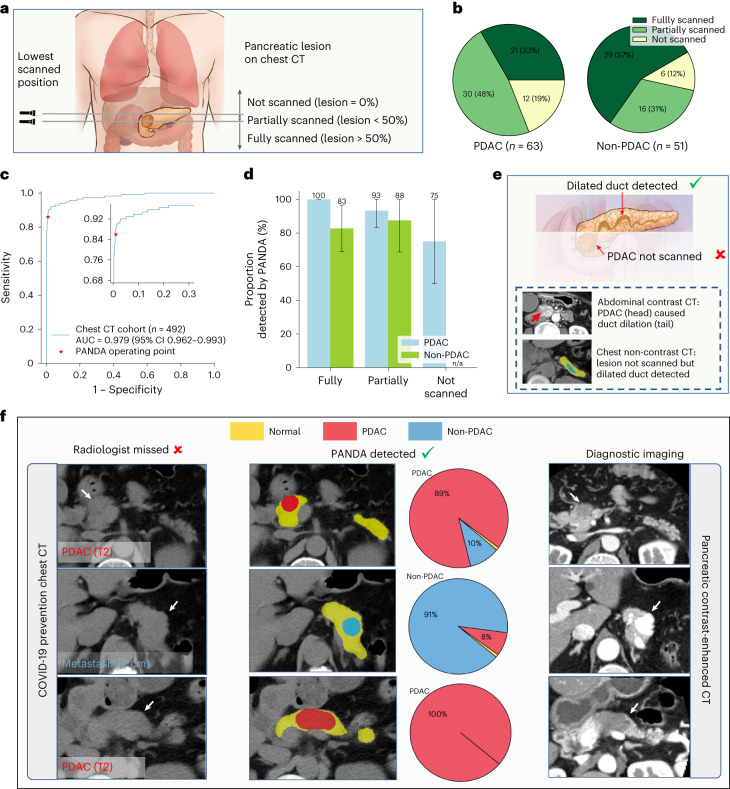
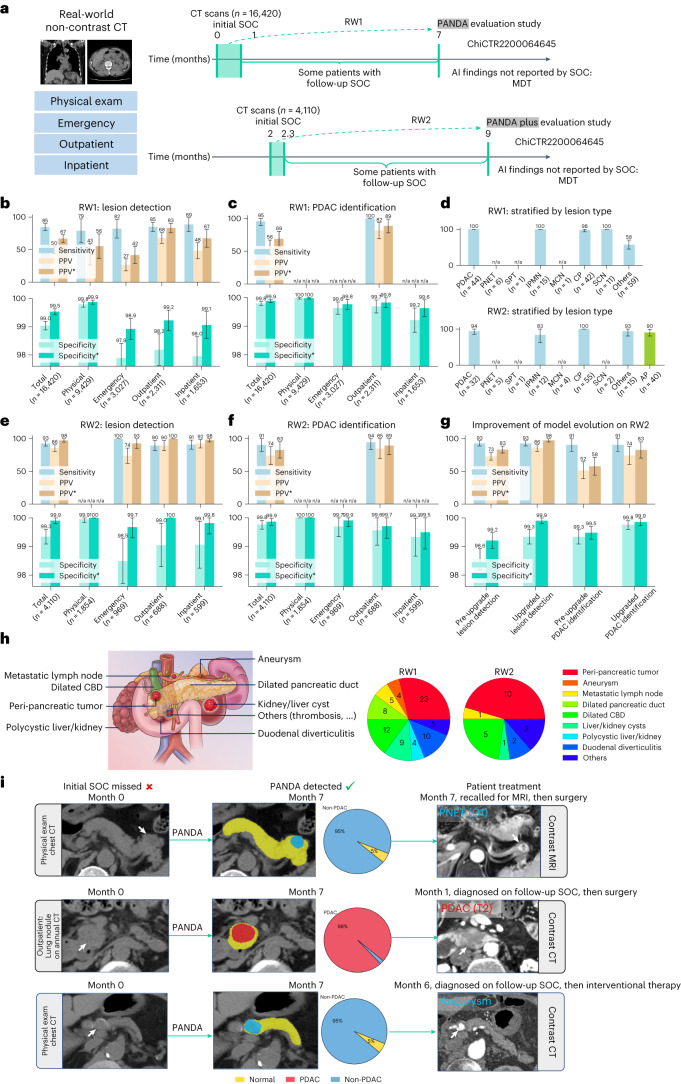
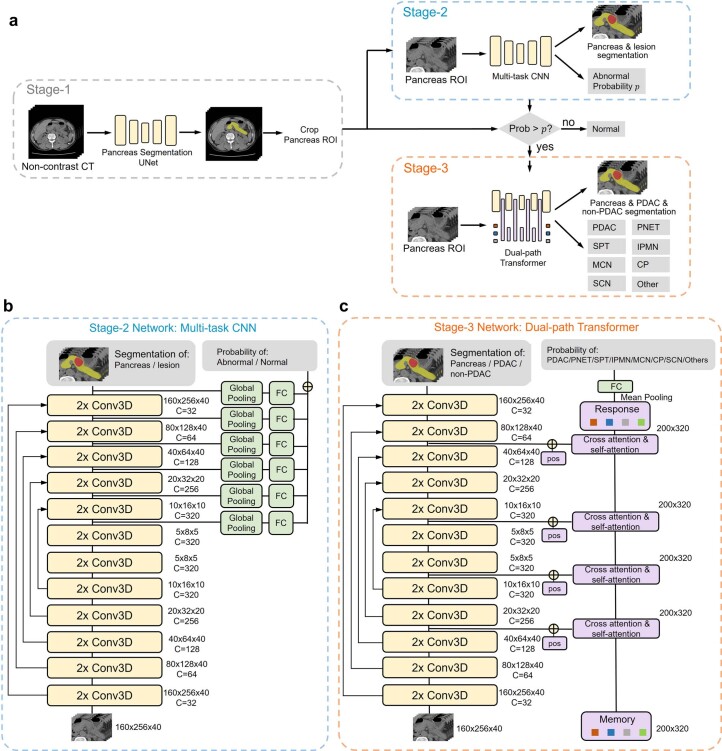
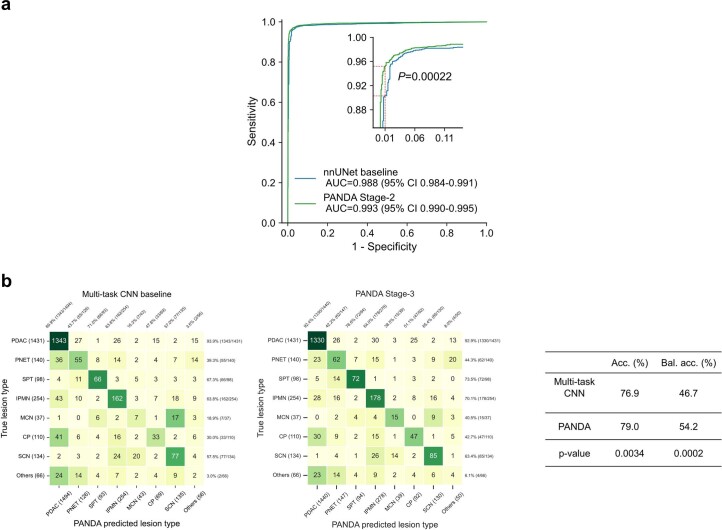
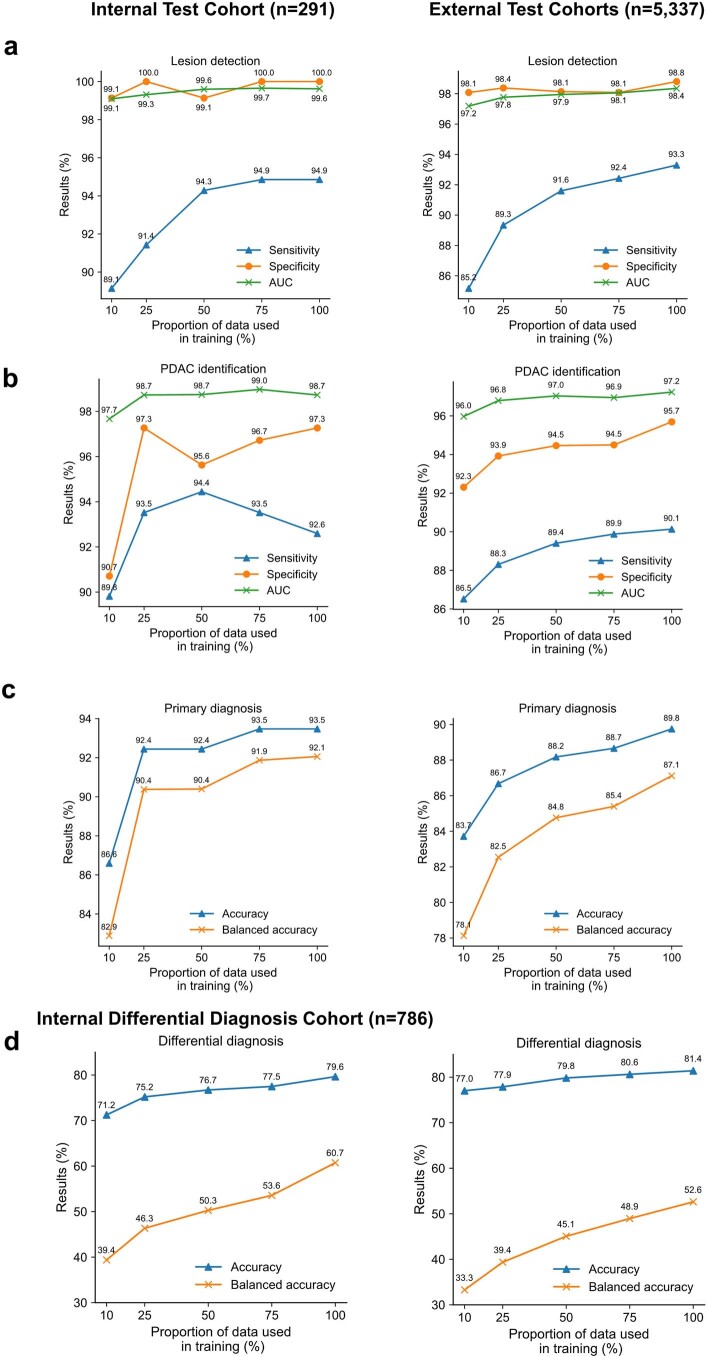
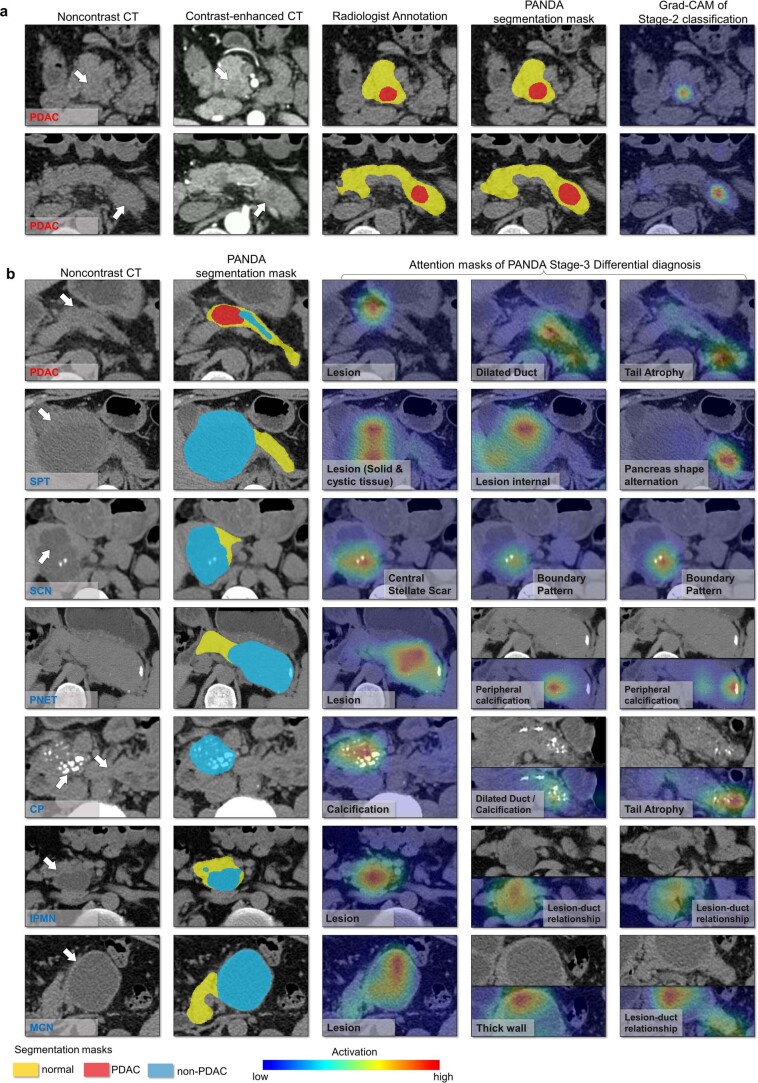
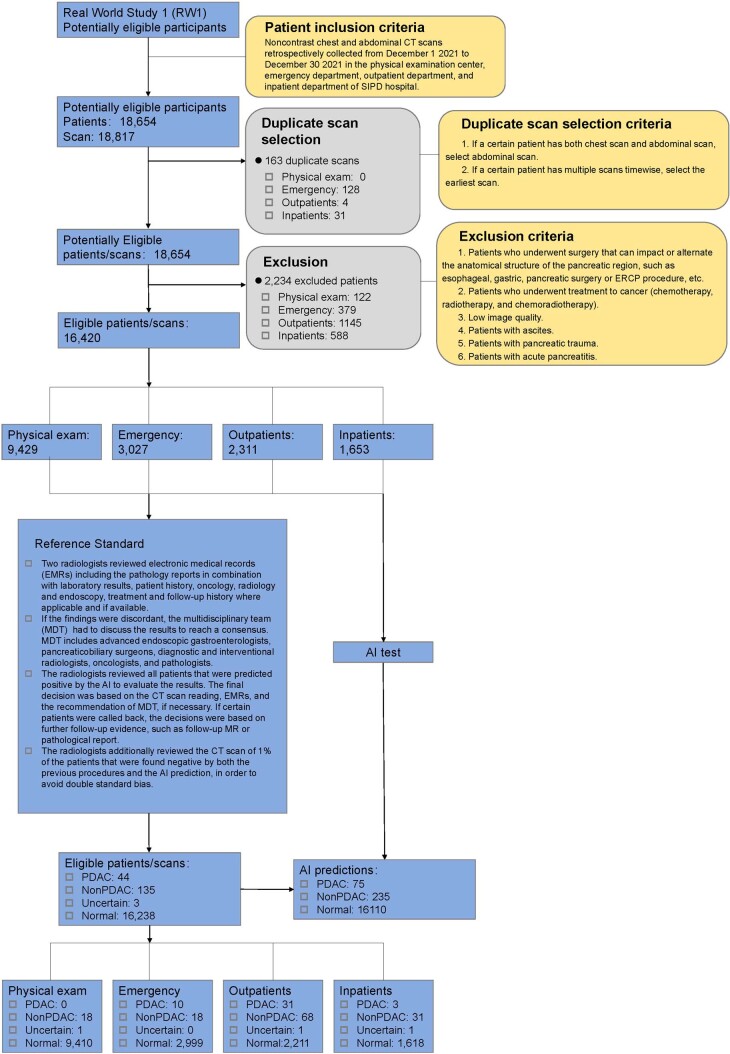
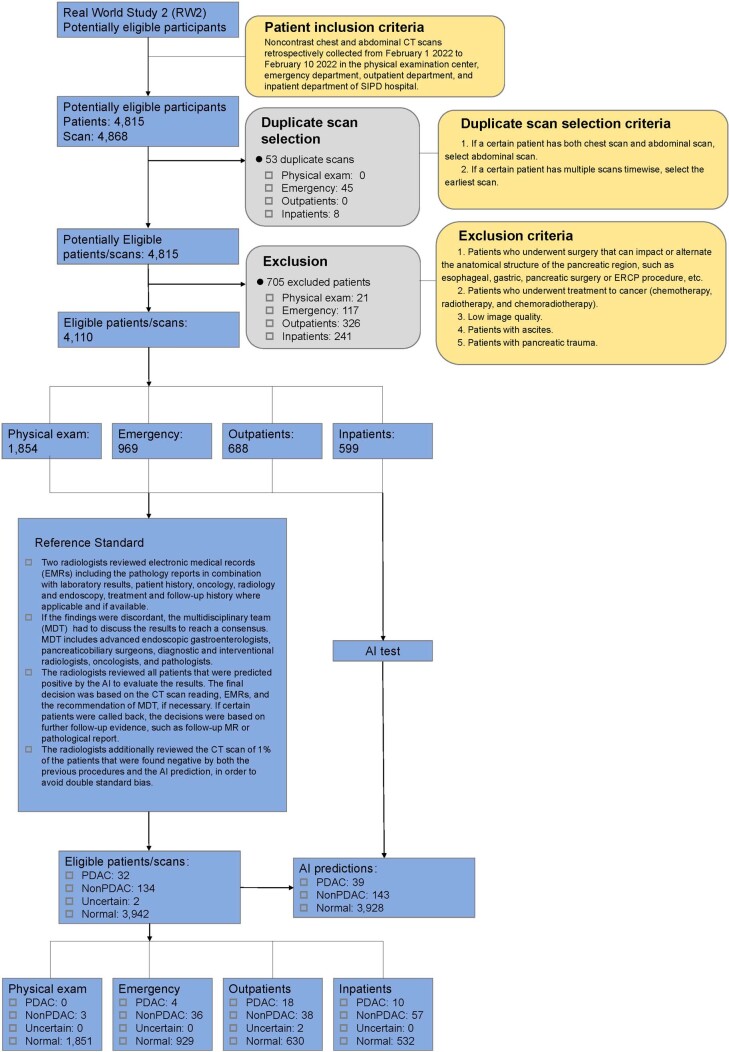
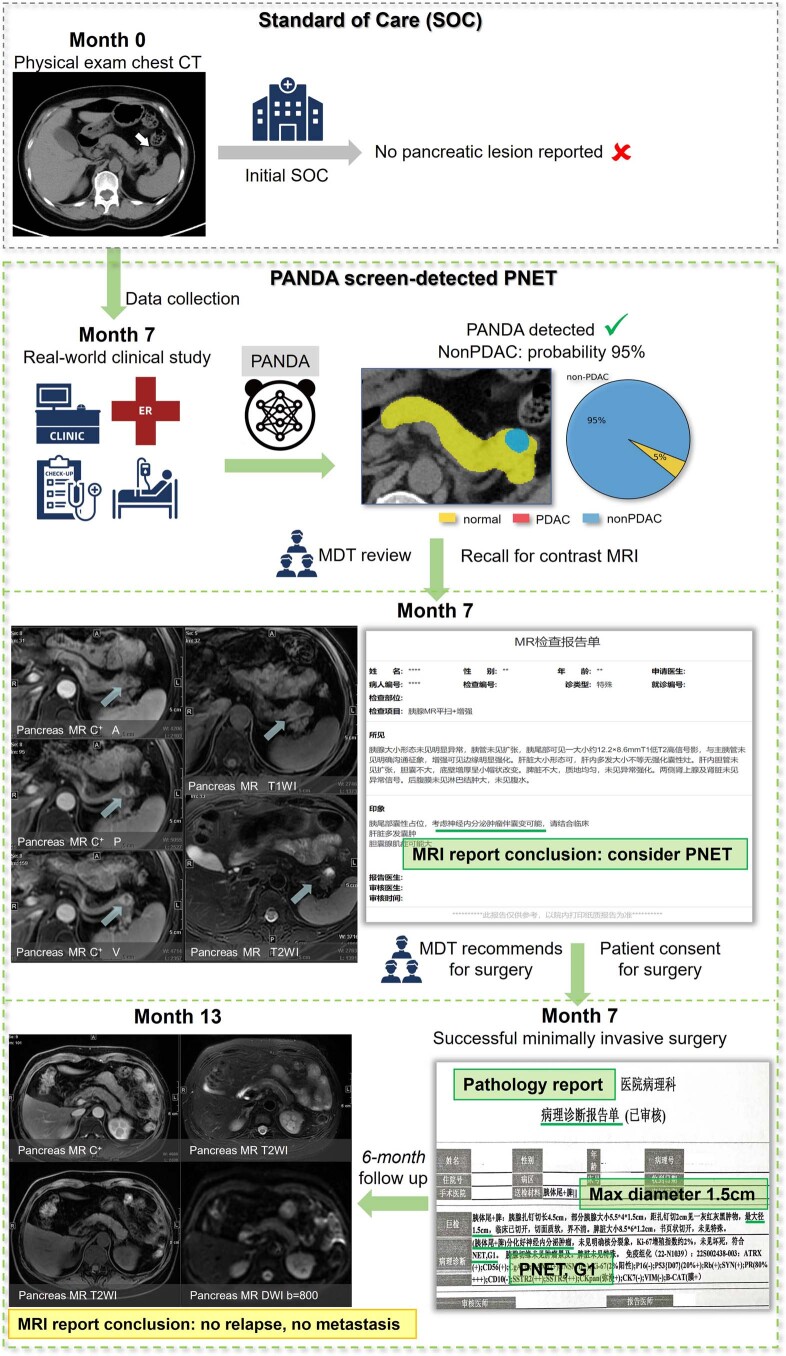
Pancreatic ductal adenocarcinoma (PDAC), the most deadly solid malignancy, is typically detected late and at an inoperable stage. Early or incidental detection is associated with prolonged survival, but screening asymptomatic individuals for PDAC using a single test remains unfeasible due to the low prevalence and potential harms of false positives. Non-contrast computed tomography (CT), routinely performed for clinical indications, offers the potential for large-scale screening, however, identification of PDAC using non-contrast CT has long been considered impossible. Here, we develop a deep learning approach, pancreatic cancer detection with artificial intelligence (PANDA), that can detect and classify pancreatic lesions with high accuracy via non-contrast CT. PANDA is trained on a dataset of 3,208 patients from a single center. PANDA achieves an area under the receiver operating characteristic curve (AUC) of 0.986-0.996 for lesion detection in a multicenter validation involving 6,239 patients across 10 centers, outperforms the mean radiologist performance by 34.1% in sensitivity and 6.3% in specificity for PDAC identification, and achieves a sensitivity of 92.9% and specificity of 99.9% for lesion detection in a real-world multi-scenario validation consisting of 20,530 consecutive patients. Notably, PANDA utilized with non-contrast CT shows non-inferiority to radiology reports (using contrast-enhanced CT) in the differentiation of common pancreatic lesion subtypes. PANDA could potentially serve as a new tool for large-scale pancreatic cancer screening.


Conflict of interest statement

Alibaba group has filed for patent protection (application numbers: CN 202210575258.9, US 18046405) on behalf of Y.X., L.Z., J.Y., L. Lu and X. Hua for the work related to the methods of detection of pancreatic cancer in non-contrast CT. Y.X., J.Y., W.G., Y.W., W.F., M.Q., L. Lu and L.Z. are employees of Alibaba Group and own Alibaba stock as part of the standard compensation package. All other authors have no competing interests.

Figures

Fig. 1
Fig. 1. Overview of PANDA’s development, evaluation and clinical translation.
a, Model development. PANDA takes non-contrast CT as input and outputs the probability and the segmentation mask of possible pancreatic lesions, including PDAC and seven non-PDAC subtypes; PANDA was trained with pathology-confirmed patient-level labels and lesion masks annotated on contrast CT images. CP, chronic pancreatitis. b, Model evaluation. We evaluate the performance of PANDA on the internal test cohort, two reader studies (on non-contrast and contrast CT, respectively), external test cohorts consisting of nine centers, a chest CT cohort, and real-world multi-scenario studies (the clinical trial includes two real-world studies; chictr.org.cn, ChiCTR2200064645). c, Model clinical translation. The real-world clinical evaluation answers five critical questions to close the clinical translational gap for PANDA.
Fig. 2
Fig. 2. Internal and external validation.
a,b Receiver operating characteristic curves of lesion detection (a) and PDAC identification (b) for the internal and external test cohorts. c, Proportion of PDACs detected by PANDA in terms of American Joint Committee on Cancer (AJCC) T stage (left) and TNM (tumor, nodes, metastasis) stage (right) in the internal test cohort (n = 105) and external test cohort (n = 2,584). d, Sensitivity, specificity and AUC of lesion detection in the external center cohorts (sites A–I, n = 5,337). e, Proportion of different lesion subtypes detected by PANDA in the internal test cohort (n = 175) and external test cohort (n = 3,669). f, Confusion matrices of differential diagnosis in the internal differential diagnosis cohort (left) and external test cohorts (right). ce, Error bars indicate 95% CI. The center shows the computed mean of the metric specified by its respective axis labels. The results of subgroups with too few samples to be studied reliably (≤10) are omitted and marked as not applicable (n/a).
Fig. 3
Fig. 3. Reader studies.
a, Comparison between PANDA and 33 readers with different levels of expertise on non-contrast CT for lesion detection. b, Lesion detection performance of the same set of readers with the assistance of PANDA on non-contrast CT. c, Comparison between PANDA using non-contrast CT and 15 pancreas specialists using contrast-enhanced CT for lesion detection. d,e, Balanced accuracy improvement in radiologists with different levels of expertise for lesion detection (d) and PDAC identification (e). f, Examples of early-stage PDACs and a case of autoimmune pancreatitis (AIP) missed by readers on non-contrast CT and on contrast CT but detected by PANDA.
Fig. 4
Fig. 4. Validation on chest non-contrast CT.
a, Schematic diagram of the proportion of the pancreatic lesion scanned in chest non-contrast CT. We categorize all cases into three categories, that is, lesion not scanned, lesion partially scanned, and lesion fully scanned, based on the relative position of the lowest scanned slice and the lesion. b, The proportion of the three categories in PDAC and non-PDAC cases. c, ROC curve for lesion detection on non-contrast chest CT. d, Proportion of lesions detected by PANDA in the PDAC (n = 63) and non-PDAC cases (n = 51). Error bars indicate 95% CI. The center shows the computed mean of the metric specified by the respective axis labels. The results of subgroups with too few samples to be studied reliably (≤10) are omitted and marked as ‘n/a’. e, Illustration of how PANDA can detect lesions that are not scanned in chest CT. Two scans of the same patient showing that PANDA can detect dilated pancreatic duct (usually caused by PDAC) even when the PDAC is not scanned. f, PANDA can detect early-stage PDACs and metastatic cancer that was initially misdetected by the radiologists on chest non-contrast CT (COVID-19 prevention CT).
Fig. 5
Fig. 5. Real-world clinical evaluation.
a, The data collection process of two real-world datasets, that is, RW1 and RW2, for the original PANDA model and the upgraded PANDA Plus model, respectively. SOC, standard of care. b,c,e,f, The sensitivity, specificity and PPV on RW1 (n = 16,420) and RW2 (n = 4,110). The superscript * represents adjusted results if we exclude cases of (peri-)pancreatic findings. d, Proportion of different lesion types detected in RW1 (n = 179) and RW2 (n = 166). g, The comparison between PANDA and PANDA Plus on RW2 (n = 4,110). Error bars indicate 95% CI. The center shows the computed mean of the metric specified by the respective axis labels. The results of subgroups with too few samples to be studied reliably (≤10) are omitted and marked as ‘n/a’. h, Examples of (peri-)pancreatic findings (left) and the number detected by PANDA (right). CBD, common bile duct. i, Examples of cases in which the lesion was missed by the initial SOC but was detected by PANDA.
Extended Data Fig. 1
Extended Data Fig. 1. Network architecture.
a, Overview. Our deep learning framework consists of three stages: pancreas localization using a segmentation UNet, abnormality detection using a multi-task CNN, and lesion subtype classification using a dual-path transformer. b, Architecture of the multi-task CNN for Stage-2. We extract multi-level features from the segmentation UNet, and concatenate the features after global pooling for abnormal and normal classification. c, Architecture of the dual-path transformer for Stage-3. Lesion-related features are encoded into the learnable memory vectors from the UNet features and the learnable positional embeddings using cross-attention and self-attention. The response vectors of this procedure are then used for the classification of PDAC and seven non-PDAC subtypes.
Extended Data Fig. 2
Extended Data Fig. 2. Ablation studies of the 5-fold cross-validation on the training set (n = 3,208).
a, nnUNet vs. PANDA Stage-2 network (multi-task CNN) for lesion detection, where PANDA achieved significant improvement in AUC score (P = 0.00022). At the same (desired) specificity level of 99.0%, PANDA Stage-2 outperformed nnUNet in sensitivity by 4.9% (95.2% vs. 90.3%) (marked in red dotted line). b, Multi-task CNN baseline (same as PANDA Stage-2 network with nnUNet backbone and classification head) vs. PANDA Stage-3 (dual-path transformer) for differential diagnosis, where PANDA achieved significant improvement in both accuracy (Acc.) and balanced accuracy (Bal. acc.). The significance test comparing the AUCs of the AI model and nnUNet is conducted using the Delong test. Two-sided permutation tests were used to compute the statistical differences of accuracy and balanced accuracy.
Extended Data Fig. 3
Extended Data Fig. 3. Influence of the proportion of training data.
Influence of the proportion of training data tested on the internal test cohort (left) and the external test cohorts (right) on the task of a, lesion detection b, PDAC identification c, primary diagnosis d, differential diagnosis.
Extended Data Fig. 4
Extended Data Fig. 4. Analysis of interpretability.
a, we visualize the noncontrast CT, contrast-enhanced CT, and the radiologist’s annotated mask and compare them with the PANDA segmentation map and the Grad-CAM heatmap of PANDA Stage-2 classification for lesion detection. PANDA correctly predicted the position of the PDAC (PANDA segmentation map) and made positive classification based on the local features of the PDAC (Grad-CAM heatmap). b, we visualize the top activated attention maps of the Transformer branch of PANDA Stage-3 to interpret how PANDA classified the lesions. The memory tokens of the Transformer not only attended to the lesion locations but also considered the secondary signs for lesion diagnosis as utilized by the radiologists. E.g. A PDAC caused pancreatic duct dilation and pancreatic atrophy; A SPT was circumscribed with the heterogeneity of both solid and cystic regions; A SCN had a pattern of central stellate scar and so-called honeycomb pattern; A PNET had isoattenuating mass and peripheral calcification; A CP was associated with calcification, dilated duct, and pancreatic atrophy; An IPMN lesion was connected to the pancreatic duct; A MCN had the thick cystic wall and no visual connection with the pancreatic duct. The heatmaps of multiple slices were displayed for the CP, IPMN, and MCN.
Extended Data Fig. 5
Overview of the workflow of the first real-world study (RW1).
Extended Data Fig. 6
Overview of the workflow of the second real-world study (RW2).
Extended Data Fig. 7
Extended Data Fig. 7. Flowchart describing the successful discovery and intervention of a patient with pancreatic neuroendocrine tumors (PNET) in the real-world clinical evaluation.
Noncontrast chest CT was performed on this patient in the physical examination center in Month 0, where the standard of care did not report any pancreatic findings. This patient was included in the real-world study in Month 7 and was reported as non-PDAC (95% probability) by PANDA. After the case was reviewed by MDT, the patient was recalled for contrast-enhanced MRI and was considered as PNET in the radiology report. The patient consented to surgery, which was later successfully performed in Month 7. The post-surgical pathology report confirmed an early-stage PNET (G1, 1.5cm). The 6 month follow-up (Month 13) showed no relapse or metastasis. The English translation of the MRI and pathology reports’ key results are provided in green boxes.

Similar articles

Cited by

References

    1. Sung H, et al. Global cancer statistics 2020: GLOBOCAN estimates of incidence and mortality worldwide for 36 cancers in 185 countries. CA Cancer J. Clin. 2021;71:209–249. - PubMed
    1. Vasen H, et al. Benefit of surveillance for pancreatic cancer in high-risk individuals: outcome of long-term prospective follow-up studies from three European expert centers. J. Clin. Oncol. 2016;34:2010–2019. - PubMed
    1. Singhi AD, Koay EJ, Chari ST, Maitra A. Early detection of pancreatic cancer: opportunities and challenges. Gastroenterology. 2019;156:2024–2040. - PMC - PubMed
    1. Pereira SP, et al. Early detection of pancreatic cancer. Lancet Gastroenterol. Hepatol. 2020;5:698–710. - PMC - PubMed
    1. Klatte DCF, et al. Pancreatic cancer surveillance in carriers of a germline CDKN2A pathogenic variant: yield and outcomes of a 20-year prospective follow-up. J. Clin. Oncol. 2022;40:3267–3277. - PubMed

Publication types

MeSH terms