. 2023 Nov 17;15(22):12817-12851.
doi: 10.18632/aging.205173. Epub 2023 Nov 17.

Prognostic hub gene CBX2 drives a cancer stem cell-like phenotype in HCC revealed by multi-omics and multi-cohorts

Affiliations

Prognostic hub gene CBX2 drives a cancer stem cell-like phenotype in HCC revealed by multi-omics and multi-cohorts

Qingren Meng et al. Aging (Albany NY). .

Abstract

Hepatocellular carcinoma (HCC) is a malignant tumor with a high prevalence and fatality rate. CBX2 has been demonstrated to impact the development and advancement of various cancers, albeit it has received limited attention in relation to HCC. In this study, CBX2 and CEP55 were screened out with the refined triple regulatory networks constructed by total RNA-seq datasets (TCGA-LIHC, GSE140845) and a robust prognostic model. Aberrantly higher expression levels of CBX2 and CEP55 in HCC may be caused by CNV alterations, promoter hypo-methylation, open chromatin accessibility, and greater active marks such as H3K4me3, H3K4me1, and H3K27ac. Functionally, CBX2, which was highly correlated with CD44, shaped a cancer stem cell-like phenotype by positively regulating cell-cycle progression, proliferation, invasion, metastasis, wound healing, and radiation resistance, revealed by combining bulk RNA-seq and scRNA-seq datasets. CBX2 knockdown validated its role in affecting the cell cycle. Importantly, we revealed CBX2 could activate gene by cooperating with co-regulators or not rather than a recognizer of the repressive mark H3K27me3. For instance, we uncovered CBX2 bound to promoter of CTNNB1 and CEP55 to augment their expressions. CBX2 showed a highly positive correlation with CEP55 at pan-cancer level. In addition, CBX2 and CEP55 may enhance extracellular matrix reprograming via cancer-associated fibroblast. Surprisingly, patients with high expression of CBX2 or CEP55 exhibited a higher response to immunotherapy, indicating that CBX2 and CEP55 may be promising therapeutic targets for HCC patients.

Keywords: CBX2; CEP55; HCC; cell cycle; regulatory network.


Conflict of interest statement

CONFLICTS OF INTEREST: The authors declare no conflicts of interest related to this study.

Figures

Figure 1
Figure 1
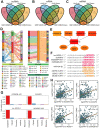
Identification and validation of refined hubs in triple regulatory networks. (AC) The overlapping differential expressed genes including lncRNAs (A), miRNAs (B) and mRNAs (C) identified by DESeq2 (FDR:0.01, log2FC:1) with TCGA-LIHC and GSE140845. (D) The Sankey plot indicates the triple regulatory network based on the strategies. The thickness of lines do not make sense. (E) Strategy-one hub of refined triple regulatory networks determined by a Cytoscape plug-in CytoHubba. (F) The base pairing diagram of binding sites for the strategy-one triple regulatory network predicted by miRanda. (G) The predicted cellular localization for 4 lncRNAs in the strategy-one hub using lncLocator. (H) The Pearson’s correlation between CBX2 and 4 lncRNAs in the strategy-one hub.
Figure 2
Figure 2
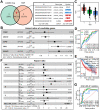
Establishment and refinement of DUXAP8/CBX2/CEP55-centered prognostic model. (A) Shared model candidate survival-related RNAs from which was selected with Lasso Cox and RSF from the refined regulatory networks. (B) Forest plots of multivariate Cox showed the hazard ratio (HR), 95% confidence interval (CI), and corresponding P-values of model-used CPEB3, ANXA10, CEP55, CBX2, and DUXAP8 (C) Time-dependent AUC within 5 years of a prognostic model related to 5-survival genes using two-fold cross validation with 50 randomly repeated replications. (D) The examples of time-dependent ROC at 1-, 3-, and 5-year corresponding to the AUC in (C). (E) Kaplan-Meier plots of the risk score predicted with the prognostic model in TCGA-LIHC. The high and low risk group was determined with the median of risk score. P value was calculated by log-rank test. (F) Forest plots of multivariate Cox showed HR and p value of TNM, age, gender and risk score. (G) Time dependent ROC and AUC at 1-, 3-, and 5-year predicted with external validation using ICGC-LIRI-JP by 5-survival-gene prognostic model. RSF, Random Survival Forest; AUC, area under the curve; ROC, receiver operating characteristic curve; HR, hazard ratio.
Figure 3
Figure 3
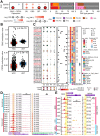
Genomic and epigenomic alternations enhanced CBX2 and CEP55 expressions. (A) From left to right, the figures were the Spearman’s correlation of CNV and the corresponding expression, the impact of CNV on patients’ survival time, and the percent of CBX2 and CEP55 CNV type detailly and broadly. KM P indicated the P-value computed with log-rank test. (B) Methylation level of CBX2 and CEP55 in HCC and adjacent tissues. P-value was performed using Wilcox rank sum test. (C) From left to right, the figures were the effects of methylation sites on CBX2 and CEP55 on patients’ survival, the mean methylation level of CBX2 and CEP55 in HCC and adjacent tissues, and the Spearman’s correlation between methylation level of methylation sites and expression level. The P-value reflecting differential methylation sites was derived from the Wilcox rank sum test. KM P indicated the P-value computed with log-rank test and the median of methylation level or expression level was utilized to classify the high and low group. (D) Chromatin accessibility signals on CBX2 and CEP55 in normal livers and HCC. (E) H3K4me3 signals on CBX2 and CEP55 in normal livers and HCC. HR, hazard ratio. *, P ≤ 0.05; **, P ≤ 0.01; ***, P ≤ 0.001; OS, Overall Survival; DSS, Disease Specific Survival; DFI, Disease Free Interval; PFI, Progression Free Interval.
Figure 4
Figure 4
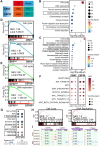
CBX2 and CEP55 affected the cell cycle. (A) Summary of differential expressed genes identified using DESeq2 in CBX2-stratified and CEP55-stratified tumors. The genes in Up indicated the higher expression in CBX2high or CEP55high tumors whereas conversely for those in Down. (B, C) Enriched KEGG in 1887 CBX2-related up-regulated genes (B) and 2866 CEP55-related up-regulated genes (C) in stratified tumors. (D, E) GSEA analysis of CBX2-related (D) and CEP55-related (E) KEGG pathway. (F) GSEA analysis of CBX2-related and CEP55-related cancer hallmarks. (G) The Spearman’s correlation between pathway activity score and CBX2/CEP55 expression. (H) GSEA analysis of CBX2 knockdown -related KEGG pathways. (I) RNA and ATAC tracks of cell cycle-related genes in shCBX2 and WT group.
Figure 5
Figure 5
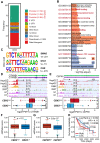
CBX2 regulated CEP55 and CTNNB1 directly. (A) Summary of genomic distribution of CBX2 peaks. (B) Enriched GO terms in genes associated with gene promoter CBX2 peaks. (C) DNA motifs enriched within genes associated with gene promoter CBX2 peaks determined by HOMER motif analysis. (D, E) Tracks of CBX2 peaks on CEP55 (D) loci and CTNNB1 (E) loci and the corresponding expression between CBX2-statified tumors. Statistical significance was calculated using the two-sided Wilcoxon test. (F, G) mRNAsi distribution between CBX2-stratified (F) and CEP55-stratified (G) tumors. Statistical significance was calculated using the two-sided Wilcoxon test. (H) Kaplan-Meier plots of mRNAsi. The high and low group was classified with the median of risk score. P-value was computed with log-rank test.
Figure 6
Figure 6
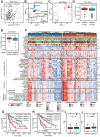
CBX2 shaped diverse functional states and enhanced immunotherapy response. (A) The Pearson correlation between CBX2 and CD44 in TCGA-LICH dataset. (B, C) UMAP showing the cell clusters (B) and distribution of CBX2 (C) in GSE125449. (D, E) Distribution of CytoTRACE score between CBX2-positive and –negative malignant cells from GSE125449 (D) and GSE166635 (E). P-value was calculated using the two-sided Wilcoxon test. (F) Heatmap representation of the main functional states, immunotherapy response predictors, representative molecular and immune characteristics in CBX2high tumors and CBX2low tumors. (G, H) Kaplan-Meier plots of CBX2 combined with PDCD1 (G) and CD274 (H). P-value was computed with log-rank test. (I, J) Distribution of predicted TIDE score between CBX2-stratified (I) and CEP55-stratified (J) tumors. P-value was calculated using the two-sided Wilcoxon test.
Figure 7
Figure 7
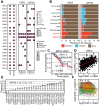
Aberrantly expressed CBX2 and CEP55 as drug targets as pan-cancer level. (A) Summary of CBX2 and CEP55 expression pattern differences and their impact on tumor patient survival time (OS, DSS, DFI, PFI) across 21 cancers. Prognosis was inferred with hazard ratio, “risky” indicated HR > 1 whereas “protective” suggested HR < 1 (B) Summary of pathway activation or inhibition by CBX2 and CEP55 across 33 cancers. “Activation” represented significantly positive Spearman’s correlation conversely “Inhibition” indicated the significantly negative. (C) Kaplan-Meier plots of CBX2 expression in BRCA. High and Low groups were determined by the CBX2 expression cutoff computed by surv_cutpoint function in survminer package. P-value was computed with log-rank test. (D) Pearson’s correlation between the expression of CBX2 and CEP55 in BRCA, an example of pan-cancer. (E) Pearson’s correlation between the expression of CBX2 and CDKN1A with all tumors. OS, Overall Survival; DSS, Disease Specific Survival; DFI, Disease Free Interval; PFI, Progression Free Interval. (F) Pearson’s correlation of CBX2 and CDKN1A expression level in pan-cancer.

Similar articles

Cited by

References

    1. Llovet JM, Pinyol R, Kelley RK, El-Khoueiry A, Reeves HL, Wang XW, Gores GJ, Villanueva A. Molecular pathogenesis and systemic therapies for hepatocellular carcinoma. Nat Cancer. 2022; 3:386–401. 10.1038/s43018-022-00357-2 - DOI - PMC - PubMed
    1. Llovet JM, Kelley RK, Villanueva A, Singal AG, Pikarsky E, Roayaie S, Lencioni R, Koike K, Zucman-Rossi J, Finn RS. Hepatocellular carcinoma. Nat Rev Dis Primers. 2021; 7:6. 10.1038/s41572-020-00240-3 - DOI - PubMed
    1. Llovet JM, Castet F, Heikenwalder M, Maini MK, Mazzaferro V, Pinato DJ, Pikarsky E, Zhu AX, Finn RS. Immunotherapies for hepatocellular carcinoma. Nat Rev Clin Oncol. 2022; 19:151–72. 10.1038/s41571-021-00573-2 - DOI - PubMed
    1. Peng WX, Koirala P, Mo YY. LncRNA-mediated regulation of cell signaling in cancer. Oncogene. 2017; 36:5661–7. 10.1038/onc.2017.184 - DOI - PMC - PubMed
    1. Dragomir MP, Knutsen E, Calin GA. Classical and noncanonical functions of miRNAs in cancers. Trends Genet. 2022; 38:379–94. 10.1016/j.tig.2021.10.002 - DOI - PubMed

Publication types

MeSH terms