Glutamine-rich regions of the disordered CREB transactivation domain mediate dynamic intra- and intermolecular interactions
- PMID: 37971402
- PMCID: PMC10666024
- DOI: 10.1073/pnas.2313835120
Glutamine-rich regions of the disordered CREB transactivation domain mediate dynamic intra- and intermolecular interactions
Abstract
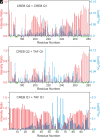
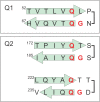
The cyclic AMP response element (CRE) binding protein (CREB) is a transcription factor that contains a 280-residue N-terminal transactivation domain and a basic leucine zipper that mediates interaction with DNA. The transactivation domain comprises three subdomains, the glutamine-rich domains Q1 and Q2 and the kinase inducible activation domain (KID). NMR chemical shifts show that the isolated subdomains are intrinsically disordered but have a propensity to populate local elements of secondary structure. The Q1 and Q2 domains exhibit a propensity for formation of short β-hairpin motifs that function as binding sites for glutamine-rich sequences. These motifs mediate intramolecular interactions between the CREB Q1 and Q2 domains as well as intermolecular interactions with the glutamine-rich Q1 domain of the TATA-box binding protein associated factor 4 (TAF4) subunit of transcription factor IID (TFIID). Using small-angle X-ray scattering, NMR, and single-molecule Förster resonance energy transfer, we show that the Q1, Q2, and KID regions remain dynamically disordered in a full-length CREB transactivation domain (CREBTAD) construct. The CREBTAD polypeptide chain is largely extended although some compaction is evident in the KID and Q2 domains. Paramagnetic relaxation enhancement reveals transient long-range contacts both within and between the Q1 and Q2 domains while the intervening KID domain is largely devoid of intramolecular interactions. Phosphorylation results in expansion of the KID domain, presumably making it more accessible for binding the CBP/p300 transcriptional coactivators. Our study reveals the complex nature of the interactions within the intrinsically disordered transactivation domain of CREB and provides molecular-level insights into dynamic and transient interactions mediated by the glutamine-rich domains.
Keywords: NMR; TFIID; intrinsically disordered protein; single-molecule FRET; transcriptional activation.
Conflict of interest statement
The authors declare no competing interest.
Figures


Similar articles
-
Distinct subdomains of human TAFII130 are required for interactions with glutamine-rich transcriptional activators.Mol Cell Biol. 1998 Oct;18(10):5734-43. doi: 10.1128/MCB.18.10.5734. Mol Cell Biol. 1998. PMID: 9742090 Free PMC article.
-
Chromatin-dependent cooperativity between constitutive and inducible activation domains in CREB.Mol Cell Biol. 2001 Dec;21(23):7892-900. doi: 10.1128/MCB.21.23.7892-7900.2001. Mol Cell Biol. 2001. PMID: 11689682 Free PMC article.
-
Synergistic activation of CREB-mediated transcription by forskolin and phorbol ester requires PKC and depends on the glutamine-rich Q2 transactivation domain.Cell Signal. 2004 Oct;16(10):1187-99. doi: 10.1016/j.cellsig.2004.03.009. Cell Signal. 2004. PMID: 15240013
-
What turns CREB on?Cell Signal. 2004 Nov;16(11):1211-27. doi: 10.1016/j.cellsig.2004.05.001. Cell Signal. 2004. PMID: 15337521 Review.
-
Mechanisms of basal and kinase-inducible transcription activation by CREB.Prog Nucleic Acid Res Mol Biol. 2002;72:269-305. doi: 10.1016/s0079-6603(02)72072-2. Prog Nucleic Acid Res Mol Biol. 2002. PMID: 12206454 Review.
Cited by
-
Structural and Functional Relevance of Charge Based Transient Interactions inside Intrinsically Disordered Proteins.bioRxiv [Preprint]. 2024 Nov 1:2024.10.30.621161. doi: 10.1101/2024.10.30.621161. bioRxiv. 2024. PMID: 39554085 Free PMC article. Preprint.
-
Multi-faceted regulation of CREB family transcription factors.Front Mol Neurosci. 2024 Aug 6;17:1408949. doi: 10.3389/fnmol.2024.1408949. eCollection 2024. Front Mol Neurosci. 2024. PMID: 39165717 Free PMC article. Review.
References
-
- Minezaki Y., Homma K., Kinjo A. R., Nishikawa K., Human transcription factors contain a high fraction of intrinsically disordered regions essential for transcriptional regulation. J. Mol. Biol. 359, 1137–1149 (2006). - PubMed
-
- Sigler P. B., Transcriptional activation. Acid blobs and negative noodles. Nature 333, 210–212 (1988). - PubMed
-
- Wright P. E., Dyson H. J., Intrinsically unstructured proteins: Re-assessing the protein structure-function paradigm. J. Mol. Biol. 293, 321–331 (1999). - PubMed
MeSH terms
Substances
Grants and funding
LinkOut - more resources
Full Text Sources
Research Materials
Miscellaneous

