. 2024 Aug 1;15(4):1969-1988.
doi: 10.14336/AD.2023.1006.

P2Y1R silencing in Astrocytes Protected Neuroinflammation and Cognitive Decline in a Mouse Model of Alzheimer's Disease

Affiliations

P2Y1R silencing in Astrocytes Protected Neuroinflammation and Cognitive Decline in a Mouse Model of Alzheimer's Disease

Shan Luo et al. Aging Dis. .

Abstract

Astrocytes, the major non-dividing glial cells in the central nervous system, exhibit hyperactivation in Alzheimer's disease (AD), leading to neuroinflammation and cognitive impairments. P2Y1-receptor (P2Y1R) in AD brain has been pointed out some contribution to AD pathogenesis, therefore, this study aims to elucidate how astrocytic P2Y1R affects the progression of AD and explore its potential as a new target for AD therapy. In this study, we performed the two-steps verification to assess P2Y1R inhibition in AD progression: P2Y1R-KO AD mice and AD mice treated with astrocyte-specific P2Y1R gene knockdown by using shRNAs for P2Y1R in adeno-associated virus vector. Histochemistry was conducted for the assessment of amyloid-beta accumulation, neuroinflammation and blood brain barrier function. Expression of inflammatory cytokines was evaluated by qPCR after the separation of astrocytes. Cognitive function was assessed through the Morris water maze, Y maze, and contextual fear conditioning tests. P2Y1R inhibition not only by gene knockout but also by astrocyte-specific knockdown reduced amyloid-beta accumulation, glial neuroinflammation, blood brain barrier dysfunction, and cognitive impairment in an AD mice model. Reduced neuroinflammation by astrocytic P2Y1R silencing in AD was further confirmed by the reduction of IL-6 gene expression after the separation of astrocytes from AD mouse brain, which may relate to the amelioration of blood brain barrier as well as cognitive functions. Our results clearly note that P2Y1R in astrocyte contributes to the progression of AD pathology through the acceleration of neuroinflammation, and one-time gene therapy for silencing astrocytic P2Y1R may offer a new therapeutic target for AD.


Conflict of interest statement

Conflict of Interest

The authors have no conflict of interest to report.

Figures
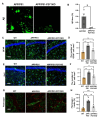
Figure 1.
Figure 1.
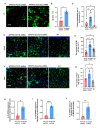
Knockout of the P2Y1 gene in AD mice reduced amyloid beta protein, inhibited glial activation, and decreased fibrinogen aggregation along the vessel. (A) Typical staining image of amyloid-beta plaques in APP/PS1 (n=4) and APP/PS1-P2Y1KO (n=4) mice (green: amyloid-beta (Aβ) deposits visualized by anti-Aβ immunostaining; scale bar=50 µm). (B) Averaged area percentage of amyloid-beta plaque deposits in immune-stained hippocampal slices. The content of amyloid-beta plaques in APP/PS1-P2Y1KO mice was significantly lower than that in APP/PS1 mice. (Mean ± SEM, *p<0.05, Unpaired t-test with Welch’s correction). (C) Typical stained image of activated astrocytes in APP/PS1 (n=3), WT (n=3), and APP/PS1-P2Y1R-KO (n=3) mice (green: astrocyte; blue: DAPI; scale bar=50 µm). (D) The number of fluorescent-positive (GFAP+) cells was significantly smaller in APP/PS1-P2Y1KO mice than in APP/PS1 mice and was equivalent between APP/PS1-P2Y1KO and WT mice. The microglia from the hippocampus in APP/PS1 (n=3), WT (n=3), and APP/PS1-P2Y1KO (n=3) mice labeled with Iba1 were compared. A classic stained image of APP/PS1, WT, and APP/PS1-P2Y1KO mice (green: microglia; blue: DAPI; scale bar=50 µm). (F) The results of immunohistochemical analysis of Iba1+ cells in APP/PS1-P2Y1KO, APP, and WT mice. (G) A typical staining image of fibrinogen and blood vessels. (Green: fibrinogen; red: vascular endothelial cells; scale bar=50 µm). (H) The proportion of fibrinogen area on vascular endothelial cells in APP/PS1 (n=4), APP/PS1-P2Y1KO (n=3), and WT (n=3) mice was analyzed. The percentage of fibrinogen area on vascular endothelial cells in APP/PS1 mice was significantly higher than that in APP/PS1-P2Y1KO mice. (Mean ± SEM, *p<0.05, **p<0.01, one-way ANOVA test, followed by Bonferroni’s multiple comparison test in D, F and H).
Figure 2.
Figure 2.
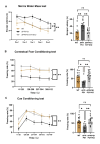
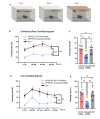
Results of Morris water maze test (A) and fear conditional tests (B-C) from APP/PS1-P2Y1R-KO, APP/PS1, and WT mice. (A) The 5-day acquisition test of APP/PS1-P2Y1KO (n=9), APP/PS1 (n=10), and WT mice (n=8) was measured by latency time to find a submerged platform under water. For the acquisition test, there were statistically significant differences between the APP/PS1 and APP/PS1-P2Y1KO mice. APP/PS1-P2Y1KO mice discovered the platform significantly quicker than APP/PS1 mice as well as wild type mice on day-4, statistically significant after a post-hoc test. (B) The freezing rate of the contextual test on the second day of the CFC test. (C) The freezing rate of the cued test on the third day of the CFC test. The results of both the contextual and cued tests between the APP/PS1-P2Y1KO (n=15) and APP/PS1 mice (n=8) approached statistical significance. However, there was no significant difference between the WT (n=12) and APP/PS1-P2Y1KO mice (n=15) in both the contextual and cued tests. (Mean ± SEM, *p < 0.05, **p < 0.01, Line graph: two-way ANOVA test, Bonferroni’s multiple comparison test; Bar graph: one-way ANOVA, Bonferroni’s multiple comparison test).
Figure 3.
Figure 3.
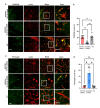
P2Y1R expression in primary cultured astrocytes treated with P2Y1R-shRNA AAV-vector was measured using immunofluorescence, western blotting, and qPCR. (A) AAV vector MAP used in this study. (B-D) Primary astrocytes isolated from mice. (B) Typical image of P2Y1R expressed in astrocytes after treatment with shRNA (n=3) in the in vitro cell model (green: GFAP; blue: DAPI; red: P2Y1R; scale bar=50 µm). (C) The protein expression of the P2Y1 receptor (~63 kDa); the bar chart shows the presented levels of the P2Y1R in all groups (n=3). Expression of β-actin (~42 kDa) served as a loading control. (D) The expression of P2Y1R mRNA in astrocytes in vitro was determined by qPCR. The expression of P2Y1R mRNA in P2Y1R-shRNA-treated astrocytes (n=3) was only 41% of that in the control group (n=3). (Mean ± SEM, **p < 0.01, two-tailed student’s t-test).
Figure. 4.
Figure. 4.
P2Y1R expression in mouse brain treated with P2Y1R-shRNA was assessed by using immunofluorescence, western blotting, and qPCR. (A) EGFP expression in the brain after P2Y1-shRNA AAV injection. By intracerebroventricular injection, AAV vector can express itself after the intraventricular injection (Green: EGFP; blue: DAPI; red: GFAP; scale bar=50 µm). (B, C) P2Y1R expression in mouse brains after injection with P2Y1R-shRNA AAV vector was determined by western blotting and qPCR. (B) The protein expression of the P2Y1R in the brain was assessed by western blotting in the control group (n=3). and P2Y1-shRNA-treated AD mouse group (n=3). (Mean ± SEM, **p < 0.01, two-tailed student’s t-test). (C) The expression of P2Y1R mRNA in the brain was determined by qPCR (n=6) (Mean ± SEM, *p<0.05, Unpaired t test with Welch’s correction test). (D, E) P2Y1 mRNA expression in MACS-isolated astrocytes was assessed via qPCR (n=5). (Mean ± SEM, *p < 0.05, Manny-Whitney test).
Figure 5.
Figure 5.
Astrocyte-specific P2Y1R-knockdown reduced glial neuroinflammation in AD mice. (A) A typical image of amyloid-beta staining. Scale bar=50 μm. (B) Statistical results for the amyloid-beta plaque area in immunofluorescence of the control group (n=3) and P2Y1R-shRNA treated AD mice group (n=4). (C) ELISA detection of Aβ42 and Aβ40 protein in brain tissue. The ratio of Aβ42 to Aβ40 in the APP/PS1-P2Y1-shRNA group (n=4) and WT group (n=3) was significantly lower than that in the control AAV-treated APP/PS1 group (n=7). (D) A typical image of astrocytes. Scale bar=50 μm. (E) The number of fluorescent-positive (GFAP+) cells. The number of GFAP+ cells in the APP/PS1-P2Y1R-shRNA group (n=9) and WT group (n=11) was significantly lower than that in the APP/PS1-control-shRNA group (n=9). (F) A typical image of microglia. Scale bar=50 μm. (G) The number of fluorescent-positive (Iba1+) cells. (H, I) The expression of IL-1β mRNA and IL-6 mRNA was determined by qPCR. The expression of IL-6 mRNA in the APP/PS1-P2Y1 shRNA group (n=3) was significantly lower than that in the control APP/PS1 group (n=3), and there was a significant difference in the expression of IL-1β mRNA between the control APP/PS1 group (n=3) and APP/PS1-P2Y1 shRNA group (n=3). (J) The expression of IL-6 mRNA in astrocytes was determined by qPCR. After MACS separation of astrocytes, the expression of IL-6 mRNA in the APP/PS1-P2Y1R shRNA group (n=3) was significantly lower than that in the scramble shRNA (control)-treated APP/PS1 group (n=3) . (Mean ± SEM, *p<0.05, **p<0.01, ***p<0.001, ****p<0.0001; one-way ANOVA test, Bonferroni’s multiple comparison test in C, E and G; two-tailed student’s t test in B, H, I; Unpaired t test with Welch’s correction test in J).
Figure 6.
Figure 6.
The expression of PDGFRβ and fibrinogen in brain vessels of P2Y1R-shRNA-treated AD mice, control-AAV-treated AD mice, and WT mice. (A) Typical images of PDGFRβ and lectin in APP/PS1 mice (n=8), P2Y1-shRNA-treated APP/PS1 mice (n=7), and WT mice (n=5). Scale bar=50 μm. (B) The ratio of PDGFRβ to lectin in mouse brain tissue. (Mean ± SEM, **p<0.01, Kruskal-Wallis test, Dunn’s multiple comparison test). (C) Typical images of fibrinogen and lectin in APP/PS1 mice (n=6), P2Y1-shRNA-treated APP/PS1 mice (n=6), and WT mice (n=7). Scale bar=50 μm. (D) The ratio of fibrinogen to lectin in mouse brain tissue. (Mean ± SEM, * p<0.05, one-way ANOVA test, Bonferroni’s multiple comparison test).
Figure 7.
Figure 7.
Morris Water Maze test to evaluate the effect of astrocytic silencing of P2Y1R. (A) The flow tree of the Morris water maze used in this study; (B) representative movement by WT mice (n=13), P2Y1R-shRNA-treated AD mice (n=9), and control-shRNA-treated AD mice (n=13) in the Morris water maze; (C and E) escape latency of the initial test and reversal test; (D) the 1-day probe test after the initial test, in which the platform was removed and measured by the proportion of time spent in the target area and the time mice first reached the target. (F) The proportion of time spent in the target area and the time mice first reached the target were measured in the 1-day probe test after the reversal test in which the platform was removed. (Mean ± SEM, *p<0.05, **p<0.01, ***p<0.001, Line graph: two-way ANOVA test, followed by Bonferroni’s multiple comparison test; Bar graph: One-way ANOVA test, followed by Bonferroni’s multiple comparison test).
Figure 8.
Figure 8.
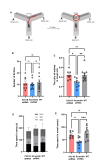
Y maze test to evaluate the effect of astrocytic silencing of P2Y1R. (A) The flow-process diagram of the Y maze; (B) the total number of arm entries of AD mice injected with P2Y1-shRNA AAV (n=8) or control AAV (n=9) and WT mice (n=10); The number of arm entries did not differ by group; (C) the percent entries of the novel arm; compared with control AAV treated AD mice (n=9), the APP/PS1-P2Y1shRNA mice group (n=8) preferred entry to the novel arm. (D and E) The time mice spent in each arm was calculated. Compared with the control-AAV group (n=9), the WT (n=10) and P2Y1-shRNA-treated AD mouse groups (n=8) spent more time in the novel arm. (Mean ± SEM, *p<0.05, **p<0.01, ***p<0.001, one-way ANOVA test, Bonferroni’s multiple comparison test).
Figure 9.
Figure 9.
Fear conditioning test to evaluate the effect of astrocytic silencing of P2Y1R. (A) The schema of the contextual fear conditioning test. (B, C) The freezing rate of the contextual test on day 2 of AD mice injected with P2Y1-shRNA AAV (n=7) or control AAV (n=7) and WT mice (n=9). (D, E) The freezing rate of the cued test on day 3. (Mean ± SEM, **p<0.01, ***p<0.001, Line graph: two-way ANOVA test, Bonferroni’s multiple comparison test; Bar graph: one-way ANOVA test, Bonferroni’s multiple comparison test).
Figure 10.
Figure 10.
Schematic illustration of the findings obtained from this study. Based on this study, we propose how astrocytic silencing of P2Y1R improves cognitive performance in animal model of AD. First, knockdown of the P2Y1R in astrocytes suppresses over-activation of not only astrocytes but also microglia to reduce neuroinflammation, through the reduction of proinflammatory cytokines IL-6 or IL-1β. Second, knockdown of the P2Y1R in astrocytes improve PDGFRβ expression on pericytes and blood-brain barrier function, which may relate to the reduction of amyloid-beta deposition in the brains of AD mice. Third, cognitive impairment in AD mice caused by amyloid-beta depositions, neuroinflammation with excess release of IL-6 and IL-1β, and blood-brain barrier leakage can be reversed by knockdown of the P2Y1R in astrocytes. Therefore, one-time gene therapy for astrocytic P2Y1R silencing can reduce AD symptoms and recover cognitive function of AD mice.

Similar articles

Cited by

References

    1. Lozupone M, Solfrizzi V, D'Urso F, Di Gioia I, Sardone R, Dibello V, Stallone R, Liguori A, Ciritella C, Daniele A, Bellomo A, Seripa D, Panza F (2020). Anti-amyloid-beta protein agents for the treatment of Alzheimer's disease: an update on emerging drugs. Expert Opin Emerg Drugs, 25:319-335. - PubMed
    1. Passeri E, Elkhoury K, Morsink M, Broersen K, Linder M, Tamayol A, Malaplate C, Yen FT, Arab-Tehrany E (2022). Alzheimer's Disease: Treatment Strategies and Their Limitations. Int J Mol Sci, 23:13954. - PMC - PubMed
    1. Allen NJ (2013). Role of glia in developmental synapse formation. Curr Opin Neurobiol, 23: 1027-1033. - PubMed
    1. Chung WS, Allen NJ, Eroglu C (2015). Astrocytes Control Synapse Formation, Function, and Elimination. Cold Spring Harb Perspect Biol, 7:a020370. - PMC - PubMed
    1. Han RT, Kim RD, Molofsky AV, Liddelow SA (2021). Astrocyte-immune cell interactions in physiology and pathology. Immunity, 54:211-224. - PubMed

MeSH terms

Substances

Grants and funding

We appreciate Drs. Shuichi Koizumi and Cristian Gachet for kindly providing the P2Y1KO mice. This work was supported by Grant-in-Aid for Scientific Research (21H02152 & 25115004, awarded to TH).

LinkOut - more resources