. 2023 Oct 27;24(21):15641.
doi: 10.3390/ijms242115641.

Contralateral Astrocyte Response to Acute Optic Nerve Damage Is Mitigated by PANX1 Channel Activity

Affiliations

Contralateral Astrocyte Response to Acute Optic Nerve Damage Is Mitigated by PANX1 Channel Activity

Jasmine A Wurl et al. Int J Mol Sci. .

Abstract

Glial reactivity is considered a hallmark of damage-induced innate immune responses in the central nervous system. In the visual system, unilateral optic nerve damage elicits dramatic glial reactivity in the retina directly affected by the lesion and a similar, albeit more modest, effect in the contralateral eye. Evaluation of astrocyte changes in a mouse model of optic nerve crush indicates that astrocyte reactivity, as a function of retinal coverage and cellular hypertrophy, occurs within both the experimental and contralateral retinas, although the hypertrophic response of the astrocytes in the contralateral eyes is delayed for at least 24 h. Evaluation of astrocytic reactivity as a function of Gfap expression indicates a similar, muted but significant, response in contralateral eyes. This constrained glial response is completely negated by conditional knock out of Panx1 in both astrocytes and Müller cells. Further studies are required to identify if this is an autocrine or a paracrine suppression of astroglial reactivity.

Keywords: Müller cell; PANX1 hemichannels; astrocyte; contralateral retina; unilateral optic nerve damage.


Conflict of interest statement

The authors declare no conflict of interest.

Figures

Figure 1
Figure 1
Retinal coverage by astrocytes after optic nerve crush. Scatter plot showing mean and standard deviation of the percentage of retinal coverage by astrocytes. Each point represents the average coverage of an individual retina. There was no significant difference in the percent coverage between experimental and contralateral retinas at any time point after crush surgery. In group comparisons, the retinas from mice with unilateral optic nerve injury showed a decrease in coverage at 1, 3, and 7 days after crush compared to naïve retinas (* p = 0.043, ** p = 0.0058, *** p < 0.0001, ANOVA). Notably, the observed group decrease at 1 day appears to be driven by changes in the contralateral eyes, which were significantly different than naïve eyes (p = 0.018, t-test), while experimental eyes were not significantly different (p = 0.734, t-test). At 14 and 21 days after crush, both experimental and contralateral eyes exhibited a large variance in the percent coverage, but there was no significant difference between these eyes compared to naïve retinas in group comparisons.
Figure 2
Figure 2
Astrocyte hypertrophy scoring after unilateral optic nerve crush injury. Box and whisker plots of astrocyte scores from retinas at increasing times after optic nerve crush compared to naïve retinas. Outlier data are graphed as individual points. Each plot represents scores from fields imaged from a minimum of 3 retinas (minimum of 30 cells scored). One day after crush surgery, experimental retinas exhibited a significant increase in the astrocyte hypertrophy score compared to both naïve and contralateral retinas (*** p < 0.0001, individual t-tests). By 3 days, and extending over 7 and 14 days, both contralateral and experimental retinas exhibited hypertrophic changes compared to naïve retinas (**** p < 0.0001, ANOVA). On days 3–21, the hypertrophy score was not significantly different between the contralateral and experimental retinas, although experimental eyes still exhibited a modest difference in score compared to naïve samples (* p = 0.022).
Figure 3
Figure 3
Validation of CRE activity in retinal macroglia. To confirm that Gfap-Cre transgenic mice successfully modified gene expression in target cells of the retina, this line was crossed with Rosa26-(LoxP)-tdTomato reporter mice and analyzed in frozen sections. (A) Section showing tdTomato fluorescence counterstained with an antibody against SOX9 which labels both astrocytes (asterisk) and Müller cells (arrow) and subsets of retinal pigmented epithelium (RPE) cells. The tdTomato transgene is expressed in the entire astrocyte population and a subset of Müller cells. (B) Section showing tdTomato fluorescence counterstained with an antibody against BRN3A, which stains retinal ganglion cells (RGCs). RGCs are negative for tdTomato expression and expression in the astrocytes (asterisk) and Müller cell (arrow) end feet are clearly visible adjacent to the ganglion cell layer (GCL). Scale bar (A,B) = 100 µm. (C) Higher magnification of a section of the RPE layer showing a cluster of tdTomato-expressing cells (counterstained with anti-SOX9). Scale bar = 20 µm. (D,E) low and higher magnification images of the optic nerve and optic nerve head (ONH) showing robust staining in the glial lamina. Scale bar (D) = 750 µm. Scale bar (E) = 300 µm. All sections were counter-stained with DAPI. Outer nuclear layer (ONL). Inner nuclear layer (INL).
Figure 4
Figure 4
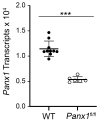
Quantitative RT-PCR of retinal Panx1 mRNA levels. Scatter plot of the absolute levels of Panx1 transcripts in retinas of naïve wild-type (WT) or Panx1fl/fl (macroglia) mice. Each data point represents the message level in a single retina, normalized to the amount of mRNA of S16 ribosomal protein. Panx1fl/fl mice exhibit a greater than 2-fold decrease in mRNA abundance (*** p < 0.0001, t-test).
Figure 5
Figure 5
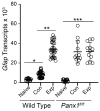
Quantitative analysis of retinal Gfap transcript abundance after optic nerve injury. Scatter plot of qPCR evaluation of the absolute abundance of Gfap transcripts in retinas of wild-type and Panx1fl/fl mice comparing levels present in naïve retinas compared to both the contralateral and experimental retinas 7 days after optic nerve crush surgery. Each point represents an individual retina. Wild-type mice exhibit a significant increase in Gfap mRNA in both the contralateral retinas (* p < 0.0001) and experimental retinas (p < 0.0001), although levels were significantly higher in the experimental eyes relative to contralateral eyes (** p < 0.0001). Similarly, in mice with Panx1 deleted in macroglia, both contralateral and experimental retinas exhibited a significant increase in Gfap mRNA levels relative to naïve mice (*** p < 0.0001) but at levels that were statistically equivalent to each other and to experimental retinas in wild-type mice (p = 0.866).
Figure 6
Figure 6
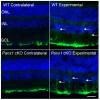
GFAP immunostaining of retinal sections. GFAP immunostaining of retinal sections from wild-type (WT) mice and mice with Panx1 conditionally knocked out (cKO) in macroglia, showing both the contralateral and experimental retinas 7 days after optic nerve crush surgery. Contralateral retinas from both genotypes of mice exhibit GFAP localization restricted to the nerve fiber layer adjacent to the ganglion cell layer (GCL), indicative of staining in astrocytes. This pattern of staining was indistinguishable from the pattern observed in naïve retinas [19]. The experimental retinas exhibit GFAP staining in both the astrocytes and in Müller cells, which extend processes into the outer retina (arrows) and extend to the nerve fiber layer. Scale bar = 100 µm. Outer nuclear layer (ONL). Inner nuclear layer (INL).
Figure 7
Figure 7
A hypothetical model of gliotic responses in the experimental and contralateral retinas after optic nerve damage. This model assumes the interplay of 4 retinal cell types that interact to both induce reactivity and suppress it. In the experimental retina (the retina directly affected by optic nerve damage), reactive gliosis is principally initiated by damage to the retinal ganglion cells (RGCs). This leads to the astrocyte response which is mediated through reactive microglia. Reactive astrocytes then present an unknown toxic signaling environment that mediates further RGC damage and loss leading to a continuous loop of pathology. The cycle is finally broken by an unknown purinergic signaling pathway that involves the release of ATP from PANX1 channels. Indirect evidence suggests this process is mediated by Müller cells and it is unknown if the signaling is autocrine or paracrine, or both (designated by the question marks). In the contralateral retina, astrocyte reactivity is mediated not by initial RGC pathology but by signaling from an astrocyte network (yellow cells) that extends from the site of injury through to the contralateral optic nerve and is facilitated by gap junctions between these cells. We predict that the purinergic signaling pathway that suppresses astrocyte reactivity in the experimental retina is activated early in the contralateral retina to help minimize activation of the pathology loop between RGCs, microglia, and astrocytes.
Figure 8
Figure 8
Exemplar of astrocyte hypertrophy scoring. Individual GFAP-immunostained retinal astrocytes showing increasing hypertrophy based on morphology. A score of 1 reflected cells with a principally bipolar shape with 2–4 major thin branches and minimal connection to other cells. A score of 2 reflected cells with 4 or more thin branches, also with minimal connections to other cells. A score of 3 indicated cells with an enlarged soma and multiple primary and secondary branches. A score of 4 indicated cells with thick somas and branches. The branches also exhibited multiple secondary, tertiary, and quaternary branches and numerous connections with adjacent astrocytes. A score of 5 indicated cells with numerous fan-shaped branches, including multiple connections. Scale bar = 40 µm.

Similar articles

Cited by

References

    1. de Hoz R., Rojas B., Ramírez A.I., Salazar J.J., Gallego B.I., Triviño A., Ramírez J.M. Retinal macroglial responses in health and disease. BioMed Res. Int. 2016;2016:2954721. doi: 10.1155/2016/2954721. - DOI - PMC - PubMed
    1. Stence N., Waite M., Dailey M.E. Dynamics of microglial activation: A confocal time-lapse analysis in hippocampal slices. Glia. 2001;33:256–266. doi: 10.1002/1098-1136(200103)33:3<256::AID-GLIA1024>3.0.CO;2-J. - DOI - PubMed
    1. Colombo G., Cubero R.J.A., Kanari L., Venturino A., Schulz R., Scolamiero M., Agerberg J., Mathys H., Tsai L.-H., Chachólski W., et al. A tool for mapping microglial morphology, morphOMICS, reveals brain-region and sex-dependent phenotypes. Nat. Neurosci. 2022;25:1379–1393. doi: 10.1038/s41593-022-01167-6. - DOI - PMC - PubMed
    1. Kim Y.S., Joh T.H. Microglia, major player in the brain inflammation: Their roles in the pathogenesis of Parkinson’s disease. Exp. Mol. Med. 2006;38:333–347. doi: 10.1038/emm.2006.40. - DOI - PubMed
    1. Olson J.K., Miller S.D. Microglia initiate central nervous system innate and adaptive immune responses through mulitple TLRs. J. Immunol. 2004;173:3916–3924. doi: 10.4049/jimmunol.173.6.3916. - DOI - PubMed