. 2023 Nov 11;20(1):260.
doi: 10.1186/s12974-023-02946-z.

Infiltrating myeloid cell-derived properdin markedly promotes microglia-mediated neuroinflammation after ischemic stroke

Affiliations

Infiltrating myeloid cell-derived properdin markedly promotes microglia-mediated neuroinflammation after ischemic stroke

Pin-Yi Liu et al. J Neuroinflammation. .

Abstract

Background: Emerging evidence has shown that myeloid cells that infiltrate into the peri-infarct region may influence the progression of ischemic stroke by interacting with microglia. Properdin, which is typically secreted by immune cells such as neutrophils, monocytes, and T cells, has been found to possess damage-associated molecular patterns (DAMPs) properties and can perform functions unrelated to the complement pathway. However, the role of properdin in modulating microglia-mediated post-stroke neuroinflammation remains unclear.

Methods: Global and conditional (myeloid-specific) properdin-knockout mice were subjected to transient middle cerebral artery occlusion (tMCAO). Histopathological and behavioral tests were performed to assess ischemic brain injury in mice. Single-cell RNA sequencing and immunofluorescence staining were applied to explore the source and the expression level of properdin. The transcriptomic profile of properdin-activated primary microglia was depicted by transcriptome sequencing. Lentivirus was used for macrophage-inducible C-type lectin (Mincle) silencing in microglia. Conditioned medium from primary microglia was administered to primary cortex neurons to determine the neurotoxicity of microglia. A series of cellular and molecular biological techniques were used to evaluate the proinflammatory response, neuronal death, protein-protein interactions, and related signaling pathways, etc. RESULTS: The level of properdin was significantly increased, and brain-infiltrating neutrophils and macrophages were the main sources of properdin in the ischemic brain. Global and conditional myeloid knockout of properdin attenuated microglial overactivation and inflammatory responses at the acute stage of tMCAO in mice. Accordingly, treatment with recombinant properdin enhanced the production of proinflammatory cytokines and augmented microglia-potentiated neuronal death in primary culture. Mechanistically, recombinant properdin served as a novel ligand that activated Mincle receptors on microglia and downstream pathways to drive primary microglia-induced inflammatory responses. Intriguingly, properdin can directly bind to the microglial Mincle receptor to exert the above effects, while Mincle knockdown limits properdin-mediated microglial inflammation.

Conclusion: Properdin is a new medium by which infiltrating peripheral myeloid cells communicate with microglia, further activate microglia, and exacerbate brain injury in the ischemic brain, suggesting that targeted disruption of the interaction between properdin and Mincle on microglia or inhibition of their downstream signaling may improve the prognosis of ischemic stroke.

Keywords: Ischemic stroke; Macrophages; Microglia; Mincle; Neutrophils; Properdin.


Conflict of interest statement

All authors have declared no competing interests.

Figures
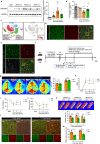
Fig. 1
Fig. 1
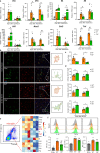
Properdin accumulates in the ischemic brain and exacerbates brain injury. a Protein expression of properdin relative to GAPDH in the ischemic hemisphere. n = 4 in sham group and 8 in the tMCAO group. ***P < 0.001 versus the sham group, one-way ANOVA with Bonferroni post hoc test. b Concentrations of properdin in the serum of tMCAO model mice. n = 5 in the sham group, 6 in the 1 d after tMCAO group, 9 in the 3 d after tMCAO group and 11 in the 7 d after tMCAO group. *P < 0.05 versus the sham group, ***P < 0.001 versus the sham group, one-way ANOVA with Bonferroni post hoc test. c The tSNE plot shows the clusters of brain cells (left, cell numbers were indicated in the parentheses) and visualizes the distribution of Cfp expression (right) after ischemic stroke. d Immunostaining for properdin and Ly6G in C57BL/6J (B6) mice 1 d after tMCAO. Scale bars: 10 µm and 50 µm. e Immunostaining for properdin, Iba-1 and TMEM119 in C57BL/6J (B6) mice 3 d after tMCAO. Yellow arrows: macrophages. Blue arrows: microglia. Scale bars: 10 µm and 50 µm. f Timeline of the experimental design. g Assessment of regional cerebral blood flow in WT and Cfp−/− mice subjected to tMCAO. n = 5 mice per group. n.s, no significance (P > 0.05), two-way ANOVA with Sidak's multiple comparisons test. hj Neurological deficits were evaluated by the mNSS (h), grip strength (i) and rotarod test (j) at 1 d, 3 d, and 7 d after tMCAO. n = 10 mice per group. *P < 0.05 versus the WT group, **P < 0.01 versus the WT group, two-way ANOVA with Sidak's multiple comparisons test. k The infarct area was assessed by TTC staining 1 d, 3 d, and 7 d after tMCAO. n = 8 mice per group. *P < 0.05 versus the WT group, ***P < 0.001 versus the WT group, unpaired Student’s t test. l, m Representative images and quantification of apoptotic neurons stained with TUNEL and NeuN 1 d and 3 d after tMCAO. Scale bar: 50 µm. n = 5 mice per group. *P < 0.05 versus the WT group, **P < 0.01 versus the WT group, unpaired Student’s t test
Fig. 2
Fig. 2
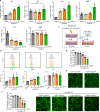
Properdin knockout ameliorates microglial activation and inflammation in tMCAO mice. a qPCR assessment of differentially expressed inflammatory genes, including Il1a, Il1b, Il4, Il6, Il10, Nos2, Ccl2 and Tnf, in the ischemic penumbra 1 d and 3 d after tMCAO. n = 5 mice per group. *P < 0.05 versus the sham group, **P < 0.01 versus the sham group, #P < 0.05 versus the WT group, ##P < 0.01 versus the WT group, one-way ANOVA with Bonferroni post hoc test. b Immunostaining for TMEM119 (green) and Iba1 (red) and 3D-reconstructed images of TMEM119+Iba1+ microglia 1 d and 3 d after tMCAO. Scale bar: 50 µm. n = 5 mice per group. *P < 0.05 versus the WT group, **P < 0.01 versus the WT group, unpaired Student’s t test. c Quantification of Iba1 MFI. d Quantification of average branch length, branch numbers and junctions of 3D-reconstructed microglia in the peri-infarct region. e One day after tMCAO, microglia sorted based on the CD45int and CD11b+ strategy were subjected to PCR array analysis. f FACS analysis of IL-1β, TNF-α and IL-6 expression in microglia 1 d after tMCAO. MFI was quantified. n = 5 mice per group. ***P < 0.001 versus the sham group, ##P < 0.01 versus the WT group, one-way ANOVA with Bonferroni post hoc test
Fig. 3
Fig. 3
rmProperdin activates microglia and induces microglia-potentiated neuronal death in vitro. a The mRNA expression of inflammatory factors was measured in primary microglia treated with 2 µg/ml, 4 µg/ml and 8 µg/ml rmProperdin versus control microglia. n = 3 per group, *P < 0.05 versus the control group, **P < 0.01 versus the control group, ***P < 0.001 versus the control group, n.s, no significance (P > 0.05), one-way ANOVA with Bonferroni post hoc test. b FACS analysis of IL-1β, TNF-α and IL-6 expression in primary microglia treated with rmProperdin for 24 h. MFI was quantified. n = 3 per group, **P < 0.01 versus the control group, ***P < 0.001 versus the control group, one-way ANOVA with Bonferroni post hoc test. c Experimental design for the analysis of neuronal viability after treatment with rmProperdin or CM from rmProperdin-treated microglia. d Neuronal viability was assessed by CCK8 assay. n = 6 per group, ***P < 0.001 versus the control group, one-way ANOVA with Bonferroni post hoc test. e Analysis of neuronal death using calcein-AM (green)/PI (red) double staining. Scale bar: 50 µm. f Calcein-AM-positive primary cortical neurons were quantified as percentages of total cells. n = 5 per group, **P < 0.01 versus the control group, ***P < 0.001 versus the control group, one-way ANOVA with Bonferroni post hoc test
Fig. 4
Fig. 4
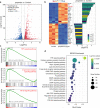
Molecular patterning of rmProperdin-treated primary microglia. a Volcano plot showing the upregulated and downregulated DEGs (∣log2FC∣ > 1, FDR < 0.05) between 8 µg/ml rmProperdin-treated primary microglia and control microglia. b Heatmap of genes differentially expressed between rmProperdin-treated microglia and unstimulated microglia. c GSEA plots showing that the significantly enriched gene sets positively correlated with rmProperdin-treated microglia were “TNF signaling pathway”, “NF-kappa B signaling pathway” and “C-type lectin receptor signaling pathway”. d Scatter plot of KEGG pathway enrichment analysis of DEGs in microglia treated with rmProperdin or not
Fig. 5
Fig. 5
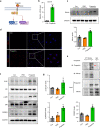
Properdin binds to and activates the Mincle receptor on microglia. a Description of Mincle receptor-mediated downstream signaling pathways. b Expression of Clec4e in rmProperdin-treated microglia versus control microglia was evaluated by qPCR. n = 3 to 4 per group, ***P < 0.001, unpaired Student’s t test. c Mincle receptor expression was assessed by Western blotting. n = 3 per group, **P < 0.01 versus the control group, one-way ANOVA with Bonferroni post hoc test. d Representative images of the Duolink PLA assay showing the PLA signals elicited by the interaction of rmProperdin and the Mincle receptor on primary microglia. e After immunoprecipitation with anti-Mincle, lysates of primary microglia treated with or without 8 µg/ml rmProperdin were immunoblotted with anti-properdin and anti-Mincle antibodies. Mouse IgG served as a control. f, g Western blotting analysis of p-Syk, p-p65, and C/EBPβ expression in rmProperdin-treated microglia versus control microglia. Quantification of the p-Syk/Syk ratio, p-p65/p65 ratio and C/EBPβ expression was normalized to the expression of the housekeeping gene GAPDH. n = 3 per group, *P < 0.05, **P < 0.01 versus the control group, one-way ANOVA with Bonferroni post hoc test
Fig. 6
Fig. 6
Clec4e silencing suppresses the proinflammatory effect of properdin on microglia. a Experimental design for Clec4e silencing in primary microglia. b The transfection efficiency of lentivirus in microglia was determined by qPCR. n = 3 per group, **P < 0.01 versus the Lv-NC group, one-way ANOVA with Bonferroni post hoc test. c Western blotting analysis of Mincle expression after Clec4e silencing. n = 3 per group, *P < 0.05 versus the Lv-NC + properdin group, one-way ANOVA with Bonferroni post hoc test. d Protein expression of p-Syk, p-p65 and C/EBPβ in microglia after silencing Clec4e. e Quantification of the p-Syk/Syk ratio, p-p65/p65 ratio and C/EBPβ expression was normalized to GAPDH expression. n = 3 per group, *P < 0.05 versus the Lv-NC + properdin group, **P < 0.01 versus the Lv-NC + properdin group, one-way ANOVA with Bonferroni post hoc test. f mRNA levels of Il1b, Tnf, Nos2 and Il10 in microglia after Clec4e knockdown. n = 3 per group, *P < 0.05 versus the control group, **P < 0.01 versus the control group, ***P < 0.001 versus the control group, #P < 0.05 versus the Lv-NC + properdin group, ##P < 0.01 versus the Lv-NC + properdin group, one-way ANOVA with Bonferroni post hoc test. g Images of calcein-AM/PI staining showing the level of neuronal death. The data were quantified as the percentage of calcein-AM-positive cells. n = 5 per group, ***P < 0.001 versus the control group, ##P < 0.01 versus the Lv-NC + CM group, one-way ANOVA with Bonferroni post hoc test
Fig. 7
Fig. 7
Cfp deficiency in macrophages and neutrophils attenuates inflammation and protects against ischemic brain injury. a Gating strategy for microglia based on CD45int and CD11b+. b-d qPCR assessment of Il1b, Tnf and Il6 expression levels in microglia isolated from mice 1 d and 3 d after tMCAO. n = 6 mice per group, *P < 0.05 versus the Cfpfl/fl group, unpaired Student’s t test. eg Evaluation of neurological function between LysM-cre Cfpfl/fl and Cfpfl/fl mice according to mNSS score (e), grip strength (f) and rotarod test (g) at 1 d and 3 d after tMCAO. n = 10 mice per group, *P < 0.05 versus the Cfpfl/fl group, **P < 0.01 versus the Cfpfl/fl group, ***P < 0.001 versus the Cfpfl/fl group, two-way ANOVA with Sidak's multiple comparisons test. h Representative images and quantification of the infarct area as assessed by TTC staining 1 d and 3 d after tMCAO. n = 8 mice per group, *P < 0.05 versus the Cfpfl/fl group, unpaired Student’s t test
Fig. 8
Fig. 8
Properdin released by myeloid cells exerts proinflammatory effects by directly binding to the microglial Mincle receptor and activating the downstream transcription factors NF-κB and C/EBPβ

Similar articles

Cited by

References

    1. Saini V, Guada L, Yavagal DR. Global epidemiology of stroke and access to acute ischemic stroke interventions. Neurology. 2021;97:S6–S16. doi: 10.1212/WNL.0000000000012781. - DOI - PubMed
    1. DeLong JH, Ohashi SN, O'Connor KC, Sansing LH. Inflammatory responses after ischemic stroke. Semin Immunopathol. 2022;44:625–648. doi: 10.1007/s00281-022-00943-7. - DOI - PubMed
    1. Borst K, Dumas AA, Prinz M. Microglia: immune and non-immune functions. Immunity. 2021;54:2194–2208. doi: 10.1016/j.immuni.2021.09.014. - DOI - PubMed
    1. Iadecola C, Buckwalter MS, Anrather J. Immune responses to stroke: mechanisms, modulation, and therapeutic potential. J Clin Invest. 2020;130:2777–2788. doi: 10.1172/JCI135530. - DOI - PMC - PubMed
    1. Candelario-Jalil E, Dijkhuizen RM, Magnus T. Neuroinflammation, stroke, blood-brain barrier dysfunction, and imaging modalities. Stroke. 2022;53:1473–1486. doi: 10.1161/STROKEAHA.122.036946. - DOI - PMC - PubMed