. 2023 Oct 31;12(21):2558.
doi: 10.3390/cells12212558.

Five Inhibitory Receptors Display Distinct Vesicular Distributions in Murine T Cells

Affiliations

Five Inhibitory Receptors Display Distinct Vesicular Distributions in Murine T Cells

Jiahe Lu et al. Cells. .

Abstract

T cells can express multiple inhibitory receptors. Upon induction of T cell exhaustion in response to a persistent antigen, prominently in the anti-tumor immune response, many are expressed simultaneously. Key inhibitory receptors are CTLA-4, PD-1, LAG3, TIM3, and TIGIT, as investigated here. These receptors are important as central therapeutic targets in cancer immunotherapy. Inhibitory receptors are not constitutively expressed on the cell surface, but substantial fractions reside in intracellular vesicular structures. It remains unresolved to which extent the subcellular localization of different inhibitory receptors is distinct. Using quantitative imaging of subcellular distributions and plasma membrane insertion as complemented by proximity proteomics and biochemical analysis of the association of the inhibitory receptors with trafficking adaptors, the subcellular distributions of the five inhibitory receptors were discrete. The distribution of CTLA-4 was most distinct, with preferential association with lysosomal-derived vesicles and the sorting nexin 1/2/5/6 transport machinery. With a lack of evidence for the existence of specific vesicle subtypes to explain divergent inhibitory receptor distributions, we suggest that such distributions are driven by divergent trafficking through an overlapping joint set of vesicular structures. This extensive characterization of the subcellular localization of five inhibitory receptors in relation to each other lays the foundation for the molecular investigation of their trafficking and its therapeutic exploitation.

Keywords: T cell activation; imaging; inhibitory receptor; proximity proteomics; vesicular trafficking.


Conflict of interest statement

The authors declare no conflict of interest.

Figures
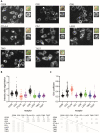
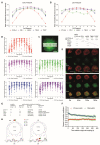
Figure 1
Figure 1
Inhibitory receptors are enriched in the interior of CD4+ T cells. (A) Representative spinning disk confocal midplane images of the GFP fluorescence of 5C.C7 T cells expressing a GFP fusion protein of the indicated receptor. The small images show, on the bottom, an individual cell and, on top, the matching overlay of the same GFP fluorescence in green, and the analysis masks for the cell edge and interior in orange over the corresponding DIC image. Scale bar = 5 µm. (B) The ratio of the midplane spinning disk confocal GFP fluorescence at the T cell edge over the interior of 5C.C7 T cells expressing a GFP fusion protein of the indicated receptor as mean ± SEM of run averages. Small symbols are individual cells with independent experiments denoted by color intensity. Large symbols are run averages. In total, 56 to 141 cells per receptor from 2 to 5 independent experiments. Statistical significance of differences between receptors is given in the table below, calculated based on run averages on top in black, based on individual cells on the left in grey. (C) Gini coefficients for the same T cells as in (B), given as in (B). * p < 0.05, ** p < 0.01, *** p < 0.001, **** p < 0.0001; p values calculated using one-way ANOVA.
Figure 3
Figure 3
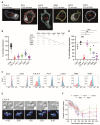
Inhibitory receptors are enriched in the interior of CD8+ T cells. (A) Representative spinning disk confocal midplane images of the GFP fluorescence of CL4 T cells expressing a GFP fusion protein of the indicated receptor. Scale bar = 5 µm. (B) The fraction of GFP fluorescence associated with the cell edge in CL4 T cells expressing a GFP fusion protein of the indicated receptor. Large symbols are averages of independent experiments with mean ± SEM and color intensity denoting matched experiments. Small symbols are the constituent single-cell measurements with independent experiments denoted by color intensity. A total of 77 to 131 cells per receptor from 2 independent experiments. Statistical significance of differences between receptors is given in the table to the right, calculated based on run averages on top in black based on individual cells on the left in grey. (C) Representative flow cytometry data of CD8+ T cells stimulated for 48 h stained for the indicated receptor on the cell surface (red) or in the entire cell (blue). (D) Fraction of endogenous inhibitory receptor expressed on the cell surface based on flow cytometry analysis (C) given as averages of independent experiments with mean ± SEM. In total, 3 to 5 independent experiments. (E) Representative time-lapse image sequence of a CL4 CTL expressing CTLA-4-GFP activating in the interaction with a Renca target cell incubated with 2 µg/mL HA peptide. DIC images on top, maximum projection images of the three-dimensional GFP fluorescence in a rainbow false color scale on the bottom, time given in minutes. Scale bar = 5 µm. (F) Average position of a single cluster of vesicles in cell couples of CL4 CTL expressing a GFP-fusion protein of the indicated receptor with a Renca target cell incubated with 2 µg/mL HA peptide over time as mean ± SEM. One is at the cellular interface, three is at the distal pole. In total, 15 to 41 cell couples per receptor from 3 independent experiments. * p < 0.05, ** p < 0.01, *** p < 0.001, **** p < 0.0001; p values calculated using one-way ANOVA.
Figure 4
Figure 4
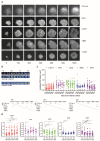
Inhibitory receptors are inserted into the plasma membrane during T cell activation. (A) Representative time-lapse TIRF images of the GFP fluorescence of CL4 CTL expressing a GFP fusion protein of the indicated receptor activated on glass coverslips coated with αCD3ε with (LAG3) or without ICAM-1 (rest of the data). Time given in seconds. Scale bar = 2 µm. (B) Time-lapse TIRF image sequence of the GFP fluorescence in a false color rainbow scale at frame rate of two membrane insertion events characterized by rapid appearance of the fluorescence signal followed by dispersion (top) in contrast to a stable receptor clustering event characterized by the more gradual appearance and a signal maintenance (bottom). (C) For the experiments shown in A, number of insertion events per 100 frames and µm2 for the indicated receptors as individual cells plus mean ± SEM. Time is denoted by the number of the last frame in the time interval. Here, 100 frames correspond to 30 s. Coverslips were coated with (part of the LAG3 data) or without ICAM-1 (rest of the data). All LAG3 data were pooled as detailed in (D). Here, 19 to 21 cells from 4 to 6 independent experiments. Statistical significance of differences between receptors is given in the tables below for each of the five time windows as indicated. (D) The same data as in C displayed in separate panels for the individual receptors with statistical differences between time windows. For LAG3, data from coverslips with or without ICAM-1 are indicated by light/dark shades of green, respectively. * p < 0.05, ** p < 0.01, *** p < 0.001, **** p < 0.0001; p values calculated using one-way (D) and two-way (C) ANOVA.
Figure 8
Figure 8
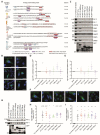
The cytoplasmic and transmembrane domains of the inhibitory receptors associate with AP-1 and AP-2. (A) Protein sorting motifs in the cytoplasmic domains of the inhibitory receptors. Figure panel created with BioRender.com. (B) Representative images of HEK293T cells expressing fusion proteins of the cytoplasmic domains of the inhibitory receptors and of full-length CTLA-4 for comparison (Hoechst 33258 in blue, GFP in green) as indicated. Scale bar = 10 µm. (C) Representative Western Blots of GFP pull-down experiments from the HEK293T cells in B as indicated on top, with antibodies against vesicular markers and GFP as a control for fusion protein expression as indicated on the right. Full-size blots in Figure S6. (D,E) Log2 of enrichment of AP-1 (D) and AP-2 (E) at the cytoplasmic domains of the indicated receptors fused to GFP relative to GFP only. Three independent experiments. (F) Representative images of HEK293T cells expressing fusion proteins of the cytoplasmic and transmembrane domains of the inhibitory receptors and of full-length CTLA-4 for comparison (Hoechst 33258 in blue, GFP in green) as indicated. Scale bar = 10 µm. (G) Representative Western Blot of GFP pull-down experiments from the HEK293T cells in F as indicated on top with antibodies against AP-1, AP-2, and GFP as a control for fusion protein expression as indicated on the right. Full-size blots in Figure S6. (H,I) Log2 of enrichment of AP-1 (H) and AP-2 (I) at the cytoplasmic and transmembrane domains of the indicated receptors fused to GFP relative to GFP only. Three to seven independent experiments. A fusion protein of GFP with the cytoplasmic domain of cation-independent mannose 6-phosphate receptor (CI-MPRcyt) is used as the positive control for AP-1 and AP-2 binding. * p < 0.05, ** p < 0.01, *** p < 0.001 relative to GFP only; p values calculated using one-way ANOVA.
Figure 2
Figure 2
Inhibitory receptors are enriched in the interior of CD8+ T cells. (A) Representative spinning disk confocal midplane images of the GFP fluorescence of CL4 T cells expressing a GFP fusion protein of the indicated receptor. The small images show, on the bottom, an individual cell and, on top, the matching overlay of the same GFP fluorescence in green, and the analysis masks for the cell edge and interior in orange over the corresponding DIC image. Scale bar = 5 µm. (B) The ratio of the midplane spinning disk confocal GFP fluorescence at the T cell edge over the interior of CL4 T cells expressing a GFP fusion protein of the indicated receptor as mean ± SEM of run averages. Small symbols are individual cells with independent experiments denoted by color intensity. Large symbols are run averages. In total, 77 to 131 cells per receptor from 5 to 6 independent experiments. Statistical significance of differences between receptors is given in the table below, calculated based on run averages on top in black, based on individual cells on the left in grey. (C) Gini coefficients for the same T cells as in (B), given as in (B). * p < 0.05, ** p < 0.01, *** p < 0.001, **** p < 0.0001; p values calculated using one-way ANOVA.
Figure 5
Figure 5
Inhibitory receptors are distinctly distributed in the plasma membrane during T cell activation. (AC) CL4 CTL expressing a GFP fusion protein of the indicated receptor was activated on glass cover slips coated with αCD3ε and ICAM-1 and imaged by TIRF. Given is the GFP fluorescence intensity in ten equally sized segments of a line scan with a line width of 5 µm across the entire interface as mean ± SEM normalized as 1 for the segment with the highest intensity within 30 s (A) and >5 min (B) of CTL spreading. In total, 50 CTLs were analyzed per receptor from 4 to 6 independent experiments. Statistical significance of differences between receptors is given in the table separately for the early (in grey on the left) and late (in black on top) time points. (C) The representative image shows the 10 measurement regions. Scale bar = 5 µm. (D) The same data as in A are displayed separately for each inhibitory receptor with statistical significance of differences between early and late time points in each line scan segment. (E) Representative time-lapse TIRF images of the GFP and tdTomato fluorescence of CL4 CTL expressing the indicated fluorescent protein fusion protein of the indicated receptors activated on glass coverslips coated with αCD3ε and ICAM-1. Time given in seconds. Scale bar = 10 µm. (F) For the experiments shown in (E) and the indicated combinations of inhibitory receptors, Pearson’s correlation coefficients for GFP and tdTomato fluorescence across the entire interface as mean ± SEM over time. (G,H) Summary of imaging data from Figure 1, Figure 2, Figure 3, Figure 4 and Figure 5, as a table (G) and graphically as created with Biorender.com (accessed on 18 July 2023) (H). * p < 0.05, ** p < 0.01, *** p < 0.001, **** p < 0.0001; p values calculated using two-way ANOVA (A) and Wilcoxon matched-pairs rank test (B).
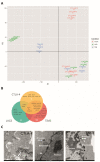
Figure 6
Figure 6
The vesicular proteomes of CTLA-4, LAG3, and TIM3 are distinct. (A) t-SNE plot of raw mass spectrometry peptide data after APEX2-mediated proximity biotinylation of proteins in the lumen of vesicles harboring APEX2 fusion proteins of CTLA-4, LAG3, and TIM3 expressed in CL4 CTL. Each dot is an independent experimental repeat labeled as P1 to P4 for the APEX2 experiments and as M1 to M4 for the no-APEX2 control for endogenously biotinylated proteins. (B) Gene names of proteins detected with a global false discovery rate of p < 0.05 in the lumen of vesicles expressing APEX2 fusions of CTLA-4, LAG3, and TIM3 and combinations thereof. (C) Examples of electron micrographs of CL4 CTL where vesicles expressing APEX2 fusion proteins of CTLA-4, LAG3, or TIM3 as indicated are labeled with an APEX2-mediated electron-dense precipitate as marked with a white arrow. Scale bar = 0.5 µm.
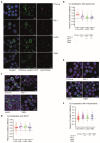
Figure 7
Figure 7
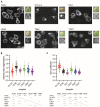
CTLA-4 is selectively enriched in lysosomally derived vesicles. (A) CL4 CTL expressing GFP fusion proteins of the indicated inhibitory receptors and incubated with LysoTracker Red DND-99 were activated by incubation with Renca target cells in the presence of 2 µg/mL HA agonist peptide for 10 min, fixed and stained for nuclei with Hoechst 33258. Given are confocal z-stack midplane images of the LysoTracker fluorescence (magenta), the GFP fluorescence (green), and merged images of all fluorescence data (Hoechst 33258 in blue). Scale bar = 6 µm. (B) For the experiment in A, Pearson’s correlation coefficients of the GFP and LysoTracker fluorescence distributions in the cytoplasm of individual CL4 CTL segmented from three-dimensional fluorescence data. Small symbols are individual cells with independent experiments denoted by color intensity. Large symbols are run averages. In total, 91 to 207 cells per receptor from 2 to 3 independent experiments. Statistical significance of differences between receptors is given in the table below, calculated based on individual cells on top in black, based on run averages on the left in grey. (C) CL4 CTL expressing GFP fusion proteins of the indicated inhibitory receptors were activated by incubation with Renca target cells in the presence of 2 µg/mL HA agonist peptide for 10 min, fixed and stained with αEAA1 and for nuclei with Hoechst 33258. Given are merged confocal z-stack midplane images of the αEAA1 (magenta), GFP (green), and Hoechst 33258 (blue) fluorescence. Scale bar = 6 µm. (D) For the experiment in C, Pearson’s correlation coefficients of the GFP and EAA1 fluorescence distributions in the cytoplasm of individual CL4 CTL segmented from three-dimensional fluorescence data. Small symbols are individual cells with independent experiments denoted by color intensity. Large symbols are run averages. In total, 101 to 166 cells per receptor from 2 independent experiments. There were no significant differences between the inhibitory receptors. (E) CL4 CTL expressing GFP fusion proteins of the indicated inhibitory receptors and incubated with MitoTracker Red CMXRos were activated by incubation with Renca target cells in the presence of 2 µg/mL HA agonist peptide for 10 min, fixed and stained for nuclei with Hoechst 33258. Given are merged confocal z-stack midplane images of the MitoTracker (magenta), GFP (green) and Hoechst 33285 (blue) fluorescence. Scale bar = 6 µm. (F) For the experiment in (E), Pearson’s correlation coefficients of the GFP and MitoTracker fluorescence distributions in the cytoplasm of individual CL4 CTL segmented from three-dimensional fluorescence data. Small symbols are individual cells with independent experiments denoted by color intensity. Large symbols are run averages. In total, 151 to 298 cells per receptor from 2 to 3 independent experiments. Statistical significance of differences between receptors is given in the table below, calculated based on individual cells on top in black, based on run averages on the left with no significant differences. * p < 0.05, ** p < 0.01, *** p < 0.001, **** p < 0.0001; p values calculated using one-way ANOVA.
Figure 9
Figure 9
The cytoplasmic and transmembrane domains of inhibitory receptors associate with sorting nexins. (A) Representative Western Blot of GFP pull-down experiments from the HEK293T cells in Figure 8F as indicated on top with antibodies against SNX1/2/5/6 and GFP as a control for fusion protein expression as indicated on the right. Full size blots in Figure S7. (BE) Log2 of enrichment of SNX1 (B), SNX2 (C), SNX5 (D), and SNX6 (E) at the cytoplasmic and transmembrane domains of the indicated receptors fused to GFP relative to GFP only. Three to eight independent experiments. (F) Representative Western Blot of GFP pull-down experiments from the HEK293T cells in Figure 8F as indicated on top with antibodies against VPS35 and GFP as a control for fusion protein expression as indicated on the right. (G) Log2 of enrichment of VPS35 at the cytoplasmic and transmembrane domains of the indicated receptors fused to GFP relative to GFP only. Eight independent experiments. A fusion protein of GFP with the cytoplasmic domain of cation-independent mannose 6-phosphate receptor (CI-MPRcyt) is used as the positive control for SNX-1 to SNX-6 binding. A fusion protein of GFP with the C-terminal cytoplasmic domain of polycystin-2 (PC2) is used as the positive control for VPS35 binding. * p < 0.05, ** p < 0.01, *** p < 0.001 relative to GFP only; p values calculated using one-way ANOVA.

Update of

Similar articles

Cited by

References

    1. Andrews L.P., Yano H., Vignali D.A.A. Inhibitory receptors and ligands beyond PD-1, PD-L1 and CTLA-4: Breakthroughs or backups. Nat. Immunol. 2019;20:1425–1434. doi: 10.1038/s41590-019-0512-0. - DOI - PubMed
    1. Anderson A.C., Joller N., Kuchroo V.K. Lag-3, Tim-3, and TIGIT: Co-inhibitory Receptors with Specialized Functions in Immune Regulation. Immunity. 2016;44:989–1004. doi: 10.1016/j.immuni.2016.05.001. - DOI - PMC - PubMed
    1. Schildberg F.A., Klein S.R., Freeman G.J., Sharpe A.H. Coinhibitory Pathways in the B7-CD28 Ligand-Receptor Family. Immunity. 2016;44:955–972. doi: 10.1016/j.immuni.2016.05.002. - DOI - PMC - PubMed
    1. Honda T., Egen J.G., Lammermann T., Kastenmuller W., Torabi-Parizi P., Germain R.N. Tuning of antigen sensitivity by T cell receptor-dependent negative feedback controls T cell effector function in inflamed tissues. Immunity. 2014;40:235–247. doi: 10.1016/j.immuni.2013.11.017. - DOI - PMC - PubMed
    1. Davis S.J., Ikemizu S., Evans E.J., Fugger L., Bakker T.R., van der Merwe P.A. The nature of molecular recognition by T cells. Nat. Immunol. 2003;4:217–224. doi: 10.1038/ni0303-217. - DOI - PubMed

LinkOut - more resources