. 2023 Nov 9;20(1):258.
doi: 10.1186/s12974-023-02943-2.

M2 macrophage-derived cathepsin S promotes peripheral nerve regeneration via fibroblast-Schwann cell-signaling relay

Affiliations

M2 macrophage-derived cathepsin S promotes peripheral nerve regeneration via fibroblast-Schwann cell-signaling relay

Eri Oshima et al. J Neuroinflammation. .

Abstract

Background: Although peripheral nerves have an intrinsic self-repair capacity following damage, functional recovery is limited in patients. It is a well-established fact that macrophages accumulate at the site of injury. Numerous studies indicate that the phenotypic shift from M1 macrophage to M2 macrophage plays a crucial role in the process of axon regeneration. This polarity change is observed exclusively in peripheral macrophages but not in microglia and CNS macrophages. However, the molecular basis of axonal regeneration by M2 macrophage is not yet fully understood. Herein, we aimed to identify the M2 macrophage-derived axon regeneration factor.

Methods: We established a peripheral nerve injury model by transection of the inferior alveolar nerve (IANX) in Sprague-Dawley rats. Transcriptome analysis was performed on the injured nerve. Recovery from sensory deficits in the mandibular region and histological reconnection of IAN after IANX were assessed in rats with macrophage depletion by clodronate. We investigated the effects of adoptive transfer of M2 macrophages or M2-derived cathepsin S (CTSS) on the sensory deficit. CTSS initiating signaling was explored by western blot analysis in IANX rats and immunohistochemistry in co-culture of primary fibroblasts and Schwann cells (SCs).

Results: Transcriptome analysis revealed that CTSS, a macrophage-selective lysosomal protease, was upregulated in the IAN after its injury. Spontaneous but partial recovery from a sensory deficit in the mandibular region after IANX was abrogated by macrophage ablation at the injured site. In addition, a robust induction of c-Jun, a marker of the repair-supportive phenotype of SCs, after IANX was abolished by macrophage ablation. As in transcriptome analysis, CTSS was upregulated at the injured IAN than in the intact IAN. Endogenous recovery from hypoesthesia was facilitated by supplementation of CTSS but delayed by pharmacological inhibition or genetic silencing of CTSS at the injured site. Adoptive transfer of M2-polarized macrophages at this site facilitated sensory recovery dependent on CTSS in macrophages. Post-IANX, CTSS caused the cleavage of Ephrin-B2 in fibroblasts, which, in turn, bound EphB2 in SCs. CTSS-induced Ephrin-B2 cleavage was also observed in human sensory nerves. Inhibition of CTSS-induced Ephrin-B2 signaling suppressed c-Jun induction in SCs and sensory recovery.

Conclusions: These results suggest that M2 macrophage-derived CTSS contributes to axon regeneration by activating SCs via Ephrin-B2 shedding from fibroblasts.

Keywords: Axon regeneration; Cathepsin S; Ephrin-B2; Gene expression; Macrophage; Peripheral nerve injury; Schwann cells.


Conflict of interest statement

The authors declare that they have no competing interests.

Figures
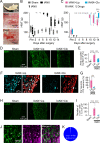
Fig. 1
Fig. 1
Macrophages contribute to sensory recovery in the lower lip after inferior alveolar nerve (IAN) transection. A Photographs showing the rat mandibular region (top) and IAN in sham rats (middle) and inferior alveolar nerve-transected (IANX) rats (bottom). The IAN is located under the bone in the area enclosed by the solid line (top). B Time course of head withdrawal threshold (HWT) of sham and IANX rats post-surgery. n = 5, Friedman test post hoc Dunn’s test, *P < 0.05 vs. day 2. C Time course of HWT of IANX rats that were administered with control liposome (Lipo) or clodronate liposome (Clo). IANX + Lipo (n = 6); IANX + Clo (n = 7), Friedman test post hoc Dunn’s test, **P < 0.01 vs. day 2; GEE post hoc Bonferroni’s test. D Images showing IBA1 immunofluorescence at the site of IAN injury 14 day post-IANX. E Columns represent the average values of the area occupied by IBA1 immunofluorescence at the injured site. n = 5–6, one-way ANOVA post hoc Tukey’s test. **P < 0.01, ***P < 0.001. F Images showing Fluoro-Gold (FG)-labeled trigeminal ganglion (TG) neurons at 14 day post-IANX. G Columns represent the average number of FG-labeled TG neurons out of the total TG neurons. n = 5 in each, unpaired t test. **P < 0.01, ***P < 0.001. H Images showing c-Jun immunofluorescence at the injured site 14 day post-IANX. I Columns represent the average number of c-Jun-positive cells at the injured site. n = 5–7, one-way ANOVA post hoc Tukey’s test. ***P < 0.001. J Images showing c-Jun and S100β immunofluorescence at the injured site 14 day post-IANX. K Pie chart showing the percentage of c-Jun-positive cells out of S100β-positive cells at the injured site 14 day post-IANX. n = 5
Fig. 2
Fig. 2
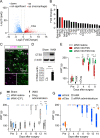
CTSS is required for the sensory recovery of the lower lip post-IANX. A Volcanic plot showing the gene expression changes between sham and IANX rats at the site of IAN injury on day 14 post-surgery (n = 3). Blue and red dots indicate the downregulated and upregulated genes at the injured site, respectively. Vivid red dots indicate upregulated genes, especially in macrophages. The yellow dot indicates Ctss mRNA. B Secretory molecules from macrophages among the upregulated genes. C Images showing IBA1/CTSS double-positive cells at the injured site 14 day post-IANX. D Blot of CTSS at the injured site 14 day post-surgery. The column represents the average values of CTSS/β-actin. n = 4 in each, unpaired t test. ***P < 0.001. E Time course of HWT in IANX rats treated with saline, recombinant human CTSS (rhCTSS), or rhCTSS + Clo. n = 5 in each, Friedman test post hoc Dunn’s test, *P < 0.05, **P < 0.01 vs. day 2; GEE post hoc Bonferroni’s test. ††P < 0.01, †††P < 0.001, #P < 0.05. F Time course of HWT in IANX rats treated with saline or Z-FL and sham rats. n = 5 in each, GEE post hoc Bonferroni’s test. *P < 0.05, ***P < 0.001. G Time course of HWT in IANX rats treated with negative control siRNA (siCont) or Ctss siRNA (siCtss). n = 5 in each, GEE post hoc Bonferroni’s test. **P < 0.01. Boxes show the 25th–75th percentiles with the median value as a line within each box, and whiskers indicate the 10th and 90th percentiles of the data in E, F, and G. All data points are shown as open circles
Fig. 3
Fig. 3
Macrophage-derived CTSS is involved in the sensory recovery of the lower lip post-IANX. A Time course of HWT in IANX rats treated with control medium (CM), M2 macrophage (M2), or M2 + Z-FL. n = 5 in each, GEE post hoc Bonferroni’s test. *P < 0.05, P < 0.05. B, C Blot of CTSS in the cell lysate (B) or supernatant (C) of non-stimulated macrophages (M0) and IL-4/IL-13-stimulated macrophages (M2). The column represents the average values of CTSS/β-actin. n = 4–5 independent cultures, unpaired t test, ***P < 0.001 in B. The column represents the relative expression of CTSS. n = 5 in each, unpaired t test **P < 0.01 in C. D Blot of CTSS in M2 macrophage treated with siCont or siCtss. The column represents the average values of CTSS/β-actin. n = 5 independent cultures, Mann–Whitney U test. *P < 0.05. E Time course of HWT in IANX rats transplanted with siCont-treated M2 macrophages or siCtss-treated M2 macrophages. n = 5 in each, GEE post hoc Bonferroni’s test. ***P < 0.001. Boxes show the 25th–75th percentiles with the median value as a line within each box, and whiskers indicate the 10th and 90th percentiles of the data in A, D, and E. Data represent the mean ± SEM in B and C. All data points are shown as open circles
Fig. 4
Fig. 4
CTSS cleaves Ephrin-B2. A Blot of full-length Ephrin-B2 (fEphrin-B2) and cleaved Ephrin-B2 (cEphrin-B2) at the site of IAN injury at 14 day post-IANX. B, C Columns represent the average expression values of fEphrin-B2/β-actin (B) or cEphrin-B2/β-actin (C). n = 5 in each, one-way ANOVA post hoc Tukey’s test. *P < 0.05, ***P < 0.001 in B, Kruskal–Wallis post hoc Dunn’s test, *P < 0.05 in C. D Blot of fEphrin-B2 and cEphrin-B2 after mixing of recombinant human Ephrin-B2 (rhEphrin-B2) and recombinant human CTSS (rhCTSS). E Column represents the average values of the integrated density of fEphrin-B2 or cEphrin-B2. n = 4 independent experiments, one-way ANOVA post hoc Tukey’s test. *P < 0.05, **P < 0.01, ***P < 0.001. Data represent the mean ± SEM in B, C, and E. All data points are shown as open circles
Fig. 5
Fig. 5
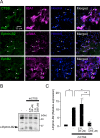
CTSS causes Ephrin-B2 cleavage in the human sensory nerve. A Images showing IBA1, CTSS, Ephrin-B2, αSMA, EphB2, or S100β immunofluorescence and Hoechst-33258 in the human nasopalatine nerve. Arrowheads indicate IBA1/CTSS-double-positive cells (top), Ephrin-B2/αSMA-double-positive cells (middle), and EphB2/S100β-double-positive cells (bottom). B Blots of fEphrin-B2 and cEphrin-B2 in the nasopalatine nerve homogenate after treatment with rhCTSS and Z-FL (20 or 200 μM). C Column represents the average values of fEphrin-B2/β-actin or cEphrin-B2/β-actin. n = 3 patients, one-way ANOVA post hoc Tukey’s test. *P < 0.05, **P < 0.01 All data points are shown in open circles
Fig. 6
Fig. 6
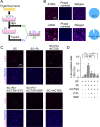
CTSS induces c-Jun in Schwann cells via the shedding of Ephrin-B2 on fibroblasts. A Schematic illustration of the isolation of Schwann cells (SCs) and fibroblasts (Fb) from the trigeminal nerve. B Images showing S100β-positive cells or αSMA-positive cells from isolated cells. Pie charts show the purity of S100β-positive cells or αSMA-positive cells isolated from mixed cultures of cells from the trigeminal nerve. n = 6 independent culture. C Images show c-Jun and Hoechst immunofluorescence in cultured SCs following treatment with rhCTSS, rhCTSS + Z-FL, or rhCTSS + Ephrin-B2 blocking peptide (EBP). D Column represents the average ratio of c-Jun-positive cells per SCs culture. n = 6 independent cultures, one-way ANOVA post hoc Tukey’s test. **P < 0.05, ***P < 0.01. All data points are shown in open circles
Fig. 7
Fig. 7
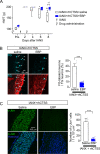
CTSS-induced Ephrin-B2 liberation accelerates sensory recovery. A Time course of HWT in IANX rats treated with rhCTSS + saline or rhCTSS + EBP. IANX + rhCTSS + saline (n = 7); IANX + rhCTSS + EBP (n = 5), Friedman test post hoc Dunn’s test, *P < 0.05, **P < 0.01 vs. day 2; GEE post hoc Bonferroni’s test. ††P < 0.01. Boxes show the 25th–75th percentiles with the median value as a line within each box, and whiskers indicate the 10th and 90th percentiles of the data. All data points are shown in open circles. B Images showing FG-labeled TG neurons 14 day post-IANX. Column represents the average number of FG-labeled TG neurons out of total TG neurons. n = 5 in each, unpaired t test. ***P < 0.001. C Images show c-Jun and Hoechst-33258 immunofluorescence at the site of IAN injury 14 day post-IANX. Column represents the average number of c-Jun-positive cells at the injured site. n = 5 in each, unpaired t test. ***P < 0.001. Data represent the mean ± SEM in B and C. All data points are shown as open circles
Fig. 8
Fig. 8
Schematic illustration of the proposed model of axon regeneration at the site of IAN injury. M2 macrophages accumulate at the injured site post-IANX. M2 macrophages then release CTSS, which liberates Ephrin-B2 on fibroblasts. Ephrin-B2 then binds to EphB2 on SCs, inducing SCs to change into repair phenotype, subsequently facilitating axon regeneration

Similar articles

Cited by

References

    1. Mahar M, Cavalli V. Intrinsic mechanisms of neuronal axon regeneration. Nat Rev Neurosci. 2018;19:323–337. doi: 10.1038/s41583-018-0001-8. - DOI - PMC - PubMed
    1. Rosenzweig ES, Courtine G, Jindrich DL, Brock JH, Ferguson AR, Strand SC, Nout YS, Roy RR, Miller DM, Beattie MS, et al. Extensive spontaneous plasticity of corticospinal projections after primate spinal cord injury. Nat Neurosci. 2010;13:1505–1510. doi: 10.1038/nn.2691. - DOI - PMC - PubMed
    1. Snyder DJ, Bartoshuk LM. Oral sensory nerve damage: causes and consequences. Rev Endocr Metab Disord. 2016;17:149–158. doi: 10.1007/s11154-016-9377-9. - DOI - PMC - PubMed
    1. Tay AB, Zuniga JR. Clinical characteristics of trigeminal nerve injury referrals to a university centre. Int J Oral Maxillofac Surg. 2007;36:922–927. doi: 10.1016/j.ijom.2007.03.012. - DOI - PubMed
    1. Ozen T, Orhan K, Gorur I, Ozturk A. Efficacy of low level laser therapy on neurosensory recovery after injury to the inferior alveolar nerve. Head Face Med. 2006;2:3. doi: 10.1186/1746-160X-2-3. - DOI - PMC - PubMed