. 2023 Nov 2;14(1):7023.
doi: 10.1038/s41467-023-42024-9.

In situ quantification of osmotic pressure within living embryonic tissues

Affiliations

In situ quantification of osmotic pressure within living embryonic tissues

Antoine Vian et al. Nat Commun. .

Abstract

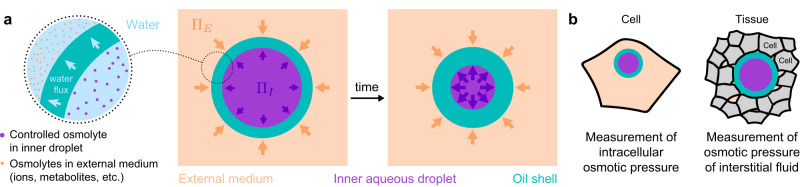
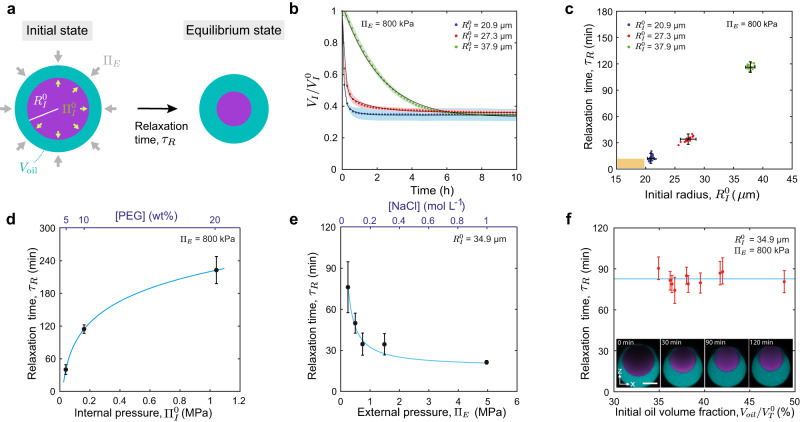
Mechanics is known to play a fundamental role in many cellular and developmental processes. Beyond active forces and material properties, osmotic pressure is believed to control essential cell and tissue characteristics. However, it remains very challenging to perform in situ and in vivo measurements of osmotic pressure. Here we introduce double emulsion droplet sensors that enable local measurements of osmotic pressure intra- and extra-cellularly within 3D multicellular systems, including living tissues. After generating and calibrating the sensors, we measure the osmotic pressure in blastomeres of early zebrafish embryos as well as in the interstitial fluid between the cells of the blastula by monitoring the size of droplets previously inserted in the embryo. Our results show a balance between intracellular and interstitial osmotic pressures, with values of approximately 0.7 MPa, but a large pressure imbalance between the inside and outside of the embryo. The ability to measure osmotic pressure in 3D multicellular systems, including developing embryos and organoids, will help improve our understanding of its role in fundamental biological processes.


Conflict of interest statement

A.V. and O.C. declare the following competing interests: Provisional patent, application number 63/383,647, Systems and Methods for Measuring Osmotic Pressure, Antoine Vian and Otger Campas, 2022. There are no other competing interests for any of the authors.

Figures

Fig. 1
Fig. 1. Double emulsion droplets as osmotic pressure sensors.
a Sketch of double emulsion droplets used as osmotic pressure sensors in cells or in the interstitial space between cells within living tissues. Relevant physical parameters are defined. b Sketch of a double emulsion droplet inside a cell (left) and in the extracellular space between cells (right), enabling measurements of the intracellular osmotic pressure and of the osmotic pressure of the extracellular interstitial fluid, respectively.
Fig. 2
Fig. 2. Characterization of double emulsion droplets at equilibrium.
a Sketch of a double emulsion droplet indicating its composition and characteristics. Microfluidic generation (b) of double emulsion droplets (c). d Confocal section of a droplet in a 0.4 M NaCl solution over time showing the temporal reduction in droplet sizes. Fluorocarbon oil (cyan) and fluorescent PEG (purple) are shown (color code as sketched in a). e Temporal evolution of the inner droplet volume, VI (purple), the outer droplet volume, VT (gray) and the oil layer volume (cyan). Error bands are droplet segmentation errors. Representative case, N = 1. f Temporal evolution of the inner droplet volume, VI (normalized by the initial volume, VI0), for double emulsion droplets placed in NaCl solutions of varying osmolarities (Methods). N = 20 (yellow), 16 (red), 16 (purple), 15 (green), 21 (blue), 17 (black) droplets for f, g. Mean ± SD for fh. g Measured dependence of the equilibrium inner droplet volume, VIE (normalized by VI0), on the externally imposed osmotic pressure, ΠE, with initial PEG concentrations, c0 = 5% w/w (black circles) and 10% w/w (red circles). Linear scale, left panel; log-log scale, right panel. Black and red lines are fits of Eq. 1 to the data with associated confidence bands (68%). Measured equilibrium volumes of the inner droplet for droplets with c0 = 5% w/w (black asterisk) and 10% w/w (red asterisk) when placed in cell culture media of known osmolarity. N = 13 (black), 25 (red) droplets. Small inset is a magnified region of g. h Initial size dependence of, (VIEVI*)/VI0, on ΠE for droplets of initial radius, RI0 (large droplets, RI0= 33.5 ± 0.6 µm, blue, N = 26 (0.5 MPa), 23 (0.75 MPa), 18 (1.5 MPa), 23 (2 MPa); small droplets: RI0 = 12.2 ± 0.3 µm, green, N = 26 (0.5 MPa), 23 (0.75 MPa), 18 (1.5 MPa), 23 (2 MPa)) but same c0 (5% w/w). Black line is the calibration curve (fit in g) for c0 = 5% w/w. CB (68%) is shown. Source data are provided as a Source Data file.
Fig. 3
Fig. 3. Pressure equilibration timescales of double emulsion droplets.
a Sketch showing a double emulsion droplet of initial inner pressure ΠI0 and volume VI0 (or radius RI0) and initial oil volume Voil, reducing its volume to the equilibrium values over a timescale τR. b Inner droplet volume relaxation (normalized to the initial volume VI0) for double emulsion droplets of different initial sizes: RI0 = 37.9 ± 0.7 µm (green, N = 20); RI0 = 27.3 ± 0.4 µm (red, N = 20); RI0 = 20.9 ± 0.3 µm (blue, N = 47). Initial PEG concentration (5% w/w) and fixed ΠE. Mean ± SD (represented by an error band). Black lines are exponential fits to the data (Methods). cf, Dependence of the measured equilibrium relaxation timescale, τR, on the initial inner droplet size, RI0 (c initial PEG concentration (5% w/w) and fixed ΠE; N = 20 (green), 20 (red), 47 (blue) droplets), the initial internal pressure, ΠI0 (d fixed RI0 and ΠE, N = 13 (5% w/w),18 (10% w/w), and 20 (20% w/w) droplets), the externally imposed osmolarity, ΠE (e initial PEG concentration (5% w/w) and fixed RI0, N = 11 (0.25 MPa), 15 (0.5 MPa), 12 (0.75 MPa), 14 (1.5 MPa) and 16 (5.0 MPa) droplets), and the initial oil volume fraction, Voil0/VT0 (f initial PEG concentration (10% w/w), fixed RI0 and ΠE; N = 10 droplets), with VT0 being the initial total droplet volume. Inset in (f) shows z-x imaging plane of a droplet relaxing to the equilibrium state (fluorocarbon oil, cyan; fluorescent PEG, purple). Continuous blue lines in d and e are fits to the data with the form: y=axb+c. Scale bar, 25 µm. Mean ± SD for ce. Mean ± error from exponential fit for f. Source data are provided as a Source Data file.
Fig. 4
Fig. 4. In vivo and in situ measurements of osmotic pressure in blastomeres and in the interstitial fluid of zebrafish embryos.
a Confocal section of a Tg(actb2: mem-NeonGreen)hm37 zebrafish embryo transitioning from the 2- to 4-cell stage (membranes, yellow) with a droplet (fluorescent PEG in inner droplet, purple; fluorocarbon oil, cyan) located in one of the blastomeres (cells). bb’, Close ups of the droplet in a. c Top panels: Confocal images of a droplet inside a cell of a developing zebrafish embryo at different developmental stages. Bottom panels: close ups of the droplet at each stage. d Representative example of measured time evolution of the intracellular osmotic pressure in a developing zebrafish embryo. N = 1. Mean ± measurement error bands (obtained by error propagation from calibration curve Fig. 2g) for d, f. e Timelapse of a zebrafish embryo in 2% w/w SDS solution imaged in an inverted microscope (transmitted light) and sustained on a porous membrane (Methods). f Representative time evolution of the osmotic pressure during SDS treatment (2% w/w SDS). N = 1. Insets show inner droplet equatorial confocal sections at different timepoints. g Confocal section of a zebrafish embryo blastula at sphere stage (4 hpf; same color code as in a) with a droplet inserted in the interstitial fluid between the cells. h Close up showing the equatorial confocal section of the droplet in g. i Schematic representation of the droplet in between adhering cells and the presence of osmolytes in the interstitial fluid. j Measured osmotic pressure inside blastomeres, between the cells (interstitial fluid) of the zebrafish blastula and after SDS treatment. N = 18, 20 and 10 droplets (1 droplet per embryo), respectively. Osmotic pressure of E3 buffer (embryo medium) with (violet line) and without (blue line) 2% w/w SDS, measured with a commercial osmometer (Methods). k Measured osmotic pressure variation (SD) of temporal readings in individual embryo (SD of temporal readings; N = 1) and across the different embryos (SD; N = 6). Boxplot show Median, 25th and 75th percentiles, whiskers extend to extreme data points. Source data are provided as a Source Data file.

Similar articles

Cited by

References

    1. Lecuit T, Lenne PF. Cell surface mechanics and the control of cell shape, tissue patterns and morphogenesis. Nat. Rev. Mol. Cell Biol. 2007;8:633–644. doi: 10.1038/nrm2222. - DOI - PubMed
    1. Guillot C, Lecuit T. Mechanics of epithelial tissue homeostasis and morphogenesis. Science. 2013;340:1185–1189. doi: 10.1126/science.1235249. - DOI - PubMed
    1. Nelson CM, Gleghorn JP. Sculpting organs: mechanical regulation of tissue development. Annu Rev. Biomed. Eng. 2012;14:129–154. doi: 10.1146/annurev-bioeng-071811-150043. - DOI - PubMed
    1. Wozniak MA, Chen CS. Mechanotransduction in development: a growing role for contractility. Nat. Rev. Mol. Cell Biol. 2009;10:34–43. doi: 10.1038/nrm2592. - DOI - PMC - PubMed
    1. Fletcher DA, Mullins RD. Cell mechanics and the cytoskeleton. Nature. 2010;463:485–492. doi: 10.1038/nature08908. - DOI - PMC - PubMed

Publication types