. 2024 Jan 1;35(1):ar4.
doi: 10.1091/mbc.E22-11-0520. Epub 2023 Nov 1.

Septins modulate the autophagy response after nutrient starvation

Affiliations

Septins modulate the autophagy response after nutrient starvation

Luis Perucho-Jaimes et al. Mol Biol Cell. .

Abstract

The pathways that induce macroautophagy (referred to as autophagy hereafter) in response to the stress of starvation are well conserved and essential under nutrient-limiting conditions. However, less is understood about the mechanisms that modulate the autophagy response. Here we present evidence that after induction of autophagy in budding yeast septin filaments rapidly assemble into discrete patches distributed along the cell cortex. These patches gradually mature over 12 h of nutrient deprivation to form extended structures around Atg9 membranes tethered at the cortical endoplasmic reticulum, a class of membranes that are limiting for autophagosome biogenesis. Loss of cortical septin structures alters the kinetics of autophagy activation and most dramatically extends the duration of the autophagy response. In wild-type cells, diffusion of Atg9 membranes at the cell cortex undergoes transient pauses that are dependent on septins, and septins at the bud neck block the diffusion of Atg9 membranes between mother and daughter cells. We conclude that septins reorganize at the cell cortex during autophagy to locally limit access of Atg9 membranes to autophagosome assembly sites, and thus modulate the autophagy response during nutrient deprivation.


Figures
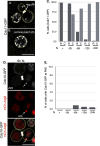
FIGURE 1:
FIGURE 1:
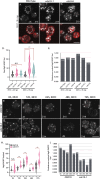
Septins form cortical patches during nutrient-deprivation. Cells expressing septin subunit GFP fusions were imaged after switching from complete medium to nutrient-limiting medium and processed as described in Materials and Methods. (A) A cell expressing Cdc10-GFP after 2 h nutrient-deprivation; arrow indicates a septin ring (R) at the bud neck and arrowheads indicate low-intensity cortical septin patches. (B) A cell after 6 h of nutrient-deprivation; arrowheads indicate high-intensity cortical septin patches. (C) Septin organization was classified in cells under the indicated growth conditions as “rings” (at the bud neck) or cortical patches (n > 150 cells for each time point). (D) Cells expressing Cdc10-GFP and mCh-Atg8 were imaged after 6 h of nutrient-deprivation and an example image of a cell with Cdc10-GFP overlapping with an mCh-Atg8 PAS structure (arrow). (E) Septin localization at PAS was quantified as a percentage of cells (n > 150 cells) at the indicated time points after nutrient deprivation (N-). Circles in images represent the cell outline from unprocessed images. Scale bars = 5 µm.
FIGURE 2:
FIGURE 2:
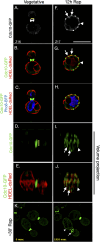
Septin cortical patches form “bars” that interdigitate with ER membranes after rapamycin treatment. Images were collected from cells growing in nutrient-rich medium (vegetative) or after treatment with rapamycin for 12 h and processed as described in Materials and Methods. (A) An example of Cdc10-GFP (gray) localization in a medium-budded cell (yellow line indicates the division plane) from a single Z-slice in the middle of the cell. (B) The same cell shown with an overlay of Cdc10-GFP (green) and HDEL-dsRed (red; to mark the ER) and in (C) an overlay of the same cell that includes BFP-Pho8 (blue; to mark the vacuole). A projected volume of the same cell was rotated 90 degrees to the right and then around the X axis to show (D) septins (Cdc10-GFP, green) and septins overlaid with (E) HDEL-dsRed (yellow line indicates division plane). (F–J) An example of a cell with images organized as in (A–E) but 12 h after rapamycin treatment and the volume projection only rotated around the X axis. Arrows and arrowhead indicate the cortical patches in a single Z (F and G) and the fluorescence signal in the projected volume after rotation (I and J). (K) Selected time-lapse images from movie 2 (Supplemental Movie 2; Supplemental Figure S2A; the 0 m/s time stamps is the first frame of the movie) that was created from a maximum Z projection; time-lapse images were collected ∼30 min after rapamycin treatment. The arrow indicates septin ring reoriented and migrating along the cell cortex. The arrowheads indicate a low intensity cortical septin patch.
FIGURE 3:
FIGURE 3:
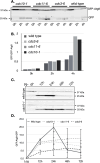
Kinetics of autophagic flux after nutrient deprivation in wild-type and septin mutants. (A) Wild-type, cdc10-1, cdc11-6, or cdc3-6 cells were grown to log phase at 25°C and then shifted to nutrient-limiting medium and 37°C for 2 and 4 h. Cells were harvested and proteins extracted for Western blot analysis using an anti-GFP antibody. (B) The GFP fragment and full-length GFP-Atg8 were quantified and expressed as a ratio (GFP:GFP-Atg8). (C) Western blot of autophagic flux from wild-type and cdc10-1 cells grown to log phase and then shifted to nutrient-limiting medium and 30°C for the indicated times and analyzed by Western blot. (D) GFP:GFP-Atg8 ratios were determined by quantifying Western blot signals from three separate experiments using wild-type, cdc10-1, cdc11-6, and cdc3-6 cells. Error bars represent SD between experiments.
FIGURE 4:
FIGURE 4:
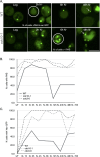
Quantification of GFP-Atg8 in PAS formation and vacuolar trafficking in wild-type and septin mutants after nutrient deprivation. (A) Representative images of wild-type (WT) or cdc10-1 cells expressing GFP-Atg8 from its native promoter in vegetatively grown cells (log) and after nutrient deprivation for the indicated times. The labeled circles highlight the categories of GFP-Atg8 localization that were quantified: percentage of cells with PAS and vacuolar GFP; percentage of cells with more than one PAS (Supplemental Figure S4A). The arrows highlight the different size PAS that form at late time points in wild-type and cdc10-1. (B) The percentage of cells with GFP-Atg8 labeled PAS was quantified for wild-type, cdc3-6 and cdc10-1 cells grown in nutrient-rich medium or under nutrient deprivation conditions for the times indicated (100–150 cells counted for each time point). (C) The percentage of cells vacuolar GFP signal as a sign of flux (see text) as quantified in (B). Vacuolar staining provided in Supplemental Figure S3. Scale bar = 5 µm
FIGURE 5:
FIGURE 5:
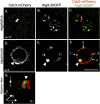
Juxtaposition of cortical septin patches and Atg9 membranes tethered to the ER cortex. Cells coexpressing Cdc3-mCherry (Cdc3-mCh [red]) and Atg9-3XGFP (green) were grown vegetatively and a single Z-slice through the middle of the cell is presented to show (A) Cdc3-mCh at the bud neck, (B) Atg9-3XGFP positioned at cortical and internal ER membrane tubules, and (C) an overlay of Cdc3-mCh (red) and Atg9-3XGFP (green; arrow indicates an Atg9-3XGFP vesicle localized near the bud neck septins). The same strain was treated with rapamycin for 6 h and images are presented as above. (D) A single Z-slice through the middle of the cell highlights Cdc3-mCh organized into cortical patches and (E) Atg9-3XGFP tethered near cortical ER membranes and (F) the overlay; the numbers indicate smaller Atg9-3XGFP foci at the cortex. The brackets in D and E indicate the region where Atg9-3XGFP membranes are observed near septin patches. The arrowhead indicates an example of a larger Atg9-3XGFP focus. (G) A volume projection of the rapamycin-treated cell in (D–F) rotated (11 degrees) around the X axis; the “1” arrow indicates the position of cortical Atg9-3XGFP and the arrowhead indicates the position of the larger Atg9-3XGFP focus and both correspond to the labels in (F). Scale bar = 5 µm
FIGURE 6:
FIGURE 6:
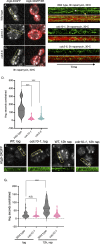
Atg9-3XGFP foci increase in number and become less enriched at the cortex in septin mutants. (A) Wild-type, (B) cdc10-1, and (C) cdc3-6 cells were grown to log phase and treated with rapamycin for 3 h. Cells were imaged and individual Z-slices in the middle of the cell are displayed for Atg9-3XGFP (top panels) and overlaid with HDEL-dsRed (bottom panels). Dashed circles indicate the demarcation between cortical Atg9 membranes and noncortical membranes (see Materials and Methods). (D) The total number of Atg9-3XGFP foci were quantified using the three-dimensional-Focipicker plugin in Image J (see Materials and Methods) and the data is presented in a violin plot for cells treated with rapamycin for 3 h and grown at either permissive temperature (25°C) or semipermissive temperature (30°C). Darker dashed lines represent the median seconds constrained and the lighter dashed lines represent the position of quartile values. The p values from a Welch unpaired t test are represented as follows: NS - p > 0.05; * - p < 0.05; ** - p < 0.005; *** - p < 0.001. (E) The ratio of cortical Atg9-3XGFP foci:noncortical foci was determined for the data described in (D). (F) Wild-type and (G) cdc10-1 cells were grown to log phase (0 h time-point) and switched to nutrient-limiting conditions for the indicated time points and representative images from single Z-slices are presented. (H) The total number of Atg9-3XGFP foci was determined and analyzed as in (D) for wild-type and cdc10-1 cells. (I) The ratio of cortical Atg9-3XGFP foci:noncortical foci was determined for the cells described in (F) and (G). Scale bar = 5 µm
FIGURE 7:
FIGURE 7:
Time-lapse movies of Atg9-3XGFP diffusion in wild-type and septin mutants. (A–C) The indicated strains were grown to log phase and treated with rapamycin for 3 h at 30°C. Atg9-3XGFP and HDEL-dsRed were imagined in a single Z-slice at 780 ms/frame. Kymograph analysis was performed selectively on Atg9-3XGFP and HDEL-dsRed at the cortex of cells (see yellow boxes; 10–15 cells for each strain). Kymographs are displayed to show Atg9-3XGFP (green) and the overlay with HDEL-dsRed (red). Time 0 is at the left end of the kymograph and a total of 500 frames (390 s) are represented. The white arrow in the kymograph associated with (A) indicates a Atg9-3XGFP foci that begins a period of transient constraint (solid kymograph line to the right of the arrow). The yellow arrow indicates a Atg9-3XGFP foci that moves rapidly and randomly at the cortex. (D) The continuous lines for wild-type, cdc10-1, and cdc3-6 were measured and converted to seconds; the average time for all lines in multiple cells is graphed in a violin plot as the average time constrained. Darker dashed lines represent the median seconds constrained and the lighter dashed lines represent the position of quartile values. Time-lapse images were collected for wild-type and cdc10-1 cells E) grown in nutrient-rich conditions or (F) after 12 h of rapamycin treatment and (G) average duration of constrained Atg9-3XGFP foci were calculated and graphed as in (D). The p values from a Welch unpaired t test are represented as follows: NS - p > 0.05; * - p < 0.05; ** - p < 0.005; *** - p < 0.001.
FIGURE 8:
FIGURE 8:
FRAP of Atg9-3XGFP membrane diffusion at the bud neck in vegetatively growing cells. Wild-type cells (A) or cdc10-1 cells (B) expressing Atg9-3XGFP were grown at 30°C under nutrient-rich conditions. Cells were imaged at ∼80 ms increments in a single Z slice for 500 frames after photobleaching (see Materials and Methods) and representative images from the time lapse are shown before photobleaching (t = 0s and t = 1.1s), immediately after the photobleach (t = 1.2 s) and during the recovery period (t > 1.2s). The circles represent the position of the photobleaching. (C) The integrated intensities were measured using the ROI represented by the circles. The time point of the photobleach is indicated by the arrow. Signal from wild-type cells (green) is compared with signal from cdc10-1 cells (red) for similar time periods.
FIGURE 9:
FIGURE 9:
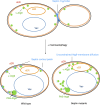
A model for septin-mediated Atg9 membrane diffusion regulation during prolonged nutrient deprivation: In vegetatively growing cells, septins (blue) form rings or collars at the bud neck; Atg9 membranes (green) are found primarily at the cortical ER (cER), presumably associated with ERES and are unable to diffuse past the septin ring/collar. After induction of autophagy, septins assemble into cortical patches at the junction between the plasma membrane (black line) and the cER where the transiently constrain Atg9-positive membrane diffusion thus limiting access to PAS and autophagosome biogenesis. Septin patches near PAS may also contribute to the efficiency of retrograde transport of Atg9-positive membranes. In septin mutants, cortical patches fail to form allowing less constrained diffusion of Atg9-positive membranes, increased access to PAS, and extended autophagosome biogenesis.

Similar articles

References

    1. Babour A, Bicknell AA, Tourtellotte J, Niwa M (2010). A surveillance pathway monitors the fitness of the endoplasmic reticulum to control its inheritance. Cell 142, 256–269. - PMC - PubMed
    1. Barve G, Sanyal P, Manjithaya R (2018a). Septin localization and function during autophagy. Curr Genet 64, 1037–1041. - PubMed
    1. Barve G, Sridhar S, Aher A, Sahani MH, Chinchwadkar S, Singh S, Lakshmeesha KN, McMurray MA, Manjithaya R (2018b). Septins are involved at the early stages of macroautophagy in S. cerevisiae. Journal Cell Sci 131, jcs209098. - PMC - PubMed
    1. Bertin A, McMurray MA, Grob P, Park S-S, Garcia G, Patanwala I, Ng H-L, Alber T, Thorner J, Nogales E (2008). Saccharomyces cerevisiae septins: supramolecular organization of heterooligomers and the mechanism of filament assembly. Proc Natl Acad Sci USA 105, 8274–8279. - PMC - PubMed
    1. Bertin A, McMurray MA, Thai L, Garcia G, Votin V, Grob P, Allyn T, Thorner J, Nogales E (2010). Phosphatidylinositol-4,5-bisphosphate promotes budding yeast septin filament assembly and organization. J Mol Biol 404, 711–731. - PMC - PubMed

MeSH terms