. 2023 Dec 4;222(12):e202301084.
doi: 10.1083/jcb.202301084. Epub 2023 Nov 1.

Axonal transport of autophagosomes is regulated by dynein activators JIP3/JIP4 and ARF/RAB GTPases

Affiliations

Axonal transport of autophagosomes is regulated by dynein activators JIP3/JIP4 and ARF/RAB GTPases

Sydney E Cason et al. J Cell Biol. .

Abstract

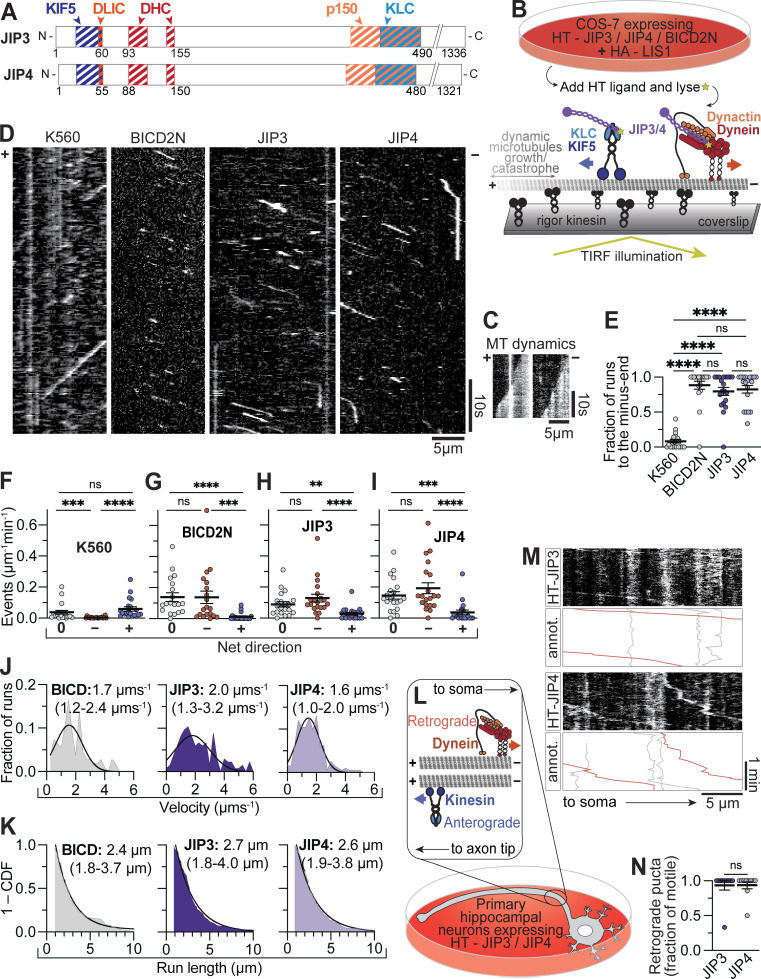
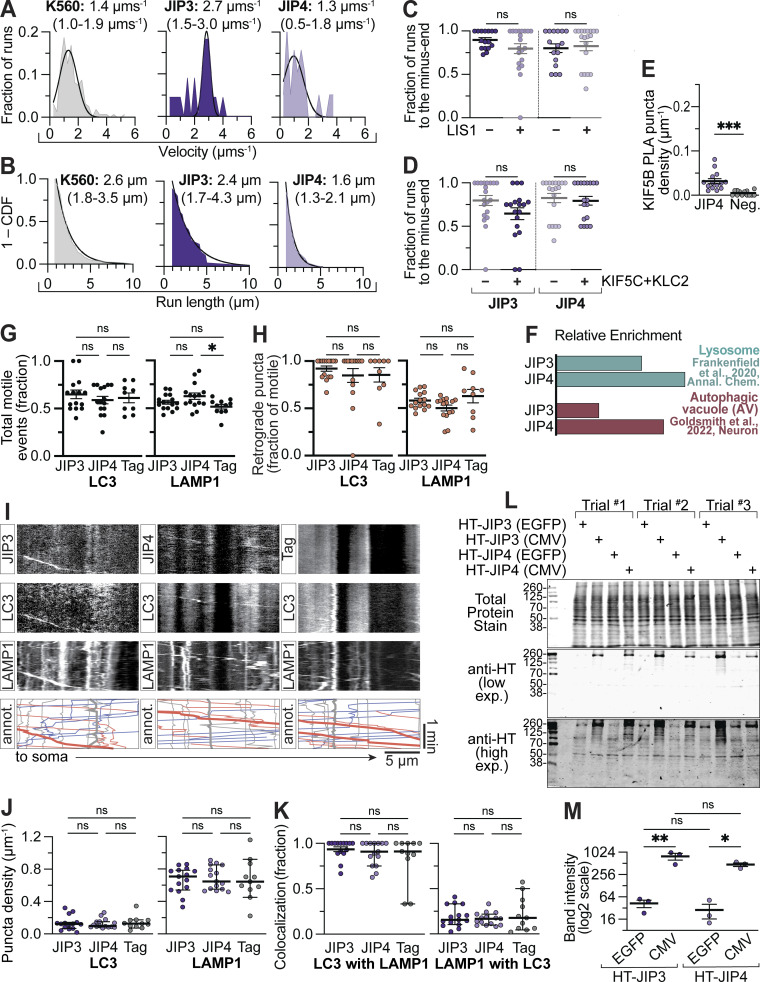
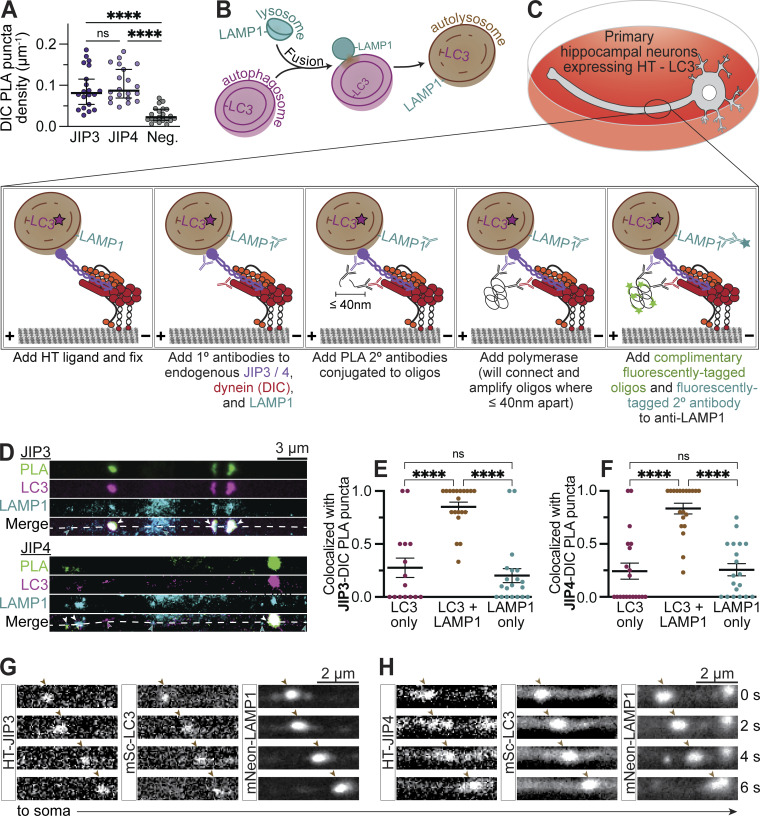
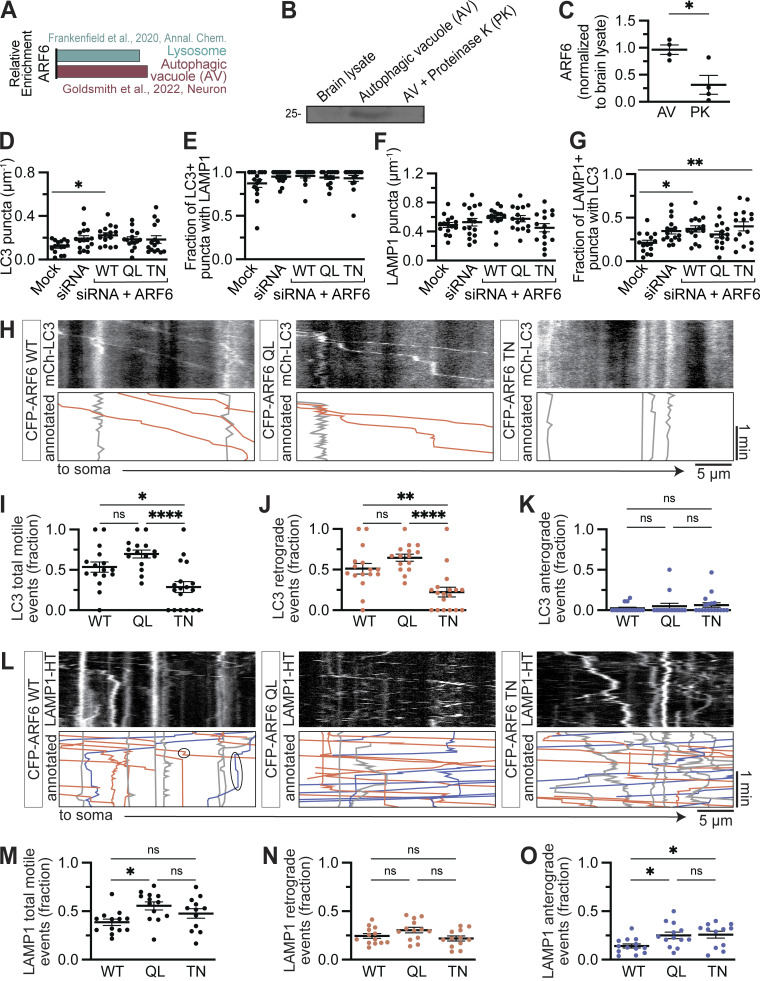
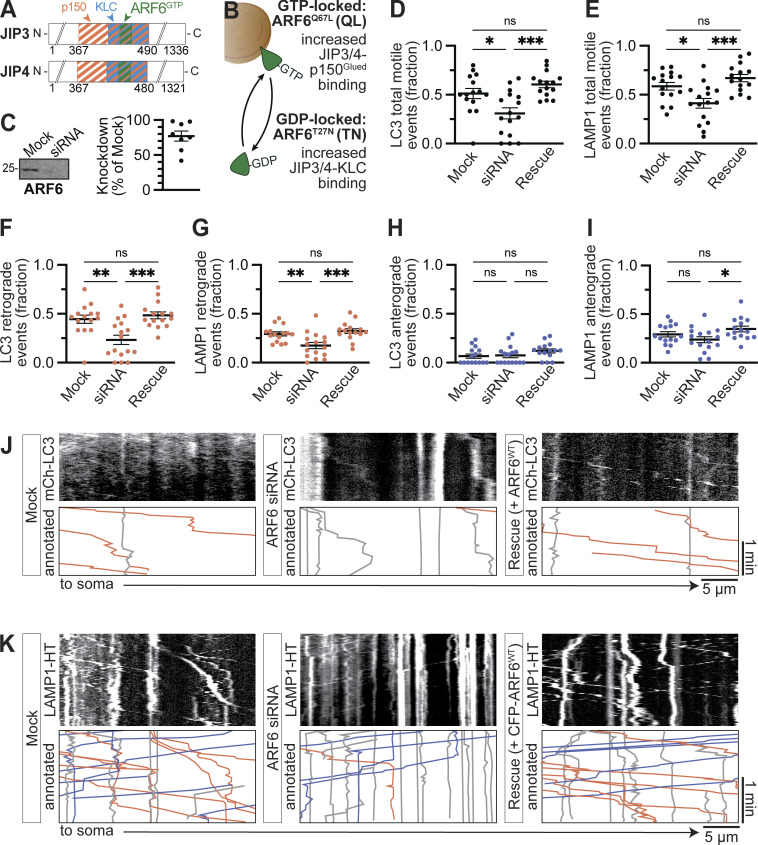
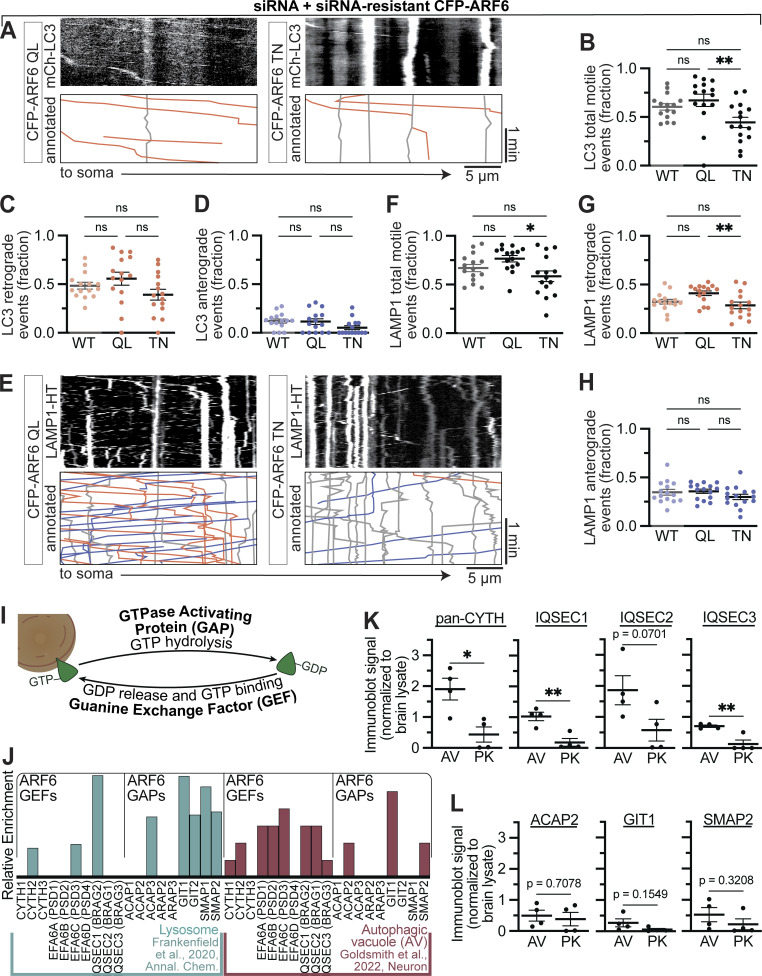
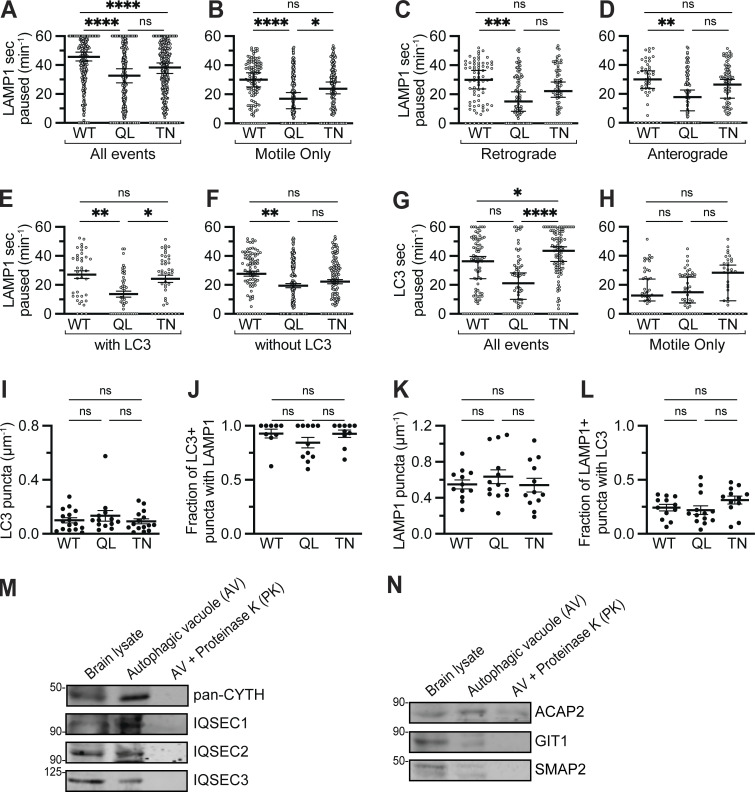
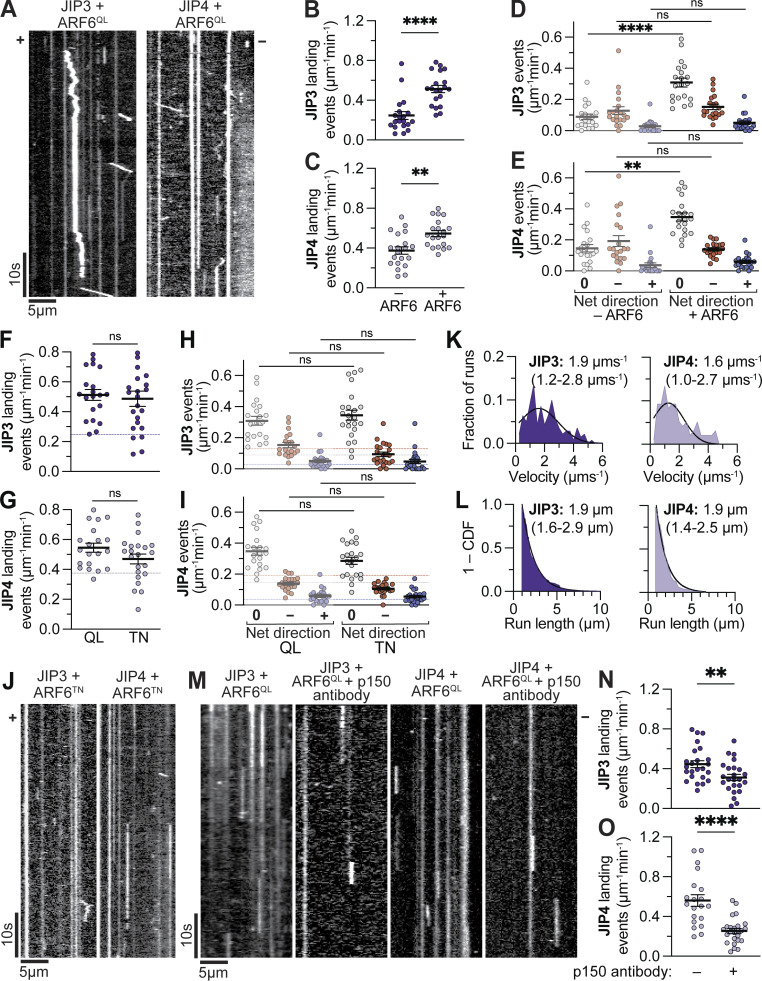
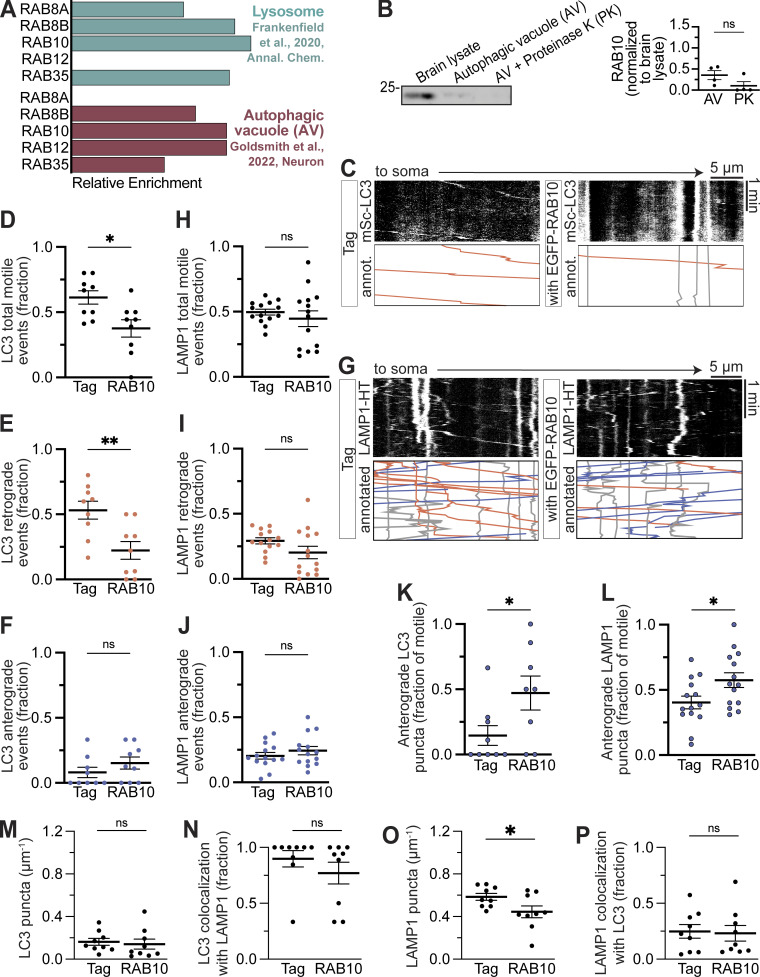
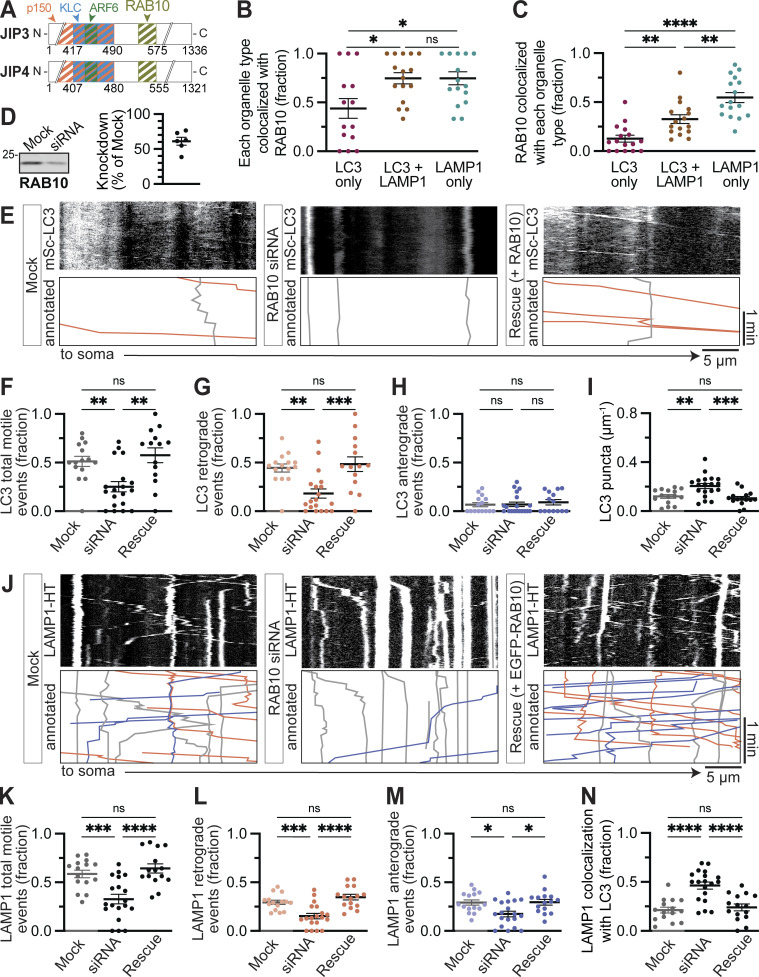
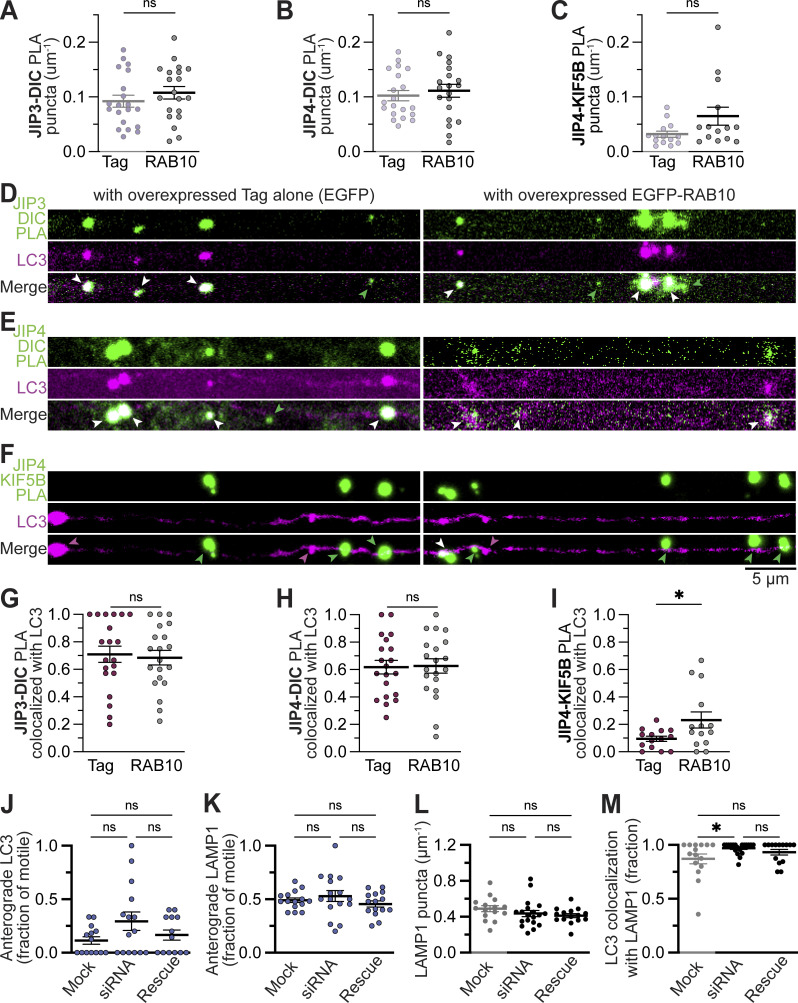
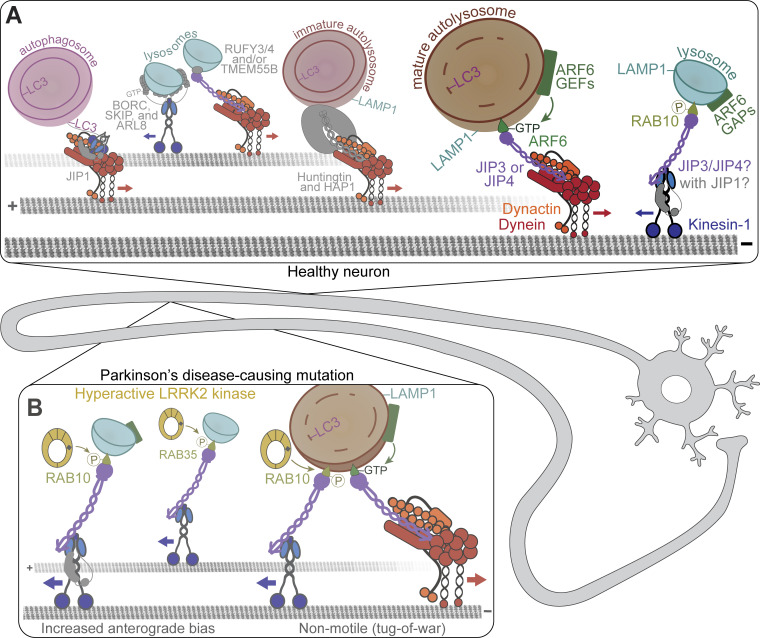
Neuronal autophagosomes form and engulf cargos at presynaptic sites in the axon and are then transported to the soma to recycle their cargo. Autophagic vacuoles (AVs) mature en route via fusion with lysosomes to become degradatively competent organelles; transport is driven by the microtubule motor protein cytoplasmic dynein, with motor activity regulated by a sequential series of adaptors. Using lysate-based single-molecule motility assays and live-cell imaging in primary neurons, we show that JNK-interacting proteins 3 (JIP3) and 4 (JIP4) are activating adaptors for dynein that are regulated on autophagosomes and lysosomes by the small GTPases ARF6 and RAB10. GTP-bound ARF6 promotes formation of the JIP3/4-dynein-dynactin complex. Either knockdown or overexpression of RAB10 stalls transport, suggesting that this GTPase is also required to coordinate the opposing activities of bound dynein and kinesin motors. These findings highlight the complex coordination of motor regulation during organelle transport in neurons.


Conflict of interest statement

Disclosures: The authors declare no competing interests exist.

Figures

Figure 1.
Figure 1.
JIP3 and JIP4 induce dynein activity in vitro and in cells. (A) Interaction sites for motor proteins mapped within the N-terminal regions of JIP3 and JIP4. KIF5, kinesin-1 heavy chain; DLIC, dynein light intermediate chain; DHC, dynein heavy chain; p150, dynactin p150Glued subunit; KLC, kinesin light chain. (B) Schematic illustrating our single-molecule motility assay. (C) Example kymographs showing the growth and catastrophe dynamics used to differentiate the plus-end of the MT from the more stable minus-end. (D) Example kymographs showing the activity of motor complexes. Time is represented along the y axis from top to bottom; distance is represented along the x axis with the MT plus-end on the left and the MT minus-end on the right. The two positive controls (1–560 construct of KIF5B; 1–572 of BICD2) were C-terminally (HT; JIP3 and JIP4 were N-terminally HT (CMV vector; see Fig. S1, I–M). (E) Quantification of the directionality of runs on each MT. Runs were defined as events ≥0.8 µm in length toward either the minus- or plus-end of the MT. Kruskal–Wallis test with Dunn’s multiple comparisons. n = 19–20 MT each. K560 versus BICD2N/JIP3/JIP4, P < 0.0001; BICD2N versus JIP3/JIP4, P > 0.9999; JIP3 versus JIP4, P > 0.9999. (F–I) Number of events (per micron per minute) for K560-, BICD2N-, JIP3-, or JIP4-containing complexes. Events with a net direction of “0” were stationary landing events (≥0.8 s duration with <0.8 µm net displacement), while complexes with a net direction of “−” or “+” moved ≥0.8 µm toward the minus- or plus-end of the MT, respectively. n = 19–20 MT each; Kruskal–Wallis test with Dunn’s multiple comparisons: K560 (0 versus −, P = 0.0004; 0 versus +, P = 0.3092; − versus +, P < 0.0001); BICD2N (0 versus −, P > 0.9999; 0 versus +, P < 0.0001; − versus +, P = 0.0003); JIP3 (0 versus −, P = 0.6412; 0 versus +, P = 0.0051; − versus +, P < 0.0001); JIP4 (0 versus −, P > 0.9999; 0 versus +, P = 0.0004; − versus +, P < 0.0001). (J and K) Distributions of velocities and run lengths observed for minus-end runs of BICD2N-, JIP3-, or JIP4-containing complexes. Velocity histograms were fit to a Gaussian curve and run lengths (1—cumulative distribution frequency) were fit to a one-phase decay. The listed values are medians (25th percentile–75th percentile). n = 109–192 events. (L) Schematic illustrating axonal motility. All live-cell data presented in this paper are from the proximal axon (closest 200 µm of axon to the soma) of primary rat hippocampal neurons at 9–12 DIV. (M) Example kymographs from the proximal axons of neurons transfected with HT-JIP3 or JIP4 (EGFP vector; see Fig. S1, I–M). Annotated kymographs (annot.) mirror the above kymographs with the JIP3/4+ puncta paths pseudocolored for visualization (gray, events moving <10 µm during the 2-min video; orange, retrograde events). (N) Fraction of motile (moving ≥10 µm during the 2-min video) puncta moving retrograde (towards the soma). n = 10 neurons; unpaired t test (P = 0.9776). Bars represent mean ± SEM. ns, not significant; **, P < 0.01; ***, P < 0.001; ****, P < 0.0001.
Figure S1.
Figure S1.
JIP3 and JIP4 do not induce kinesin activity in vitro. (A and B) Graphical representations of the distributions of velocities and run lengths to the plus-end for K560-, JIP3-, or JIP4-containing complexes. Velocity (histogram) was fit to a Gaussian curve and run length (1—cumulative distribution frequency) was fit to a one-phase decay. Listed values are median (25th percentile–75th percentile). JIP3/JIP4, n = 19–22 events; K560, n = 160 events. (C and D) Quantification of the directionality of runs on each MT in the absence of HA-LIS1 or the presence of GFP-KLC2 and KIF5C-HT (unlabeled). Runs were defined as events ≥0.8 µm in length toward either the minus- or plus-end of the MT. Note that the +LIS1 and −KIF5C & KLC2 are repeated from Fig. 1 (lighter color). n = 16–20 MTs each; Kruskal–Wallis test with Dunn’s multiple comparisons. LIS1: JIP3, P > 0.9999; JIP4, P > 0.9999. KIF5&KLC: JIP3, P = 0.3572; JIP4, P > 0.9999. (E) Quantification of KIF5B PLA puncta either with JIP4 or no second 1° antibody (Neg., negative control). n = 13–14 neurons; unpaired t test; P = 0.0001. (F) Relative enrichment (normalized, see Materials and methods for details) for JIP3 (Mapk8ip3) and JIP4 (Spag9) in the proteomics performed by Frankenfield et al. (2020) and Goldsmith et al. (2022). JIP3 or JIP4 overexpression does not affect AV or lysosome transport. (G) Fraction of LC3 or LAMP1 puncta moving ≥10 µm net displacement over a 2-min video (either direction) in the axons of neurons expressing HT alone (Tag), HT-JIP3, or HT-JIP4 (both in the EGFP construct). n = 9–15 neurons; one-way ANOVA with Tukey’s multiple comparisons test. LC3: JIP3 versus JIP4, P = 0.5772; JIP3 versus Tag, P = 0.8531; JIP4 versus. Tag, P = 0.9405. LAMP1: JIP3 versus JIP4, P = 0.2211; JIP3 versus Tag, P = 0.4933; JIP4 versus Tag, P = 0.0271. (H) Within the motile fraction, the proportion moving toward the soma (excludes events with net displacement <10 µm). n = 9–15 neurons; one-way ANOVA with Tukey’s multiple comparisons test. LC3: JIP3 versus JIP4, P = 0.6230; JIP3 versus Tag, P = 0.7417; JIP4 versus Tag, P = 0.9974. LAMP1: JIP3 versus JIP4, P = 0.2636; JIP3 versus Tag, P = 0.7083; JIP4 versus Tag, P = 0.0901. (I) Example kymographs showing LC3 and LAMP1 motility in the axons of neurons expressing HT alone, HT-JIP3, or HT-JIP4 (EGFP construct). Annotated kymographs (annot.) show paths pseudocolored for visualization: gray, net displacement <10 µm; blue, anterograde (toward tip); orange, retrograde (toward soma); heavier weight lines represent paths with both LC3 and LAMP1 comigrating. (J) Linear density along the axon of LC3 and LAMP1 puncta in cells expressing HT-JIP3, HT-JIP4, or Tag. n = 11–15 neurons; one-way ANOVA with Tukey’s multiple comparisons test. LC3: JIP3 versus JIP4, P = 0.9677; JIP3 versus Tag, P = 0.9752; JIP4 versus Tag, P = 0.8998. LAMP1: JIP3 versus JIP4, P = 0.9353; JIP3 versus Tag, P = 0.9931; JIP4 versus Tag, P = 0.9764. (K) Colocalization between LC3 and LAMP1 puncta in cells expressing HT-JIP3, HT-JIP4, or Tag. n = 11–15 neurons; one-way ANOVA with Tukey’s multiple comparisons test. LC3 with LAMP1: JIP3 versus JIP4, P = 0.7044; JIP3 versus Tag, P = 0.2845; JIP4 versus Tag, P = 0.7043. LAMP1 with LC3: JIP3 versus JIP4, P = 0.8502; JIP3 versus Tag, P = 0.8269; JIP4 versus Tag, P = 0.5265. (L and M) Western blot and quantification demonstrating that HT-JIP3 or JIP4 in the CMV backbone expresses far more highly than in the EGFP backbone (EGFP sequence has been removed by subcloning). This experiment was performed using COS-7 cells, which we transfected at the same confluence (∼50%) with FuGene 6 and equal DNA quantities. After lysis in radioimmunoprecipitation assay buffer, we assessed for protein concentration using bicinchoninic acid (BCA) assay. Equal protein concentrations were loaded, which was confirmed using revert total protein stain. Finally, a monoclonal HT antibody was used to assess expression of the HT proteins. n = 3; one-way ANOVA with Sidak’s multiple comparisons test (JIP3 EGFP versus JIP3 CMV, P = 0.0051; JIP4 EGFP versus JIP4 CMV, P = 0.0444; JIP3 EGFP versus JIP4 EGFP, P = 0.9118; JIP3 CMV versus JIP4 CMV, P = 0.0857). Bars represent mean ± SEM. ns, not significant; *, P < 0.05; **, P < 0.01; ***, P < 0.001. Source data are available for this figure: SourceData FS1.
Figure 2.
Figure 2.
JIP3 and JIP4 interact with dynein on autolysosomes. (A) Quantification of PLA (detects two proteins within 40 nm of one another) between endogenous dynein (DIC) and endogenous JIP3 or JIP4. Negative control (Neg.) is missing one primary antibody. n = 20–21 neurons; one-way ANOVA with Tukey’s multiple comparisons test (JIP3 versus JIP4, P = 0.6763; JIP3 versus Neg., P < 0.0001; JIP4 versus Neg., P < 0.0001). (B) Schematic illustrating the formation of autolysosomes via fusion between an LC3+ AV and a LAMP1+ lysosome. (C) Schematic illustrating our PLA assay—probing for close apposition between endogenous DIC and endogenous JIP3 or JIP4—alongside colocalization with exogenously expressed HT-LC3 and endogenous LAMP1. (D–F) Example micrographs and quantifications showing colocalization between LC3, LAMP1, and JIP3-DIC or JIP4-DIC PLA puncta. n = 20 neurons; one-way ANOVA with Tukey’s multiple comparisons test; JIP3 (LC3 versus LC3 + LAMP1, P < 0.0001; LC3 versus LAMP1, P = 0.7236; LAMP1 versus LC3 + LAMP1, P < 0.0001); JIP4 (LC3 versus LC3 + LAMP1, P < 0.0001; LC3 versus LAMP1, P = 0.9879; LAMP1 versus LC3 + LAMP1, P < 0.0001). (G and H) Time series demonstrating JIP3 and JIP4 comigration with LC3 and LAMP1 in axons. Bars represent mean ± SEM. ns, not significant; ****, P < 0.0001.
Figure S2.
Figure S2.
GDP-locked ARF6 has a strong dominant negative effect on LC3 puncta retrograde motility. (A) Relative enrichment (normalized, see Materials and methods for details) for ARF6 in the proteomics performed by Goldsmith et al. (2022) and Frankenfield et al. (2020). (B) Example Western blot showing ARF6 in the AV-enriched fraction. Samples were prepared by differential centrifugation as in Goldsmith et al. (2022). Equal protein concentrations were loaded in each line, as determined by BCA. AV fraction treated with PK removes any externally associated proteins, leaving only cargo inside the organelle; thus, proteins that regulate AV motility should be in the AV fraction but absent from the PK fraction. (C) Quantification of ARF6 in the AV-enriched fraction. n = 4 preparations; unpaired t test; P = 0.0159. (D–G) Puncta density and colocalization upon ARF6 knockdown and rescue with different CFP-ARF6 constructs. n = 15–16 neurons; one-way ANOVA with Tukey’s multiple comparisons test; only significant comparisons displayed in the figure for ease of visualization. (D) Mock versus siRNA, P = 0.2547; Mock versus WT, P = 0.0431; Mock versus QL, P = 0.3714; Mock versus TN, P = 0.4402; siRNA versus WT, P = 0.9918; siRNA versus QL, P = 0.9996; siRNA versus TN, P = 0.9991; WT versus QL, P = 0.8363; WT versus TN, P = 0.8114; QL versus TN, P > 0.9999. (E) Mock versus siRNA, P = 0.3494; Mock versus WT, P = 0.2581; Mock versus QL, P = 0.5130; Mock versus TN, P = 0.6418; siRNA versus WT, P = 0.9995; siRNA versus QL, P = 0.9991; siRNA versus TN, P = 0.9910; WT versus QL, P = 0.9909; WT versus TN, P = 0.9644; QL versus TN, P = 0.9996. (F) Mock versus siRNA, P = 0.9692; Mock versus WT, P = 0.5138; Mock versus QL, P = 0.6603; Mock versus TN, P = 0.9784; siRNA versus WT, P = 0.8660; siRNA versus QL, P = 0.9464; siRNA versus TN, P = 0.7417; WT versus QL, P = 0.9994; WT versus TN, P = 0.2085; QL versus TN, P = 0.3134. (G) Mock versus siRNA, P = 0.0989; Mock versus WT, P = 0.0363; Mock versus QL, P = 0.4198; Mock versus TN, P = 0.0075; siRNA versus WT, P = 0.9909; siRNA versus QL, P = 0.9432; siRNA versus TN, P = 0.8460; WT versus QL, P = 0.7579; WT versus TN, P = 0.9811; QL versus TN, P = 0.4149. (H) Example kymographs of mCh-LC3 upon overexpression of CFP-ARF6WT (WT), ARF6QL, or ARF6TN. Annotated kymographs show paths pseudocolored for visualization: gray, net displacement <10 µm; blue, anterograde (toward tip); orange, retrograde (toward soma). (I) Fraction of LC3 puncta moving ≥10 µm net displacement over a 2-min video (either direction). n = 15–18 neurons; one-way ANOVA with Tukey’s multiple comparisons test. WT versus QL, P = 0.1825; WT versus TN, P = 0.0163; QL versus TN, P < 0.0001. (J and K) Retrograde and anterograde fractions represent retrograde runs (≥10 µm net displacement toward the soma) or anterograde runs (≥10 µm net displacement toward the axon tip) over all events (including those that moved <10 µm). n = 15–18 neurons; one-way ANOVA with Tukey’s multiple comparisons test. (J) WT versus QL, P = 0.2578; WT versus TN, P = 0.0024; QL versus TN, P < 0.0001. (K) WT versus QL, P = 0.7820; WT versus TN, P = 0.5349; QL versus TN, P = 0.9287. (L) Example kymographs of LAMP1-HT upon overexpression of CFP-ARF6WT, ARF6QL, or ARF6TN. (M) Fraction of LAMP1 puncta moving ≥10 µm net displacement over a 2-min video (either direction). n = 12–13 neurons; one-way ANOVA with Tukey’s multiple comparisons test. WT versus QL, P = 0.0168; WT versus TN, P = 0.2927; QL versus TN, P = 0.3892. (N and O) Retrograde and anterograde fractions represent retrograde runs (≥10 µm net displacement toward the soma) or anterograde runs (≥10 µm net displacement toward the axon tip) over all events (including those that moved <10 µm). n = 12–13 neurons; one-way ANOVA with Tukey’s multiple comparisons test. (N) WT versus QL, P = 0.2464; WT versus TN, P = 0.7710; QL versus TN, P = 0.0709. (O) WT versus QL, P = 0.0401; WT versus TN, P = 0.0304; QL versus TN, P = 0.9841. Bars represent mean ± SEM. ns, not significant; *, P < 0.05; **, P < 0.01; ****, P < 0.0001. Source data are available for this figure: SourceData FS2.
Figure 3.
Figure 3.
ARF6 regulates AV and lysosome retrograde transport. (A) Schematic of the middle regions of JIP3 and JIP4 demonstrating interactions with ARF6. (B) Schematic illustrating the effects of GTP-locked ARF6Q97L and GDP-locked ARF6QL on JIP3/4 binding interactions as described by Montagnac et al. (2009). (C) Representative Western blot and quantification of ARF6 knockdown in rat neural cells (PC12). n = 8. Samples were normalized using Revert 700 Total Protein Stain (LI-COR). (D and E) Fraction of LC3 or LAMP1 puncta moving ≥10 µm net displacement over a 2-min video (either direction). Mock, cells treated alongside others but without any added siRNA. siRNA, cells treated with ARF6 siRNA. Rescue, cells treated with ARF6 siRNA and simultaneously transfected with siRNA-resistant CFP-ARF6WT. n = 15–16 neurons; one-way ANOVA with Tukey’s multiple comparisons test. LC3: Mock versus siRNA, P = 0.0132; Mock versus Rescue, P = 0.3770; siRNA versus Rescue, P = 0.0002. LAMP1: Mock versus siRNA, P = 0.0162; Mock versus Rescue, P = 0.3677; siRNA versus Rescue, P = 0.0003. (F and G) Fraction of retrograde runs (≥10 µm net displacement towards the soma) over all events (including those that moved <10 µm) for LC3 and LAMP1 puncta. n = 15–16 neurons; one-way ANOVA with Holm–Sidak’s multiple comparisons test. LC3: Mock versus siRNA, P = 0.0018; Mock versus Rescue, P = 0.5109; siRNA versus Rescue, P = 0.0003. LAMP1: Mock versus siRNA, P = 0.0050; Mock versus Rescue, P = 0.4563; siRNA versus Rescue, P = 0.0008. (H and I) Fraction of anterograde runs (≥10 µm net displacement toward the axon tip) over all events (including those that moved <10 µm) for LC3 and LAMP1 puncta. n = 15–16 neurons; one-way ANOVA with Holm–Sidak’s multiple comparisons test. LC3: Mock versus siRNA, P = 0.7950; Mock versus Rescue, P = 0.2677; siRNA versus Rescue, P = 0.2831. LAMP1: Mock versus siRNA, P = 0.3385; Mock versus Rescue, P = 0.3385; siRNA versus Rescue, P = 0.0300. (J and K) Example kymographs of mCherry (mCh)-LC3 and LAMP1-HT under control conditions (Mock), ARF6 knockdown, or rescue with CFP-ARF6WT. Annotated kymographs show paths pseudocolored for visualization: gray, net displacement <10 µm; blue, anterograde (towards tip); orange, retrograde (towards soma). Bars represent mean ± SEM. ns, not significant; *, P < 0.05; **, P < 0.01; ***, P < 0.001. Source data are available for this figure: SourceData F3.
Figure 4.
Figure 4.
Locally regulated ARF6 controls motility in a GTP-dependent fashion. (A) Example kymographs of mCh-LC3 upon knockdown and re-expression of GTP-locked (QL) or GDP-locked (TN) CFP-ARF6. Annotated kymographs show paths pseudocolored for visualization: gray, net displacement <10 µm; blue, anterograde (toward tip); orange, retrograde (toward soma). (B) Fraction of LC3 puncta moving ≥10 µm net displacement over a 2-min video (either direction). n = 15 neurons; one-way ANOVA with Tukey’s multiple comparisons test. WT versus QL, P = 0.6383; WT versus TN, P = 0.0803; QL versus TN, P = 0.0089. (C and D) Fraction of retrograde (≥10 µm net displacement toward the soma) or anterograde (≥10 µm net displacement toward the axon tip) LC3 runs over all events (including those that moved <10 µm). n = 15 neurons; one-way ANOVA with Holm–Sidak’s multiple comparisons test. Retrograde: WT versus QL, P = 0.4066; WT versus TN, P = 0.4066; QL versus TN, P = 0.1055. Anterograde: WT versus QL, P = 0.8656; WT versus TN, P = 0.1408; QL versus TN, P = 0.1408. (E) Example kymographs of LAMP1-HT upon knockdown and re-expression of GTP-locked (QL) or GDP-locked (TN) CFP-ARF6. (F) Fraction of LAMP1 puncta moving ≥10 µm net displacement over a 2-min video (either direction). n = 15 neurons; one-way ANOVA with Tukey’s multiple comparisons test. WT versus QL, P = 0.2550; WT versus TN, P = 0.3421; QL versus TN, P = 0.0117. (G and H) Fraction of retrograde (≥10 µm net displacement toward the soma) or anterograde (≥10 µm net displacement toward the axon tip) LAMP1 runs over all events (including those that moved <10 µm). n = 15 neurons; one-way ANOVA with Holm–Sidak’s multiple comparisons test. Retrograde: WT versus QL, P = 0.0641; WT versus TN, P = 0.3507; QL versus TN, P = 0.0089. Anterograde: WT versus QL, P = 0.8052; WT versus TN, P = 0.3739; QL versus TN, P = 0.3523. (I) Schematic illustrating the GTP hydrolysis cycle for small GTPases. (J) Relative enrichment (normalized, see Materials and methods for details) for ARF6 GEFs and GAPs in the proteomics performed by Goldsmith et al. (2022) and Frankenfield et al. (2020). (K and L) Quantification of ARF6 GEFs (K) and GAPs (L) in a mouse brain–derived AV-enriched fraction. Samples were prepared by differential centrifugation as in Goldsmith et al. (2022), and quantified by near-infrared Western blotting (Fig. S3, M and N). AV fraction treated with PK removes any externally associated proteins, leaving only cargo inside the organelle; thus, proteins that regulate AV motility should be in the AV fraction but absent from the PK fraction. n = 4 preparations; unpaired t test. pan-CYTH, P = 0.0139; IQSEC1, P = 0.0038; IQSEC3, P = 0.0050. Bars represent mean ± SEM. ns, not significant; *, P < 0.05; **, P < 0.01.
Figure S3.
Figure S3.
GTP-locked ARF6 decreases LAMP1 vesicle pausing time. (A–H) Number of seconds paused per min in each of the three overexpression conditions. Kruskal–Wallis tests with Dunn’s multiple comparisons. (A) All LAMP1 puncta (including those that moved <10 µm). n = 336–339 puncta; WT versus QL, P < 0.0001; WT versus TN, P < 0.0001; QL versus TN, P = 0.4472. (B) All LAMP1 puncta that moved ≥10 µm during a 2-min video. n = 119–183 puncta; WT versus QL, P < 0.0001; WT versus TN, P = 0.0592; QL versus TN, P = 0.0218. (C) LAMP1 puncta moving ≥10 µm toward the soma. n = 69–91 puncta; WT versus QL, P = 0.0003; WT versus TN, P = 0.1928; QL versus TN, P = 0.1802. (D) LAMP1 puncta moving ≥10 µm toward the axon tip. n = 45–94 puncta; WT versus QL, P = 0.0099; WT versus TN, P = 5223; QL versus TN, P = 0.1482. (E) Motile LAMP1 puncta (≥10 µm net displacement) comigrating with LC3 (autolysosomes). n = 38–46 puncta; WT versus QL, P = 0.0004; WT versus TN, P > 0.9999; QL versus TN, P = 0.0086. (F) Motile LAMP1 puncta (≥10 µm net displacement) migrating without LC3. n = 82–137 puncta; WT versus QL, P = 0.0011; WT versus TN, P = 0.0601; QL versus TN, P = 0.5535. (G) All LC3 puncta (including those that moved <10 µm). n = 71–111 puncta; WT versus QL, P = 0.1526; WT versus TN, P = 0.0327; QL versus TN, P < 0.0001. (H) All LC3 puncta that moved ≥10 µm during a 2-min video. n = 36–49 puncta; WT versus QL, P > 0.9999; WT versus TN, P = 0.3459; QL versus TN, P = 0.2893. (I–L) Puncta density and colocalization upon overexpression of different CFP-ARF6 constructs. n = 9–16 neurons; one-way ANOVA with Holm–Sidak’s multiple comparisons test. (I) WT versus QL, P = 0.6382; WT versus TN, P = 0.8339; QL versus TN, P = 0.6382. (J) WT versus QL, P = 0.4183; WT versus TN, P = 0.9791; QL versus TN, P = 0.4183. (K) WT versus QL, P = 0.7263; WT versus TN, P = 0.9368; QL versus TN, P = 0.7263. (L) WT versus QL, P = 0.6493; WT versus TN, P = 0.3369; QL versus TN, P = 0.2087. (M and N) Quantification of ARF6 GEFs (M) and GAPs (N) in a mouse brain–derived AV-enriched fraction. Samples were prepared by differential centrifugation as in Goldsmith et al. (2022). AV fraction treated with PK removes any externally associated proteins, leaving only cargo inside the organelle; thus, proteins that regulate AV motility should be in the AV fraction but absent from the PK fraction. Bars represent mean ± SEM. ns, not significant; *, P < 0.05; **, P < 0.01; ***, P < 0.001; ****, P < 0.0001. Source data are available for this figure: SourceData FS3.
Figure 5.
Figure 5.
ARF6 induces the recruitment of JIP3/4 to MTs. (A) Example kymographs showing the activity of JIP3- and JIP4-containing complexes in the presence of CFP-ARF6QL. (B and C) Quantification of the number of total landing events (includes runs and non-motile binding events) for JIP3- and JIP4-containing complexes in the presence or absence of CFP-ARF6QL. n = 20 MTs each; unpaired t test; JIP3, P < 0.0001; JIP4, P = 0.0011. (D and E) The number of events (per µm per min) observed for JIP3-containing and JIP4-containing complexes, either in the presence or absence of QL. Complexes with a net direction of “0” were stationary landing events, while complexes with a net direction of “−” or “+” moved ≥0.8 µm toward the minus- or plus-end of the MT, respectively. Note that the −ARF6 data (denoted in a lighter color) is repeated from Fig. 1, H and I. Kruskal–Wallis test with Dunn’s multiple comparisons. n = 20 MTs each. JIP3 −ARF6 versus +ARF6: 0, P < 0.0001; −, P > 0.9999; +, P > 0.9999. JIP4 −ARF6 versus +ARF6: 0, P = 0.0033; −, P > 0.9999; +, P > 0.9999. (F and G) Quantification of the number of total landing events for JIP3- and JIP4-containing complexes in the presence of CFP-ARF6QL or CFP-ARF6TN. Dashed line represents the average number of landing events in the absence of ARF6. Note that the QL data (lighter color) repeated from B and C for comparison. n = 20–23 MTs each; unpaired t test; JIP3, P = 0.6856; JIP4, P = 0.1028. (H and I) Number of events (per µm per min) observed for JIP3-containing and JIP4-containing complexes in the presence of CFP-ARF6QL or CFP-ARF6TN. Dashed lines represent the average number of events in the absence of ARF6. Note that the QL data (lighter color) is repeated from D and E for comparison. Kruskal–Wallis test with Dunn’s multiple comparisons. n = 20 MTs each. JIP3 −ARF6 versus +ARF6: 0, P > 0.9999; −, P = 0.9389; +, P > 0.9999. JIP4 −ARF6 versus +ARF6: 0, P > 0.9999; −, P > 0.9999; +, P > 0.9999. (J) Example kymographs showing the activity of JIP3- and JIP4-containing complexes in the presence of CFP-ARF6TN. (K and L) Graphical representations of the distributions of velocities and run lengths to the minus-end for JIP3- or JIP4-containing complexes in the presence of CFP-ARF6QL. Velocity (histogram) was fit to a Gaussian curve and run length (1—cumulative distribution frequency) was fit to a one-phase decay. The listed values are median (25th percentile–75th percentile). n = 97–140 events. (M) Example kymographs showing the activity of JIP3- and JIP4-containing complexes with CFP-ARF6QL and a function-blocking p150Glued (p150) antibody (disrupts p150-MT binding). (N and O) Quantification of the number of total landing events for JIP3- and JIP4-containing complexes with CFP-ARF6QL in the presence or absence of p150 antibody. n = 20–25 MT each; unpaired t test; JIP3, P = 0.0078; JIP4, P < 0.0001. Bars represent mean ± SEM. ns, not significant; **, P < 0.01; ****, P < 0.0001.
Figure S4.
Figure S4.
RAB10 overexpression induces an anterograde bias in AV and lysosome motility. (A) Relative enrichment (normalized, see Materials and methods for details) for RABs of interest in the proteomics performed by Goldsmith et al. (2022) and Frankenfield et al. (2020). (B) Example Western blot and quantification showing RAB10 in the AV fraction. n = 4 preparations; unpaired t test, P = 0.1308. (C) Example kymographs of mSc-LC3 under the expression of EGFP alone (Tag) or EGFP-RAB10. Annotated kymographs (annot.) show paths pseudocolored for visualization: gray, net displacement <10 µm; blue, anterograde (toward tip); orange, retrograde (toward soma). (D) Fraction of LC3 puncta moving ≥10 µm net displacement over a 2-min video (either direction). n = 8–9 neurons; unpaired t test; P = 0.0123. (E and F) Retrograde and anterograde fractions represent retrograde runs (≥10 µm net displacement toward the soma) or anterograde runs (≥10 µm net displacement toward the axon tip) over all events (including those that moved <10 µm). n = 9 neurons each; unpaired t test. (E) P = 0.0055. (F) P = 0.2524. (G) Example kymographs of LAMP1-HT under the expression of EGFP alone (Tag) or EGFP-RAB10. (H) Fraction of LAMP1 puncta moving ≥10 µm net displacement over a 2-min video (either direction). n = 14 neurons each; unpaired t test; P = 0.4435. (I and J) Retrograde and anterograde fractions represent retrograde runs (≥10 µm net displacement toward the soma) or anterograde runs (≥10 µm net displacement toward the axon tip) over all events (including those that moved <10 µm). n = 14 neurons each; unpaired t test. (I) P = 0.1040. (J) P = 0.3475. (K and L) Quantification of the fraction of motile (moving ≥10 µm during the 2-min video) LC3 or LAMP1 puncta moving anterograde (toward the soma). n = 8–9 neurons; unpaired t test. (K) P = 0.0422. (L) P = 0.0297. (M–P) Puncta density and colocalization upon RAB10 overexpression. n = 9 neurons each; unpaired t test. (M) P = 0.7068. (N) P = 0.3086. (O) P = 0.0438. (P) P = 0.8568. Bars represent mean ± SEM. ns, not significant; *, P < 0.05; **, P < 0.01. Source data are available for this figure: SourceData FS4.
Figure 6.
Figure 6.
RAB10 knockdown disrupts AV and lysosome motility. (A) Middle region of JIP3 and JIP4 illustrating putative interaction with RAB10. (B and C) Fraction of autophagosomes (HT-LC3 only), autolysosomes (LC3 + LAMP1), or lysosomes (endogenous LAMP1 only) in fixed cells colocalized with EGFP-RAB10. n = 14–16 neurons; one-way ANOVA with Tukey’s multiple comparisons test (LC3 versus LC3 + LAMP1, P = 0.0181; LC3 versus LAMP1, P = 0.0179; LAMP1 versus LC3 + LAMP1, P > 0.9999). (F) Of the EGFP-RAB10 that was colocalized with LC3 and/or LAMP1, a fraction colocalized with each organelle type. n = 14–16 neurons; one-way ANOVA with Tukey’s multiple comparisons test (LC3 versus LC3 + LAMP1, P = 0.0070; LC3 versus LAMP1, P < 0.0001; LAMP1 versus LC3 + LAMP1, P = 0.0030). (D) Example Western blot and quantification of RAB10 knockdown in rat neural cells (PC12). n = 6. Samples were normalized using Revert 700 Total Protein Stain (LI-COR). (E) Example kymographs of mCh-LC3 under control conditions, ARF6 knockdown, or rescue with CFP-ARF6WT. Annotated kymographs show paths pseudocolored for visualization: gray, net displacement <10 µm; blue, anterograde (toward tip); orange, retrograde (toward soma). (E) Example kymographs of mSc-LC3 under control conditions (Mock), RAB10 knockdown, or rescue with EGFP-RAB10. Annotated kymographs show paths pseudocolored for visualization: gray, net displacement <10 µm; blue, anterograde (toward tip); orange, retrograde (toward soma). (F) Fraction of LC3 puncta moving ≥10 µm net displacement over a 2-min video (either direction). n = 15–19 neurons; one-way ANOVA with Tukey’s multiple comparisons test. Mock versus siRNA, P = 0.0082; Mock versus Rescue, P = 0.7535; siRNA versus Rescue, P = 0.0011. (G and H) Fractions represent retrograde runs (≥10 µm net displacement toward the soma) or anterograde runs (≥10 µm net displacement toward the axon tip) over all events (including those that moved <10 µm). n = 14–19 neurons; one-way ANOVA with Holm–Sidak’s multiple comparisons test. Retrograde: Mock versus siRNA, P = 0.0023; Mock versus Rescue, P = 0.6347; siRNA versus Rescue, P = 0.0009. Anterograde: Mock versus siRNA, P = 0.0023; Mock versus Rescue, P = 0.6347; siRNA versus Rescue, P = 0.0009. (I) LC3 puncta density upon RAB10 knockdown and rescue. n = 15–19 neurons; one-way ANOVA with Tukey’s multiple comparisons test. Mock versus siRNA, P = 0.0038; Mock versus Rescue, P = 0.8336; siRNA versus Rescue, P = 0.0006. (J) Example kymographs of LAMP1-HT under control conditions (Mock), RAB10 knockdown, or rescue with EGFP-RAB10. (K) Fraction of LAMP1 puncta moving ≥10 µm net displacement over a 2-min video (either direction). n = 15–19 neurons; one-way ANOVA with Tukey’s multiple comparisons test. Mock versus siRNA, P = 0.0007; Mock versus Rescue, P = 0.6886; siRNA versus Rescue, P < 0.0001. (L and M) Retrograde and anterograde fractions represent retrograde runs (≥10 µm net displacement toward the soma) or anterograde runs (≥10 µm net displacement toward the axon tip) over all events (including those that moved <10 µm). n = 14–19 neurons; one-way ANOVA with Holm–Sidak’s multiple comparisons test. Retrograde: Mock versus siRNA, P = 0.0009; Mock versus Rescue, P = 0.1832; siRNA versus Rescue, P < 0.0001. Anterograde: Mock versus siRNA, P = 0.0126; Mock versus Rescue, P = 0.9455; siRNA versus Rescue, P = 0.0126. (N) LAMP1 colocalization with LC3 upon RAB10 knockdown and rescue. n = 15–19 neurons; one-way ANOVA with Tukey’s multiple comparisons test. Mock versus siRNA, P < 0.0001; Mock versus Rescue, P = 0.8367; siRNA versus Rescue, P < 0.0001. Note that mock data throughout the figure is repeated from Fig. 3, D–I, and Fig. S2, F–I (lighter color). Bars represent mean ± SEM. ns, not significant; *, P < 0.05; **, P < 0.01; ***, P < 0.001; ****, P < 0.0001. Source data are available for this figure: SourceData F6.
Figure S5.
Figure S5.
RAB10 promotes JIP–kinesin complex formation on AVs but does not impact JIP–dynein association. (A and B) Quantification of PLA along the axon between endogenous dynein (DIC) and endogenous JIP3 or JIP4 in cells expressing EGFP alone (Tag) or EGFP-RAB10. Note that Tag data is repeated from Fig. 2 A (lighter color). n = 20 neurons each; unpaired t test. (A) P = 0.3278. (B) P = 0.5541. (C) Quantification of PLA along the axon between endogenous kinesin (KIF5B) and endogenous JIP4 in cells expressing EGFP alone (Tag) or EGFP-RAB10. Note that Tag data is repeated from Fig. S1 E (lighter color). n = 14 neurons each; unpaired t test; P = 0.0690. (D–F) Example micrographs showing colocalization between HT-LC3 and JIP3-DIC, JIP4-DIC, or JIP4-KIF5B PLA puncta. (G–I) Fraction of PLA puncta colocalizing with HT-LC3 in cells expressing EGFP alone (Tag) or EGFP-RAB10. n = 20 neurons; unpaired t test. (G) P = 0.7565. (H) P = 0.9109. (I) P = 0.0350. (J and K) Quantification of the fraction of motile (moving ≥10 µm during the 2-min video) LC3 or LAMP1 puncta moving anterograde (toward the soma) upon RAB10 knockdown and rescue with EGFP-RAB10. n = 13–16 neurons; one-way ANOVA with Tukey’s multiple comparisons test. (J) Mock versus siRNA, P = 0.1069; Mock versus Rescue, P = 0.8370; siRNA versus Rescue, P = 0.3199. (K) Mock versus siRNA, P = 0.7372; Mock versus Rescue, P = 0.7785; siRNA versus Rescue, P = 0.3328. (L and M) Puncta density and colocalization upon RAB10 knockdown and rescue. n = 15–19 neurons; one-way ANOVA with Tukey’s multiple comparisons test. (L) Mock versus siRNA, P = 0.4622; Mock versus Rescue, P = 0.2334; siRNA versus Rescue, P = 0.8445. (M) Mock versus siRNA, P = 0.0470; Mock versus Rescue, P = 0.3403; siRNA versus Rescue, P = 0.6386. Bars represent mean ± SEM. ns, not significant; *, P < 0.05.
Figure 7.
Figure 7.
Integrated model of autophagosome, autolysosome, and lysosome transport along axons. (A) GTP-bound ARF6 is enriched on AV membranes through local GEF activity, where it can recruit interaction partners JIP3 or JIP4. JIP3/4 in turn recruits dynactin and dynein, leading to activation of the minus-end-directed retrograde motility of autolysosomes. RAB10 may induce anterograde transit, possibly favoring complex formation between JIP3 or JIP4 with JIP1 and kinesin-1. Additional motor complexes have also been implicated in AV or lysosome transport; we highlight a few complementary complexes on the left (Pu et al., 2015; Keren-Kaplan et al., 2022; Cason et al., 2021; Willett et al., 2017; Kumar et al., 2022; Wong and Holzbaur, 2014; Fu et al., 2014; Jongsma et al., 2020; Rosa-Ferreira et al., 2018; Farías et al., 2017; Guardia et al., 2016; Keren-Kaplan and Bonifacino, 2021). (B) This pathway may be disrupted via hyperphosphorylation of RABs. Disease-causing mutations in LRRK2 kinase result in increased phospho-RABs and also increased recruitment of kinesin-1 to the AV membrane (Boecker et al., 2021). The resulting loss of AV motility can be rescued experimentally by expression of GTP-locked ARF6 (Dou et al., 2023); thus these motor-regulatory mechanisms are interconnected and possibly competitive.

Update of

Similar articles

Cited by

References

    1. Abe, N., Almenar-Queralt A., Lillo C., Shen Z., Lozach J., Briggs S.P., Williams D.S., Goldstein L.S.B., and Cavalli V.. 2009. Sunday driver interacts with two distinct classes of axonal organelles. J. Biol. Chem. 284:34628–34639. 10.1074/jbc.M109.035022 - DOI - PMC - PubMed
    1. Akiyama, M., Hasegawa H., Hongu T., Frohman M.A., Harada A., Sakagami H., and Kanaho Y.. 2014. Trans-regulation of oligodendrocyte myelination by neurons through small GTPase Arf6-regulated secretion of fibroblast growth factor-2. Nat. Commun. 5:4744. 10.1038/ncomms5744 - DOI - PubMed
    1. Alam, M.S. 2018. Proximity ligation assay (PLA). Curr. Protoc. Immunol. 123:e58. 10.1002/cpim.58 - DOI - PMC - PubMed
    1. Arimoto, M., Koushika S.P., Choudhary B.C., Li C., Matsumoto K., and Hisamoto N.. 2011. The Caenorhabditis elegans JIP3 protein UNC-16 functions as an adaptor to link kinesin-1 with cytoplasmic dynein. J. Neurosci. 31:2216–2224. 10.1523/JNEUROSCI.2653-10.2011 - DOI - PMC - PubMed
    1. Ayloo, S., Lazarus J.E., Dodda A., Tokito M., Ostap E.M., and Holzbaur E.L.F.. 2014. Dynactin functions as both a dynamic tether and brake during dynein-driven motility. Nat. Commun. 5:4807. 10.1038/ncomms5807 - DOI - PMC - PubMed

Publication types