. 2023 Oct 18;9(10):1927-1943.
doi: 10.1021/acscentsci.3c00794. eCollection 2023 Oct 25.

Deep Learning-Predicted Dihydroartemisinin Rescues Osteoporosis by Maintaining Mesenchymal Stem Cell Stemness through Activating Histone 3 Lys 9 Acetylation

Affiliations

Deep Learning-Predicted Dihydroartemisinin Rescues Osteoporosis by Maintaining Mesenchymal Stem Cell Stemness through Activating Histone 3 Lys 9 Acetylation

Ruoxi Wang et al. ACS Cent Sci. .

Abstract

Maintaining the stemness of bone marrow mesenchymal stem cells (BMMSCs) is crucial for bone homeostasis and regeneration. However, in vitro expansion and bone diseases impair BMMSC stemness, limiting its functionality in bone tissue engineering. Using a deep learning-based efficacy prediction system and bone tissue sequencing, we identify a natural small-molecule compound, dihydroartemisinin (DHA), that maintains BMMSC stemness and enhances bone regeneration. During long-term in vitro expansion, DHA preserves BMMSC stemness characteristics, including its self-renewal ability and unbiased differentiation. In an osteoporosis mouse model, oral administration of DHA restores the femur trabecular structure, bone density, and BMMSC stemness in situ. Mechanistically, DHA maintains BMMSC stemness by promoting histone 3 lysine 9 acetylation via GCN5 activation both in vivo and in vitro. Furthermore, the bone-targeted delivery of DHA by mesoporous silica nanoparticles improves its therapeutic efficacy in osteoporosis. Collectively, DHA could be a promising therapeutic agent for treating osteoporosis by maintaining BMMSC stemness.


Conflict of interest statement

The authors declare no competing financial interest.

Figures
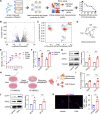
Figure 1
Figure 1
A deep-learning predicted DHA maintains stemness of hBMMSCs both in the early passage and during long-term passaging in vitro. (A) Schematic illustration of the drug screening process via DLEPS. (B) A volcano map of transcriptional profile alterations between neonatal and adult mouse bones. The blue dots represent downregulated genes in adult mouse femora compared to neonatal ones (n = 3). (C) The enrichment scores of small molecules. The red dots represent the score distribution of DHA. (D) Molecule structure of DHA. (E) CCK8 assay of the optimum concentrations to treat hBMMSCs (n = 6). (F) RT-qPCR of stemness-related markers SOX2 and OCT4 in vehicle- and DHA-treated hBMMSCs (n = 4). (G) Western blotting of SOX2 and OCT4 in vehicle- and DHA-treated hBMMSCs (n = 3). (H) Schematic showing the serial passage of hBMMSCs. (I) RT-qPCR of SOX2 and OCT4 in hBMMSCs after vehicle and DHA treatment for 5 generations, respectively (n = 4). (J) Western blotting of SOX2 and OCT4 in hBMMSCs after vehicle and DHA treatment for 5 generations, respectively (n = 3). (K) Immunofluorescence staining and semiquantitative analysis of Ki67 in vehicle- and DHA-treated hBMMSCs after 5 generations (n = 3). Data were represented as mean ± SD, and the P values were calculated by a two-tailed Student’s t-test. Statistical significance was defined as ***P < 0.001, **P < 0.01, and *P < 0.05 between the vehicle group and the DHA group.
Figure 2
Figure 2
DHA maintains unbiased differentiation potentials of hBMMSCs during long-term passaging. (A) ALP and ARS stainings of hBMMSCs treated with vehicle or DHA for 5 generations followed by osteogenic induction (n = 3). (B) RT-qPCR of osteogenesis-related genes RUNX2, OSX, and OCN in hBMMSCs treated with vehicle or DHA for 5 generations followed by osteogenic induction (n = 4). (C) Western blotting of osteogenesis-related proteins RUNX2 and OCN in hBMMSCs treated with vehicle or DHA for 5 generations followed by osteogenic induction (n = 3). (D) Oil red O staining of hBMMSCs treated with vehicle or DHA for 5 generations followed by adipogenic induction (n = 3). (E) RT-qPCR of adipogenesis-related genes PPAR-γ, CEBP-α, and FABP-4 in hBMMSCs treated with vehicle or DHA for 5 generations followed by adipogenic induction (n = 4). (F) Western blotting of adipogenesis-related proteins PPAR-γ and CEBP-α in hBMMSCs treated with vehicle or DHA for 5 generations followed by adipogenic induction. (G) Schematic showing the subcutaneous implantation of the mineralized collagen scaffolds loaded with the vehicle- or DHA-treated hBMMSCs in nude mice. (H) Micro CT of reconstructed 3D images of mineralized implants and quantified bone volume fraction (n = 4). (I) HE and Masson’s trichrome stainings of representative regions of the mineralized implants. S: scaffold; NB: new bone; V: blood vessel. (J) Immunohistochemical staining of OCN and semiquantitation of positive cells (n = 4). Data were represented as mean ± SD, and the P values were calculated by a two-tailed Student’s t-test. Statistical significance was defined as ***P < 0.001, **P < 0.01, and *P < 0.05 between the vehicle group and the DHA group.
Figure 3
Figure 3
Long-term oral administration of DHA rescues bone loss in osteoporotic mice. (A) Schematic illustration of the design of animal experiments. (B) Micro CT images of reconstructed 3D images and bone morphometric parameters of the trabecular bone from different groups (n = 6). (C) Sequential fluorescent labeling indicating bone mineral apposition width (red line) during 7 days and semiquantification (n = 3). (D) HE staining of femora from different groups and semiquantitative analysis of osteoblast number per bone surface (OB.N/B.S) (n = 4). (E) Immunohistochemical staining of OCN+ and OSX+ cells (red arrow) in femur bone marrow after DHA treatment, respectively, and semiquantification (n = 4). (F) HE staining of tibiae after DHA treatment. (G) Immunofluorescence staining of FABP4+ cells in tibiae and semiquantification (n = 3). (H) Oil red O staining of proximal tibiae and semiquantitative analysis of the positive area (n = 4). Data were represented as mean ± SD, the P values were calculated by one-way ANOVA with Tukey as a posthoc test, and the statistical significance was defined as ***P < 0.001, **P < 0.01 and *P < 0.05 among different groups.
Figure 4
Figure 4
DHA improves stemness and unbiased differentiation potentials of endogenous mBMMSCs from osteoporotic mice. (A) CFU assay of mBMMSCs isolated from normal mice (sham group), vehicle-treated OVX mice (OVX + vehicle group), and DHA-treated OVX mice (OVX + DHA group) (n = 3). (B) Immunofluorescence staining and semiquantitative analysis of Ki67+ mBMMSCs isolated from the sham, OVX + vehicle, and OVX + DHA groups (n = 3). (C) RT-qPCR of Sox2 and Oct4 in mBMMSCs isolated from the sham, OVX + vehicle, and OVX + DHA groups (n = 4). (D) Western blotting of OCT4 and SOX2 in mBMMSCs isolated from the sham, OVX + vehicle, and OVX + DHA groups (n = 3). (E) RT-qPCR of Runx2, Ocn, and Alp in mBMMSCs isolated from the sham, OVX + vehicle, and OVX + DHA groups with osteogenic induction (n = 4). (F) Western blotting of OCN and RUNX2 in mBMMSCs isolated from the sham, OVX + vehicle, and OVX + DHA groups with osteogenic induction (n = 3). (G) ARS staining and semiquantification of mBMMSCs isolated from the sham, OVX + vehicle, and OVX + DHA groups with osteogenic induction (n = 3). (H) Western blotting of PPAR-γ and CEBP-α in mBMMSCs isolated from the sham, OVX + vehicle, and OVX + DHA groups with adipogenic induction (n = 3). (I) Oil red O staining and semiquantification of mBMMSCs isolated from the sham, OVX + vehicle, and OVX + DHA groups with adipogenic induction (n = 4). Data were represented as mean ± SD, the P values were calculated by one-way ANOVA with Tukey as a posthoc test, and the statistical significance was defined as ***P < 0.001, **P < 0.01, and *P < 0.05 among different groups.
Figure 5
Figure 5
DHA enhances BMMSC stemness by histone modification. (A) Schematic showing that DHA enhances BMMSC stemness by histone acetylation. The scheme was created by BioRender (https://www.biorender.com). (B, C) Western blotting (B) and confocal microscopy (C) of H3K9ac in vehicle- and DHA-treated hBMMSCs after 5 generations (n = 4). (D) RT-qPCR of GCN5, P300, PCAF, SIRT6, HDAC1, HDAC2, and HDAC8 in vehicle- and DHA-treated hBMMSCs after 5 generations (n = 6). (E) Western blotting of H3K9ac and GCN5 in hBMMSCs treated by vehicle and DHA for five passages (n = 3). (F) Western blotting of H3K9ac and GCN5 in mBMMSCs from mice with different treatments (n = 3). (G) RT-qPCR of SOX2 and OCT4 in hBMMSCs treated with vehicle or DHA for 5 generations followed by knocking down GCN5 (n = 4). (H) Western blotting of SOX2 and OCT4 in hBMMSCs treated with vehicle or DHA for 5 generations followed by knockdown of GCN5 (n = 3). (I) Immunofluorescence staining and semiquantification of Ki67 in hBMMSCs treated with vehicle or DHA for 5 generations followed by knocking down GCN5 (n = 4). (J) ARS staining of hBMMSCs treated with vehicle or DHA for 5 generations followed by GCN5 knockdown and osteogenic induction for 21 days and semiquantification (n = 3). Data were represented as mean ± SD, and the P values were calculated by two-tailed Student’s t-test for (B–D) and (I), while by one-way ANOVA with Tukey as a posthoc test for d and j–m. Statistical significance was defined as ***P < 0.001, **P < 0.01, and *P < 0.05 between the control group and the DHA-treated group.
Figure 6
Figure 6
MSN-ALN nanospheres for bone-targeted delivery of DHA. (A, B) SEM (A) and TEM (B) images showing the nanostructure of MSNs and ALN-modified MSNs (MSN-ALNs). (C) Size distribution curves of MSNs, MSN-ALNs, and MSN-PEGs in PBS. (D) Representative ex vivo images of organs and bones (i), and quantified accumulation in bones (ii–iii) at varying intervals after tail vein injection of MSN-PEGs and MSN-ALNs in mice (n = 4). (E) Live and dead staining and semiquantification of hBMMSCs after incubating with MSN-ALNs for 24 h (live: green, dead: red, n = 4). (F) RT-qPCR of SOX2 and OCT4 in PBS- and MSN-ALN@DHA-treated hBMMSCs (n = 4). (G) Western blotting of SOX2 and OCT4 in PBS- and MSN-ALN@DHA-treated hBMMSCs (n = 4). Data were represented as mean ± SD, and the P values were calculated by two-tailed Student’s t-test. Statistical significance was defined as ***P < 0.001, **P < 0.01, and *P < 0.05 between the control group and the DHA-treated group.
Figure 7
Figure 7
MSN-ALN@DHA promotes bone formation in OVX-induced osteoporotic mice. (A) Schematic illustration of the design of animal experiments. (B) Micro CT of reconstructed 3D images of bone tissues from distal femoral metaphyseal after 6-week treatment and bone morphometric parameters (n = 4–5). (C) HE staining of femora from different groups and semiquantitative analysis of OB.N/B.S (n = 4). (D) Immunohistochemical staining and semiquantification of OCN+ cells (red arrow) in femur bone marrow after MSN-ALN@DHA treatment (n = 4). Data were represented as mean ± SD, the P values were calculated by one-way ANOVA with Tukey as a posthoc test, and the statistical significance was defined as ***P < 0.001, **P < 0.01, and *P < 0.05 among different groups.

Similar articles

Cited by

References

    1. Rachner T. D.; Khosla S.; Hofbauer L. C. Osteoporosis: now and the future. Lancet (London, England) 2011, 377 (9773), 1276–87. 10.1016/S0140-6736(10)62349-5. - DOI - PMC - PubMed
    1. Brown C. Osteoporosis: Staying strong. Nature 2017, 550 (7674), S15–s17. 10.1038/550S15a. - DOI - PubMed
    1. Ikebuchi Y.; Aoki S.; Honma M.; Hayashi M.; Sugamori Y.; Khan M.; Kariya Y.; Kato G.; Tabata Y.; Penninger J. M.; Udagawa N.; Aoki K.; Suzuki H. Coupling of bone resorption and formation by RANKL reverse signalling. Nature 2018, 561 (7722), 195–200. 10.1038/s41586-018-0482-7. - DOI - PubMed
    1. Uccelli A.; Moretta L.; Pistoia V. Mesenchymal stem cells in health and disease. Nature reviews. Immunology 2008, 8 (9), 726–36. 10.1038/nri2395. - DOI - PubMed
    1. Pittenger M. F.; Mackay A. M.; Beck S. C.; Jaiswal R. K.; Douglas R.; Mosca J. D.; Moorman M. A.; Simonetti D. W.; Craig S.; Marshak D. R. Multilineage potential of adult human mesenchymal stem cells. Science (New York, N.Y.) 1999, 284 (5411), 143–7. 10.1126/science.284.5411.143. - DOI - PubMed