. 2023 Oct 14;28(20):7094.
doi: 10.3390/molecules28207094.

A Bidens pilosa L. Non-Polar Extract Modulates the Polarization of Human Macrophages and Dendritic Cells into an Anti-Inflammatory Phenotype

Affiliations

A Bidens pilosa L. Non-Polar Extract Modulates the Polarization of Human Macrophages and Dendritic Cells into an Anti-Inflammatory Phenotype

Xandy Melissa Rodríguez Mesa et al. Molecules. .

Abstract

Different communities around the world traditionally use Bidens pilosa L. for medicinal purposes, mainly for its anti-inflammatory, antinociceptive, and antioxidant properties; it is used as an ingredient in teas or herbal medicines for the treatment of pain, inflammation, and immunological disorders. Several studies have been conducted that prove the immunomodulatory properties of this plant; however, it is not known whether the immunomodulatory properties of B. pilosa are mediated by its ability to modulate antigen-presenting cells (APCs) such as macrophages (MØs) and dendritic cells (DCs) (through polarization or the maturation state, respectively). Different polar and non-polar extracts and fractions were prepared from the aerial part of B. pilosa. Their cytotoxic and immunomodulatory effects were first tested on human peripheral blood mononuclear cells (PBMCs) and phytohemagglutinin (PHA)-stimulated PBMCs, respectively, via an MTT assay. Then, the non-cytotoxic plant extracts and fractions that showed the highest immunomodulatory activity were selected to evaluate their effects on human MØ polarization and DC maturation (cell surface phenotype and cytokine secretion) through multiparametric flow cytometry. Finally, the chemical compounds of the B. pilosa extract that showed the most significant immunomodulatory effects on human APCs were identified using gas chromatography coupled with mass spectrometry. The petroleum ether extract and the ethyl acetate and hydroalcoholic fractions obtained from B. pilosa showed low cytotoxicity and modulated the PHA-stimulated proliferation of PBMCs. Furthermore, the B. pilosa petroleum ether extract induced M2 polarization or a hybrid M1/M2 phenotype in MØs and a semi-mature status in DCs, regardless of exposure to a maturation stimulus. The immunomodulatory activity of the non-polar (petroleum ether) extract of B. pilosa on human PBMC proliferation, M2 polarization of MØs, and semi-mature status in DCs might be attributed to the low-medium polarity components in the extract, such as phytosterol terpenes and fatty acid esters.

Keywords: Bidens pilosa L.; dendritic cells; immunomodulation; macrophages; phytochemistry; phytotherapy; traditional medicine.


Conflict of interest statement

The authors declare no conflict of interest.

Figures
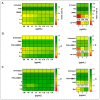
Figure 1
Figure 1
Effects of B. pilosa L. on human PBMCs. (A). Heat maps of percentage (%) of viable PBMCs treated at different concentrations of petroleum ether extract (2), ethyl acetate fraction (3.3), or hydroalcoholic fraction (3.4) of B. pilosa and cultured at 37 °C, 5% CO2 for 48 h. Control cultures were prepared with untreated PBMCs, PBMCs treated with curcumin (CUR) or delta-9-tetrahydrocannabinol (Δ9-THC), or DMSO (vehicle control). The percentage of viable cells relative to the vehicle control was determined via the colorimetric MTT assay. (B). Heat maps of proliferation index (PI) of PBMCs were stimulated with PHA (0.04 μg/mL) and simultaneously exposed to different concentrations of CUR, Δ9-THC or petroleum ether extract (2), or ethyl acetate fraction (3) or hydroalcoholic fraction (4) of B. pilosa and cultured at 37 °C, 5% CO2 for 48 h. (C). Heat maps of PI of PBMCs that were stimulated with PHA (0.04 μg/mL) at 37 °C, 5% CO2 for 24 h, and then exposed to the extracts of B. pilosa or controls, as described in (B). Then, the PI was determined via the MTT colorimetric assay, relative to the respective vehicle control. Statistical significance for all experiments was obtained using two-way ANOVA and Dunnet’s post hoc multiple comparison test (* p < 0.05, ** p < 0.01, *** p < 0.001).
Figure 2
Figure 2
Effects of the petroleum ether extract and the ethyl acetate and hydroalcoholic fractions of B. pilosa on the polarization of M1-preconditioned MØs. Human M1-preconditioned MØs (derived from monocytes cultured with 20 ng/mL of GM-CSF for six days) were exposed to petroleum ether extract (2), the ethyl acetate fraction (3.3), or the hydroalcoholic fraction (3.4) of B. pilosa and cultured at 37 °C, 5% CO2 for 48 h. M1-preconditioned MØ (non-polarized or untreated), polarized M1 (addition of IFN-γ at 40 ng/mL on the sixth day), M1-preconditioned treated with curcumin (CUR) at 15 ng/mL (immunomodulator control), and vehicle (addition of DMSO on the sixth day) MØ culture controls were run in parallel. Macrophage phenotype was assessed by staining with fluorescent antibodies and flow cytometry. Culture supernatants were collected for cytokine quantification using CBA kit and flow cytometry. (A). Representative histograms comparing MØ phenotypic markers. (B). Representative contour plots showing co-expression of MØ phenotypic markers. (C). Column graph shows the percentages (mean ± SD) of MØ (CD16+ cells) expressing M1 or M2 phenotypic markers. (D). Column graph shows the cytokine levels in culture supernatants (mean ± SD). * p < 0.05, *** p < 0.001. One-way or two-way ANOVA tests and Dunnet’s post hoc multiple comparison test. n = 2.
Figure 3
Figure 3
Effects of the petroleum ether extract and the ethyl acetate and hydroalcoholic fractions of B. pilosa on the polarization of M2-preconditioned MØs. Human M2-preconditioned MØs (derived from monocytes cultured with 20 ng/mL of M-CSF for six days) were exposed to petroleum ether extract (2), the ethyl acetate fraction (3.3), or the hydroalcoholic fraction (3.4) of B. pilosa and cultured at 37 °C, 5% CO2 for 48 h. M2-preconditioned (non-polarized or untreated), polarized M2 (addition of IL-4 at 40 ng/mL on the sixth day), M2 treated with curcumin (CUR) at 15 ng/mL (immunomodulator control), and vehicle (addition of DMSO on the sixth day) MØ culture controls were run in parallel. Macrophage phenotype was assessed by staining with fluorescent antibodies and using flow cytometry. Culture supernatants were collected for cytokine quantification using CBA kit and flow cytometry. (A). Representative histograms comparing MØ phenotypic markers. (B). Representative contour plots showing co-expression of MØ phenotypic markers. (C). Column graph shows the percentages (mean ± SD) of MØ (CD16+ cells) expressing M1 or M2 phenotypic markers. (D). Column graph shows the cytokine levels in culture supernatants (mean ± SD). * p < 0.05, ** p < 0.01, *** p < 0.001. One-way or two-way ANOVA tests and Dunnet’s post hoc multiple comparison test.
Figure 4
Figure 4
Effects of the petroleum ether extract and the ethyl acetate and hydroalcoholic fractions of B. pilosa on the maturation status of human DCs. Human immature DCs were exposed to petroleum ether extract (2), the ethyl acetate fraction (3.3), or the hydroalcoholic fraction (3.4) of B. pilosa at 37 °C, 5% CO2 for 48 h. Immature (untreated), mature (addition of LPS at 1 μg/mL on the fifth day), treated with curcumin (CUR) at 15 ng/mL (immunomodulator control), and vehicle (addition of DMSO on the fifth day) DC control cultures were run in parallel. Dendritic cell phenotype was assessed by staining with fluorescent antibodies and using flow cytometry. Culture supernatants were collected for cytokine quantification using CBA and flow cytometry. (A). Representative histograms comparing DC phenotypic markers. (B). Representative contour plots showing co-expression of DC phenotypic markers. (C). Column graphs show the percentages (mean ± SD) of total CD206+CD209+ DCs and CD206+CD209+ subsets in the CD83+, CD86+, or HLA-DR+ DCs. (D). Column graphs show cytokine levels (mean ± SD) in culture supernatants. * p < 0.05, ** p < 0.01, *** p < 0.001. One-way or two-way ANOVA tests and Dunnet’s post hoc multiple comparison test.
Figure 5
Figure 5
Effects of the petroleum ether extract of B. pilosa on M1 polarization of macrophages and maturation of LPS-stimulated dendritic cells. (A). Human M1-preconditioned MØs were exposed to IFN-γ at 40 ng/mL (M1-polarizing stimulus) for 48 h and then treated with curcumin at 15 ng/mL (CUR) (immunomodulator control), petroleum ether extract (2) of B. pilosa, or DMSO (vehicle control) for an additional 48 h, incubated at 37 °C, 5% CO2. Column graphs show the percentages (mean ± SD) of MØs (CD16+ cells) expressing M1 or M2 phenotypic markers. Also, representative contour plots of MØs co-expressing M1 or M2 markers are shown. (B). Column graphs show cytokine levels (mean ± SD) in MØ culture supernatants. (C). Human immature DCs were exposed to LPS at 1 μg/mL (maturating stimulus) and the CUR at 15 ng/mL or petroleum ether extract (2) of B. pilosa at the same time, or DMSO (vehicle control) on fifth day and further incubated at 37 °C, 5% CO2 for 48 h. DCs were evaluated by staining with fluorescent antibodies and using flow cytometry. Column graphs show the percentages (mean ± SD) of total CD206+CD209+ DCs and CD206+CD209+ subsets in the CD83+, CD86+, or HLA-DR+ DCs. Also, representative contour plots of DCs co-expressing phenotypic markers are shown. (D). Column graphs show cytokine levels (mean ± SD) in DC culture supernatants (* p < 0.05, ** p < 0.01, *** p < 0.001). One-way or two-way ANOVA tests and Dunnet’s post hoc multiple comparison test.

Similar articles

References

    1. Gea-Banacloche J.C. Immunomodulation. In: Runge M.S., Patterson C., editors. Principles of Molecular Medicine. Humana Press; Totowa, NJ, USA: 2006. pp. 893–904. - DOI
    1. Masihi K.N. Fighting infection using immunomodulatory agents. Expert. Opin. Biol. Ther. 2001;1:641–653. doi: 10.1517/14712598.1.4.641. - DOI - PubMed
    1. Martin K., Schreiner J., Zippelius A. Modulation of APC Function and Anti-Tumor Immunity by Anti-Cancer Drugs. Front. Immunol. 2015;6:501. doi: 10.3389/fimmu.2015.00501. - DOI - PMC - PubMed
    1. Bashaw A.A., Leggatt G.R., Chandra J., Tuong Z.K., Frazer I.H. Modulation of antigen presenting cell functions during chronic HPV infection. Papillomavirus Res. 2017;4:58–65. doi: 10.1016/j.pvr.2017.08.002. - DOI - PMC - PubMed
    1. Banchereau J., Briere F., Caux C., Davoust J., Lebecque S., Liu Y.J., Pulendran B., Palucka K. Immunobiology of dendritic cells. Annu. Rev. Immunol. 2000;18:767–811. doi: 10.1146/annurev.immunol.18.1.767. - DOI - PubMed

Grants and funding

This work was funded by the Pontificia Universidad Javeriana; the Ministry of Science, Technology and Innovation; the Ministry of National Education; the Ministry of Industry, Commerce and Tourism; and ICETEX. Second Call of the Scientific Ecosystem, Colombia Científica, 792-2017. Program “Generation of alternatives therapeutics in cancer from plants through translational research and development processes, articulated in environmentally and economically sustainable valuable systems” (Contract No. FP44842-221-2018) and the Juan N. Corpas University Foundation.

LinkOut - more resources