

Pan-cancer analysis revealing that PTPN2 is an indicator of risk stratification for acute myeloid leukemia
- PMID: 37884566
- PMCID: PMC10603079
- DOI: 10.1038/s41598-023-44892-z
Pan-cancer analysis revealing that PTPN2 is an indicator of risk stratification for acute myeloid leukemia
Abstract
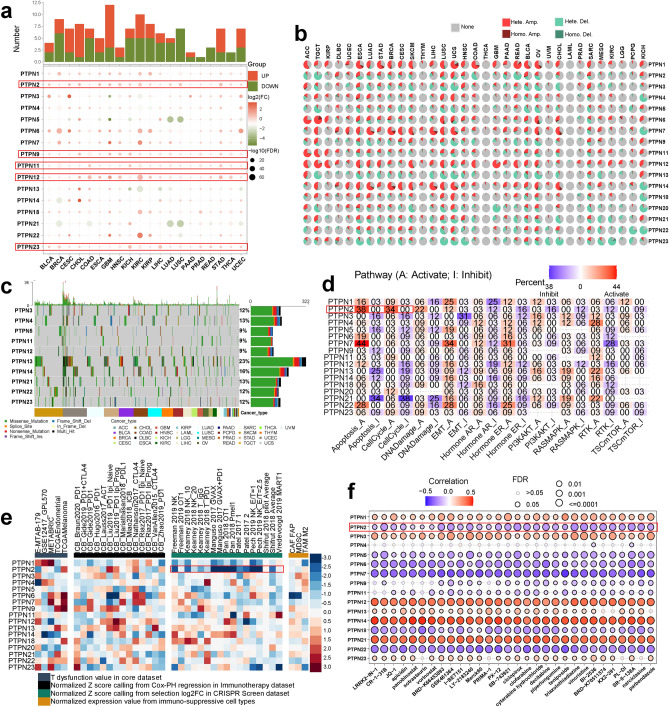
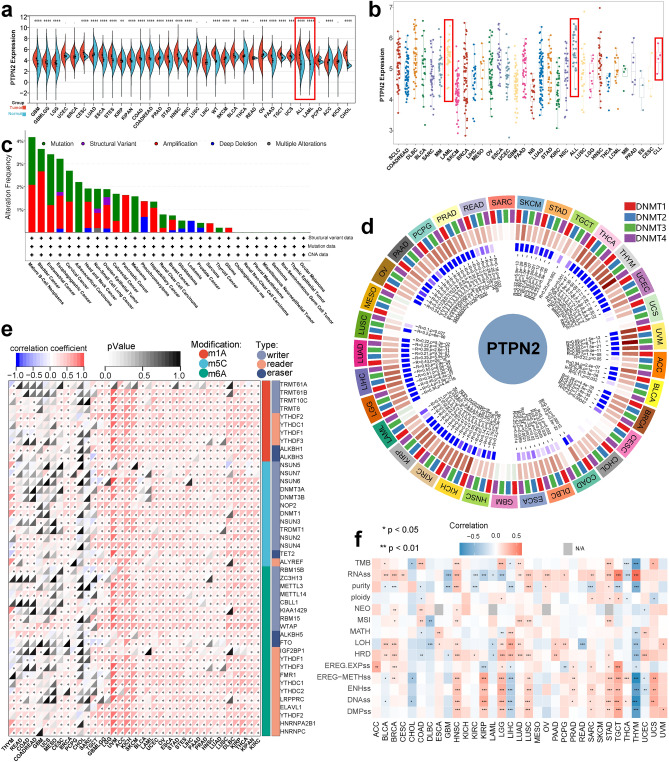
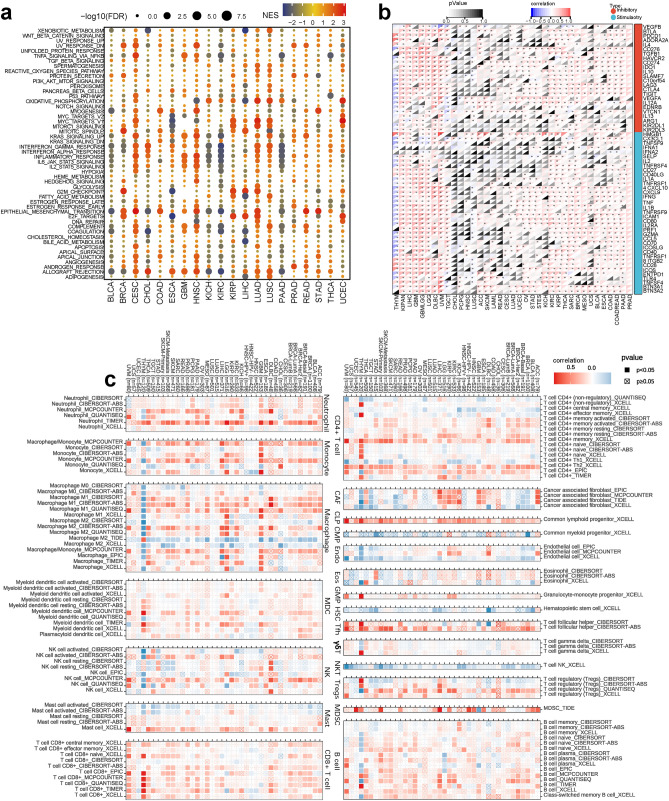
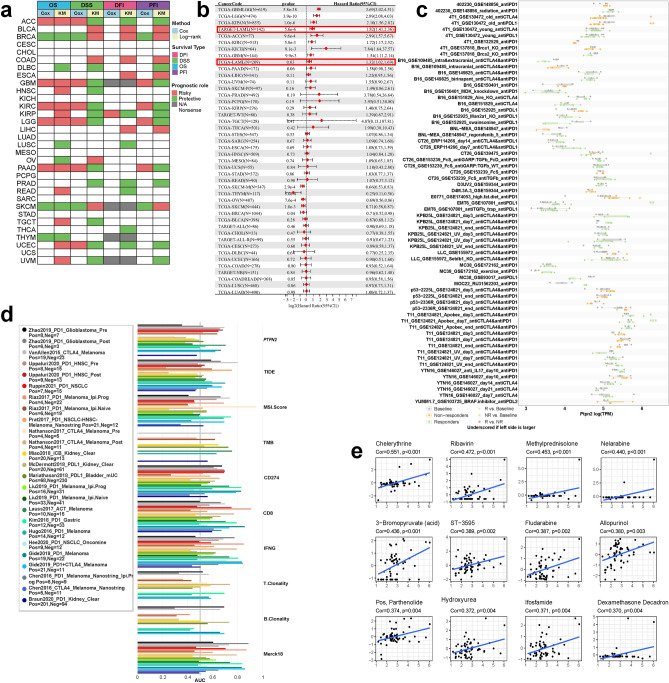
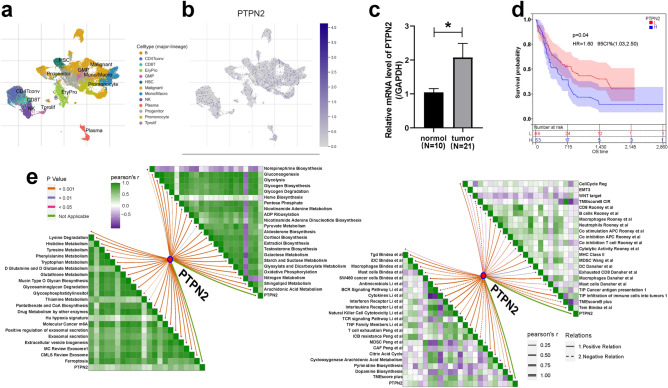
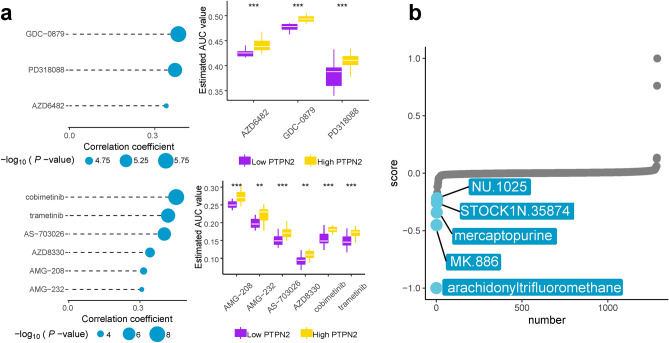
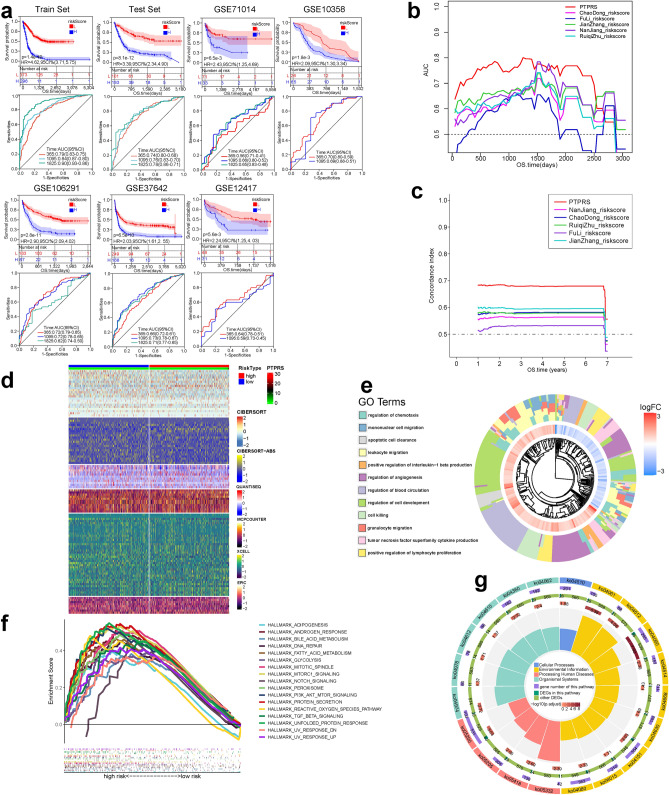
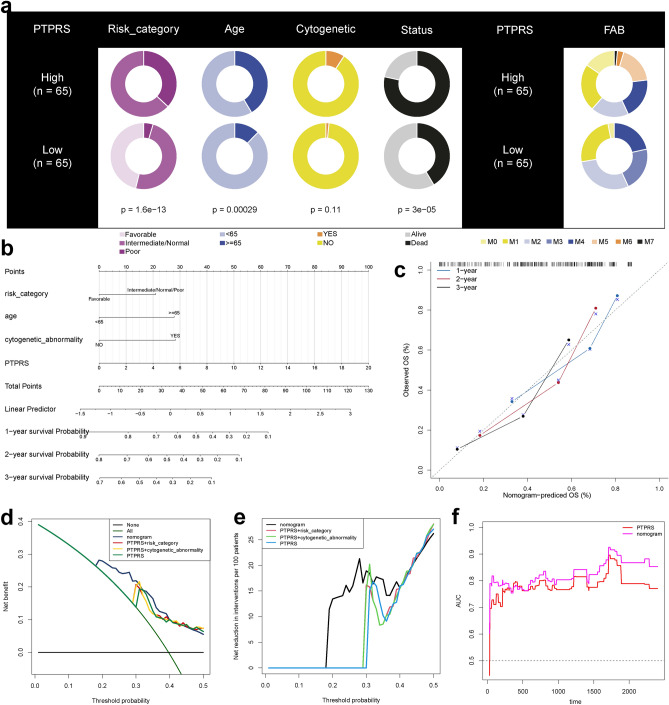
The non-receptor protein tyrosine phosphatases gene family (PTPNs) is involved in the tumorigenesis and development of many cancers, but the role of PTPNs in acute myeloid leukemia (AML) remains unclear. After a comprehensive evaluation on the expression patterns and immunological effects of PTPNs using a pan-cancer analysis based on RNA sequencing data obtained from The Cancer Genome Atlas, the most valuable gene PTPN2 was discovered. Further investigation of the expression patterns of PTPN2 in different tissues and cells showed a robust correlation with AML. PTPN2 was then systematically correlated with immunological signatures in the AML tumor microenvironment and its differential expression was verified using clinical samples. In addition, a prediction model, being validated and compared with other models, was developed in our research. The systematic analysis of PTPN family reveals that the effect of PTPNs on cancer may be correlated to mediating cell cycle-related pathways. It was then found that PTPN2 was highly expressed in hematologic diseases and bone marrow tissues, and its differential expression in AML patients and normal humans was verified by clinical samples. Based on its correlation with immune infiltrates, immunomodulators, and immune checkpoint, PTPN2 was found to be a reliable biomarker in the immunotherapy cohort and a prognostic predictor of AML. And PTPN2'riskscore can accurately predict the prognosis and response of cancer immunotherapy. These findings revealed the correlation between PTPNs and immunophenotype, which may be related to cell cycle. PTPN2 was differentially expressed between clinical AML patients and normal people. It is a diagnostic biomarker and potentially therapeutic target, providing targeted guidance for clinical treatment.
© 2023. The Author(s).
Conflict of interest statement
The authors declare no competing interests.
Figures
Similar articles
-
PTPN2, A Key Predictor of Prognosis for Pancreatic Adenocarcinoma, Significantly Regulates Cell Cycles, Apoptosis, and Metastasis.Front Immunol. 2022 Jan 27;13:805311. doi: 10.3389/fimmu.2022.805311. eCollection 2022. Front Immunol. 2022. PMID: 35154122 Free PMC article.
-
Comprehensive analysis of PTPN family expression and prognosis in acute myeloid leukemia.Front Genet. 2023 Jan 9;13:1087938. doi: 10.3389/fgene.2022.1087938. eCollection 2022. Front Genet. 2023. PMID: 36699453 Free PMC article.
-
The expression patterns and the diagnostic/prognostic roles of PTPN family members in digestive tract cancers.Cancer Cell Int. 2020 Jun 12;20:238. doi: 10.1186/s12935-020-01315-7. eCollection 2020. Cancer Cell Int. 2020. PMID: 32536826 Free PMC article.
-
Critical roles of PTPN family members regulated by non-coding RNAs in tumorigenesis and immunotherapy.Front Oncol. 2022 Jul 26;12:972906. doi: 10.3389/fonc.2022.972906. eCollection 2022. Front Oncol. 2022. PMID: 35957898 Free PMC article. Review.
-
PTPN2 in the Immunity and Tumor Immunotherapy: A Concise Review.Int J Mol Sci. 2022 Sep 2;23(17):10025. doi: 10.3390/ijms231710025. Int J Mol Sci. 2022. PMID: 36077422 Free PMC article. Review.
References
-
- Lewis DR, Siembida EJ, Seibel NL, Smith AW, Mariotto AB. Survival outcomes for cancer types with the highest death rates for adolescents and young adults, 1975–2016. Cancer-Am. Cancer Soc. 2021;127:4277–4286. - PubMed
Publication types
MeSH terms
Substances
LinkOut - more resources
Full Text Sources
Medical
Research Materials
