. 2024 Apr;20(4):883-901.
doi: 10.1080/15548627.2023.2274204. Epub 2023 Nov 8.

ATG9 resides on a unique population of small vesicles in presynaptic nerve terminals

Affiliations

ATG9 resides on a unique population of small vesicles in presynaptic nerve terminals

Beyenech Binotti et al. Autophagy. 2024 Apr.

Abstract

In neurons, autophagosome biogenesis occurs mainly in distal axons, followed by maturation during retrograde transport. Autophagosomal growth depends on the supply of membrane lipids which requires small vesicles containing ATG9, a lipid scramblase essential for macroautophagy/autophagy. Here, we show that ATG9-containing vesicles are enriched in synapses and resemble synaptic vesicles in size and density. The proteome of ATG9-containing vesicles immuno-isolated from nerve terminals showed conspicuously low levels of trafficking proteins except of the AP2-complex and some enzymes involved in endosomal phosphatidylinositol metabolism. Super resolution microscopy of nerve terminals and isolated vesicles revealed that ATG9-containing vesicles represent a distinct vesicle population with limited overlap not only with synaptic vesicles but also other membranes of the secretory pathway, uncovering a surprising heterogeneity in their membrane composition. Our results are compatible with the view that ATG9-containing vesicles function as lipid shuttles that scavenge membrane lipids from various intracellular membranes to support autophagosome biogenesis.Abbreviations: AP: adaptor related protein complex: ATG2: autophagy related 2; ATG9: autophagy related 9; DNA PAINT: DNA-based point accumulation for imaging in nanoscale topography; DyMIN STED: dynamic minimum stimulated emission depletion; EL: endosome and lysosome; ER: endoplasmic reticulum; GA: Golgi apparatus; iBAQ: intensity based absolute quantification; LAMP: lysosomal-associated membrane protein; M6PR: mannose-6-phosphate receptor, cation dependent; Minflux: minimal photon fluxes; Mito: mitochondria; MS: mass spectrometry; PAS: phagophore assembly site; PM: plasma membrane; Px: peroxisome; RAB26: RAB26, member RAS oncogene family; RAB3A: RAB3A, member RAS oncogene family; RAB5A: RAB5A, member RAS oncogene family; SNARE: soluble N-ethylmaleimide-sensitive-factor attachment receptor; SVs: synaptic vesicles; SYP: synaptophysin; TGN: trans-Golgi network; TRAPP: transport protein particle; VTI1: vesicle transport through interaction with t-SNAREs.

Keywords: ATG9; RAB26; autophagy; synapse; synaptic vesicles; vesicle proteome.


Conflict of interest statement

No potential conflict of interest was reported by the author(s).

Figures

Figure 1.
Figure 1.
Synaptic ATG9 resides on vesicles resembling synaptic vesicles in size and density but represent a distinct vesicle class. (A) scheme depicting the fractions generated during subcellular fractionation of rat brain during isolation of synaptic vesicles. H, homogenate, P1, P2, and S1, S2, pellets and supernatants, respectively, of the initial centrifugation steps; LP1, LP2, LS1, LS2, pellets and supernatants generated after differential centrifugation of osmotically lysed P2 (synaptosomes); PK1, SV fractions eluted from the final size-exclusion column containing membrane fragments and synaptic vesicles, respectively (see text for details). The supernatant obtained after lysis of synaptosomes (LS1) was used as starting material (input) for the immuno-isolations. (B) immunoblots of fractions (equal amounts of protein loaded) for the vesicle marker VAMP2/SYB2 and ATG9, showing co-enrichment of both proteins during SV isolation. The blot is representative of three biological replicates. (C) immuno-isolation of vesicles using magnetic beads coated with monoclonal mouse antibodies specific for SYP (synaptophysin), RAB3A, RAB5A, and monoclonal rabbit ATG9. Beads coated with sheep IgG were used to control for nonspecific adsorption. Rb IgG band represents the IgGs that were used for immuno-isolation and that cross-react with the detection antibody. Note the cross-reaction of the ATG9 detection antibody with a nonspecific band (asterisk). The blot is representative for at least two biological replicates (see Figure S1). (D) transmission electron microscopy of the magnetic beads after immuno-isolation reveals that ATG9-containing vesicles are very similar (albeit slightly more heterogeneous) to synaptic vesicles. Scale bar: 200 nm. Graph: histogram showing the diameter distribution of ATG9 and SYP vesicles, respectively, bound to the beads. Bar: 200 nm.
Figure 2.
Figure 2.
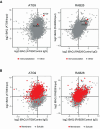
2D scatter plots of proteins quantified by proteomic analysis of ATG9- and RAB26 immuno-isolates, confirming the purity of the isolated vesicle fractions. (A) overview of all proteins quantified by label-free liquid chromatography-tandem mass spectrometry (LC-MS/MS). The scatter plots represent a 2D comparison of all identified proteins and their log2-transformed iBAQ values derived from ATG9 (left) and RAB26 (right) immuno-isolates in relation to both reference samples: log2-transformed iBAQ values of the proteins from starting material for immuno-isolation (Y-axis) and log2-transformed iBAQ values from proteins on beads coupled to control (sheep) IgG (X-axis). Targeted proteins (ATG9, RAB26, respectively) are highlighted in red. (B) distribution of protein containing transmembrane domains (red dots) in each sample set as plotted under (A).
Figure 3.
Figure 3.
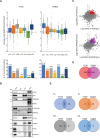
Enrichment of organellar markers in ATG9 and RAB26 vesicles. (A) box plots showing the enrichments of organelle-specific proteins detected in the ATG9 and RAB26 proteome (see Figure S1 for the respective 2D scatter plots). SV, synaptic vesicles (blue), EL, endosomes and lysosomes (orange), PM, plasma membranes (gray), GA, Golgi apparatus (yellow), ER, endoplasmic reticulum (light blue), Mito, mitochondria (green), Px, peroxisomes (dark blue). The Y-axis shows the average log2-fold enrichment (log2 iBAQ ATG9/Input + log2 iBAQ ATG9/control IgG) divided by 2 of the individual proteins of each group. Bottom: graphs representing the fraction (in %) of the proteins listed in the respective organelle database (see text for details) that were recovered in the respective immuno-isolates (the numbers on top of the bars represent the total number of proteins in the organelle proteomes). (B) distribution of selected proteins between vesicles immuno-isolated for SYP and ATG9, respectively. Immuno-isolated fractions were analyzed by immunoblotting for select proteins, confirming MS-based quantification of proteins enriched in ATG9-containing vesicles. These include TMEM9B, M6PR, LC3B, SNAP23, VTI1A, VAMP7, ATG2A and PIP4K2A found in ATG9-containing vesicles compared to Synpatophysin vesicles. See Figure 1 for details. (C) scatter plot showing the proteins enriched > 2-fold in both dimensions, corresponding to a cutoff of log2-transformed iBAQ (ATG9/Control) and (ATG9/Input) >1, for both ATG9 (red, upper graph) and RAB26 (violet, lower graph). (D) Venn diagram of the > 2-fold enriched proteins in the ATG9 (red) and RAB26 (violet) proteome showing that overlap is limited. (E) as in (C) but limited to the recovered organelle-specific proteins, respectively.
Figure 4.
Figure 4.
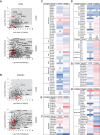
ATG9-containing vesicles are not enriched in proteins functioning in membrane traffic. (A and B) scatter plots showing enrichments of RAB GTPases and SNAREs (red dots) in the ATG9 and RAB26 vesicle proteomes (according to Figure 2)(C-H) heat map analysis showing the enrichment levels of coat proteins, tethering complexes, and other trafficking proteins in both proteomes. Enrichments were calculated as the average log2 fold enrichment as described in the legend to Figure 3. Color code: red >0, and blue < 0. See text for details.
Figure 5.
Figure 5.
Single vesicle imaging by three-color DyMIN STED reveals sparse colocalization of ATG9 with markers for other intracellular organelles. (A) schematic illustration of the experiment: SVs were purified from rat brain, labeled in solution followed by removal of unbound antibody (AB) with size-exclusion chromatography and then imaged at single vesicle resolution using a DyMIN microscope (see Materials and Methods). Scale bar: 500 nm. (B) representative DyMIN STED images (inverse color map) of SVs for SYP, VAMP2/SYB2 and ATG9. Purple, magenta, and green circles portray the individual SV areas derived by a 2D Gaussian fit of SYP, VAMP2 and ATG9 puncta, respectively. Scale bar: 500 nm. (C) Venn diagrams displaying the degree of overlap between vesicles expressing ATG9, SYP, RAB26, and various membrane proteins specific for intracellular organelles, obtained by the three- color DyMIN STED imaging: the SNARE VTI1B, LAMP2, the aminophospholipid flippase ATP8A1, the P/Q type voltage-dependent calcium channel CACNA1A, M6PR, the protein translocon subunit SEC61A1, and LAMP5 (see text for details). The percentage of vesicles overlapping with ATG9 or SYP (in percent of ATG9 or SYP, respectively) were: RAB26; 6.5/49.3; LAMP2, 5.3/0.5; ATP8A1, 8.9/1.2; CACNA1A, 7.4/2.2; M6PR, 10.3/2.1; SEC61A1, 6.5/1.9; LAMP5; 0.2/0.02, VTI1B, 9.8/0.2. n = 3 experiments (involving independent vesicle preparations) for each combination; number of vesicles detected and analyzed in each experiment for SYP > 10,000; ATG9 > 1000; VTI1B = 761; LAMP2 = 631; ATP8A1 = 650; CACNA1A = 756; M6PR = 688; SEC61A1 = 867; LAMP5 = 467; RAB26 = 1247).
Figure 6.
Figure 6.
In cultured hippocampal neurons, ATG9 and SYP are both enriched in synapses but show only limited overlap. (A) representative confocal image showing an overview of ATG9 expression in cultured hippocampal neurons. Scale bar: 20 μm. (B) representative images of a soma region expressing ATG9, SYP and the merge of the two channels. Scale bar: 10 μm. (C) representative images of a straightened dendritic segment expressing ATG9, SYP and the merge of the two channels. White arrows indicate colocalized puncta. Scale bar: 10 μm. (D) box plot showing Pearson’s colocalization correlation between ATG9 and SYP in the soma and dendritic regions (3 experiments). (E) representative two-color DyMIN STED images of dendritic segments showing ATG9 (top) and SYP (bottom) at single vesicle resolution, revealing that at this enhanced resolution co-localization is much lower than at the diffraction-limited resolution shown in C. The synaptic regions, defined by the AZ marker, PCLO, are encircled by white dotted lines. Scale bar: 500 nm. (F) box plot quantifying the number of ATG9 and SYP vesicles in individual synapses (27 synapses, 3 experiments).
Figure 7.
Figure 7.
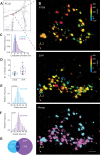
3D resolution by Minflux nanoscopy of individual vesicles in synapses reveals that ATG9 and SYP vesicles represent distinct populations. (A) overview of the distribution of presynaptic regions in cultured hippocampal neurons, marked by the active zone protein PCLO. Scale bar: 10 μm (B) Minflux raw images of the zoomed-in region from A (red box) showing 3D localizations of ATG9 (top) and SYP (middle) and the merge (bottom). While the top and middle images are color coded by the positions of the localizations in the z-axis, the bottom (merged) image shows distinct color codes for ATG9 (magenta) and SYP (purple) localizations. Scale bar: 100 nm. (C) histogram showing the distribution of the combined (axial and lateral) localization precision (standard error of the mean) for ATG9 and SYP. (D) box plot quantifying the number of detected ATG9 and SYP vesicles per synapse (n = 4 independent experiments). (E and F) histogram showing the size distribution of ATG9 and SYP vesicles. (G) Venn diagram showing the overlap between ATG9 and SYP vesicles (32.2% of ATG9-containing vesicles carry SYP and 15.6% of SYP vesicles carry ATG9). The numbers in the diagram quantify ATG9 and SYP vesicles as determined by cluster analysis of individual fluorophores (see Materials and Methods).

Similar articles

Cited by

References

    1. Sudhof TC. The synaptic vesicle cycle. Annu Rev Neurosci. 2004;27(1):509–547. doi: 10.1146/annurev.neuro.26.041002.131412 - DOI - PubMed
    1. Jahn R, Fasshauer D. Molecular machines governing exocytosis of synaptic vesicles. Nature. 2012;490(7419):201–207. doi: 10.1038/nature11320 - DOI - PMC - PubMed
    1. Brunger AT, Choi UB, Lai Y, et al. The pre-synaptic fusion machinery. Curr Opin Struct Biol. 2019;54:179–188. doi: 10.1016/j.sbi.2019.03.007 - DOI - PMC - PubMed
    1. Alvarez-Castelao B, Schuman EM. The regulation of synaptic protein turnover. J Biol Chem. 2015;290(48):28623–28630. doi: 10.1074/jbc.R115.657130 - DOI - PMC - PubMed
    1. Truckenbrodt S, Viplav A, Jähne S, et al. Newly produced synaptic vesicle proteins are preferentially used in synaptic transmission. EMBO J. 2018;37(15):37(15. doi: 10.15252/embj.201798044 - DOI - PMC - PubMed

Publication types

Grants and funding

The work was supported by the Deutsche Forschungsgemeinschaft [SFB1286].

LinkOut - more resources