. 2023 Nov 30;97(11):e0095323.
doi: 10.1128/jvi.00953-23. Epub 2023 Oct 25.

The master antioxidant defense is activated during EBV latent infection

Affiliations

The master antioxidant defense is activated during EBV latent infection

Ling Wang et al. J Virol. .

Abstract

To our knowledge, this is the first report delineating the activation of the master antioxidant defense during EBV latency. We show that EBV-triggered reactive oxygen species production activates the Keap1-NRF2 pathway in EBV-transformed cells, and LMP1 plays a major role in this event, and the stress-related kinase TBK1 is required for NRF2 activation. Moreover, we show that the Keap1-NRF2 pathway is important for cell proliferation and EBV latency maintenance. Our findings disclose how EBV controls the balance between oxidative stress and antioxidant defense, which greatly improve our understanding of EBV latency and pathogenesis and may be leveraged to opportunities toward the improvement of therapeutic outcomes in EBV-associated diseases.

Keywords: EBV; Keap1; NRF2; antioxidant stress.


Conflict of interest statement

The authors declare no conflict of interest.

Figures

Fig 1
Fig 1
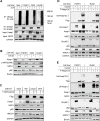
The Keap1-NRF2 antioxidant defense activity is associated with EBV latency programs. (A) Endogenous activity of the Keap1-NRF2 pathway in different cell lines with T1L vs T3L, EBV vs EBV+, or HTLV1 vs HTLV1+, was evaluated by IB with indicated antibodies. (B and C) Cell lines with T1L or without EBV/HTLV1 were treated with 20 mM of the catalase inhibitor 3-amino-1,2,4-triazole (3-AT) (Fisher Scientific) or vehicle control for 48 h, followed by analysis of the Keap1-NRF2 pathway activity using IB with indicated antibodies (B) and qPCR (C). (D) Cell lines with T3L or HTLV1+ were treated with 3 mM of the antioxidant N-acetylcysteine amide (NACA) (Sigma) or vehicle control for 30 h, followed by analysis of the Keap1-NRF2 pathway activity using IB with indicated antibodies.
Fig 2
Fig 2
Endogenous ROS is responsible for activation of Keap1-NRF2 pathway. (A) Cell lines with T1L or without EBV/HTLV1 were treated with 20 mM 3-AT or vehicle control for 48 h. Cells were then subjected to IP and subsequent IB with indicated antibodies. (B) Cell lines with T1L or without EBV/HTLV1 were treated with 150 µM CoCl2 or vehicle control for 8 h before harvest, followed by IB with indicated antibodies. (C) Cell lines with T3L (or HTLV1+) were transfected with 3Flag-NRF2(Δ16). Forty-eight hours post-transfection, cells were harvested for IB with indicated antibodies. (D) P3HR1 and BJAB cells were transfected with 3Flag-Keap1ΔC. Sixteen hours post-transfection, cells were treated with 150 µM CoCl2 or vehicle control for 8 h before harvest, followed by IB with indicated antibodies. (E) P3HR1 and BJAB cells were transfected with 3Flag-Keap1CS. Sixteen hours post-transfection, cells were treated with 150 µM CoCl2 or vehicle control for 8 h before harvest, followed by IB with indicated antibodies.
Fig 3
Fig 3
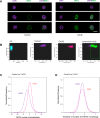
NRF2 nuclear translocation in response to ROS. SavI cells were treated with 150 µM CoCl2 for 8 hr. Cells were fixed with 4% paraformaldehyde and permeabilized with PBS and 0.1% triton X-100. Cells were then immunostained with 1:100 rabbit NRF2 (Cell Signaling Technology), followed by incubation with 1:300 antirabbit Alexa 555 secondary antibody (Invitrogen). Nucleus was stained by DAPI (ThermoFisher). Cells were then subjected to Amnis Imaging Flow analysis. (A) Single-cell imaging was acquired, image galleries were automatically generated by the IDEAS software, version 6.2, and representative galleries of single cells from control and CoCl2 treatments were selected with no modifications or computational processing. Bar = 10 µm. (B) Gating of populations according to best focus, single cells, and double positives is shown. (C and D) NRF2 nuclear localization and distribution are shown, respectively.
Fig 4
Fig 4
LMP1 plays a major role in the activation of the Keap1-NRF2 pathway in EBV latency. (A and B) Cell lines with T3L or with HTLV1 infection were treated with 50 nM of the p38-specific inhibitor SB202190 (or vehicle control) for 24 h, followed by IB with indicated antibodies (A) and flow cytometry for cellular ROS measurement (B). (C) BJAB and P3HR1 cells were transfected with Flag-LMP1. Twenty-four hours post-transfection, cells were treated with 50 nM SB202190 (or vehicle control) for 24 h before harvest, followed by IB with indicated antibodies. (D) BJAB and P3HR1 cells were transfected with Flag-LMP1 or its deletion mutants. Forty-eight hours post-transfection, cells were harvested for IB with indicated antibodies.
Fig 5
Fig 5
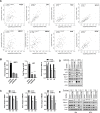
Mitochondrial dysfunction is crucial for activation of the Keap1-NRF2 pathway. Mitochondrial DNA (mtDNA) and functions were quantitively evaluated as described in Materials and Methods section. (A) Mitochondrial DNA contents, ATP production, and ROS production were compared in T1L vs T3L, and also in HTLV1 vs HTLV1+ T cell lines. (B). Mitochondrial OCR (oxygen consumption rate) was compared in T1L vs T3L, and also in HTLV1− vs HTLV1+ T cell lines. (C and D) Keap1-NRF2 pathway activity in response to antimycin treatment in cell lines with T1L (or HTLV1) or mitoquinone (mitoQ) treatment in cell lines with T3L (or HTLV1+), respectively, was evaluated by IB with indicated antibodies.
Fig 6
Fig 6
TBK1 is required for activating the Keap1-NRF2 pathway in EBV latency. (A) Cell lines with T3L (or HTLV1+) were treated with 2 µM of the highly selective and potent TBK1 inhibitor GSK8612 for 12 h, followed by IB analysis for activity of the Keap1-NRF2 pathway with indicated antibodies. (B) IB4 and MT4 cell lines were infected with lentiviruses harboring TBK1 sgRNA and SpCas9, followed by selection with puromycin (1.0 µg/mL) for 2 weeks. Selected cells were then subjected to IB with indicated antibodies for activity of the Keap1-NRF2 pathway. (C) Indicated cell lines were treated with 3 mM NACA (Sigma) or vehicle control for 30 h, and TBK1 activity [p-TBK1(S172)] was evaluated by IB.
Fig 7
Fig 7
NRF2 depletion downregulates EBV-targeted antioxidant genes. (A) Algorithm analysis of 174 EBV-transformed LCLs shows that NRF2 is correlated with EBV-regulated antioxidant genes at the transcriptional level. (B–E) shRNA-mediated NRF2 depletion in IB4 and MT4 cells downregulates EBV-targeted antioxidant genes. IB4 and MT4 cell lines stably expressing shNRF2 or shRNA control were treated with 1 µg/mL doxycycline (Dox) for 0, 3, and 5 days to induce shRNA expression. Gene expression was evaluated by qPCR or IB 3 days after Dox treatment if not otherwise indicated. Cells with shNRF2#2 were used for qPCR.
Fig 8
Fig 8
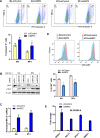
Loss of NRF2 impairs EBV-mediated oncogenic functions. (A) IB4 and MT4 cell lines stably expressing shNRF2 (#2) or shRNA control were subjected to FITC-Annexin V binding assay by flow cytometry after 1 µg/mL Dox treatment for 3 days. (B and C). IB4 and MT4 cell lines stably expressing shNRF2 or shRNA control were analyzed for DNA damage (γH2X) (B) and for cellular ROS production (C) after 1 µg/mL Dox treatment for 3 days. (D). IB4 and MT4 cell lines stably expressing shNRF2 (#2) or shRNA control were evaluated by flow cytometry for APC-Ki67 expression. (E) BL30-B95.8 cells stably expressing shNRF2 (#2) or shRNA control were analyzed by qPCR for indicated viral gene expression for EBV reactivation.
Fig 9
Fig 9
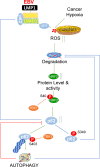
A diagram showing activation of Keap1-NRF2 pathway by EBV latent infection. LMP1 stimulates mitochondrial ROS production through the AP1 signaling axis, promoting Keap1 autophagic degradation and consequent NRF2 activation, which then transcriptionally regulates the expression of antioxidant genes including p62. In return, p62 induces autophagy and promotes Keap1-NRF2 and LMP1 signal transduction.

Similar articles

References

    1. Ray PD, Huang BW, Tsuji Y. 2012. Reactive oxygen species (ROS) homeostasis and redox regulation in cellular signaling. Cell Signal 24:981–990. doi:10.1016/j.cellsig.2012.01.008 - DOI - PMC - PubMed
    1. Cockfield JA, Schafer ZT. 2019. Antioxidant defenses: a context-specific vulnerability of cancer cells. Cancers (Basel) 11:1208. doi:10.3390/cancers11081208 - DOI - PMC - PubMed
    1. Nakamura H, Takada K. 2021. Reactive oxygen species in cancer: current findings and future directions. Cancer Sci 112:3945–3952. doi:10.1111/cas.15068 - DOI - PMC - PubMed
    1. Panieri E, Santoro MM. 2016. ROS homeostasis and metabolism: a dangerous liason in cancer cells. Cell Death Dis 7:e2253. doi:10.1038/cddis.2016.105 - DOI - PMC - PubMed
    1. Sallmyr A, Fan J, Rassool FV. 2008. Genomic instability in myeloid malignancies: increased reactive oxygen species (ROS), DNA double strand breaks (DSBs) and error-prone repair. Cancer Lett. 270:1–9. doi:10.1016/j.canlet.2008.03.036 - DOI - PubMed

Publication types

MeSH terms

Substances