. 2023 Oct;20(207):20230444.
doi: 10.1098/rsif.2023.0444. Epub 2023 Oct 25.

Lumped parameter liver simulation to predict acute haemodynamic alterations following partial resections

Affiliations

Lumped parameter liver simulation to predict acute haemodynamic alterations following partial resections

Jeffrey Tithof et al. J R Soc Interface. 2023 Oct.

Abstract

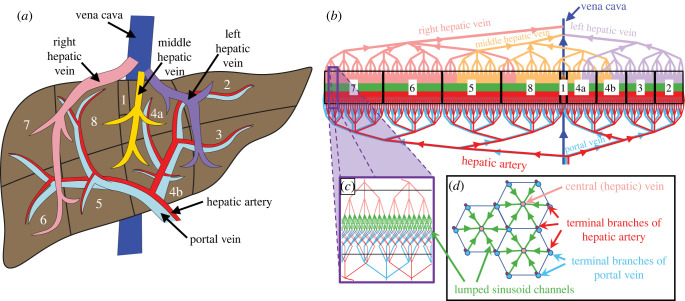
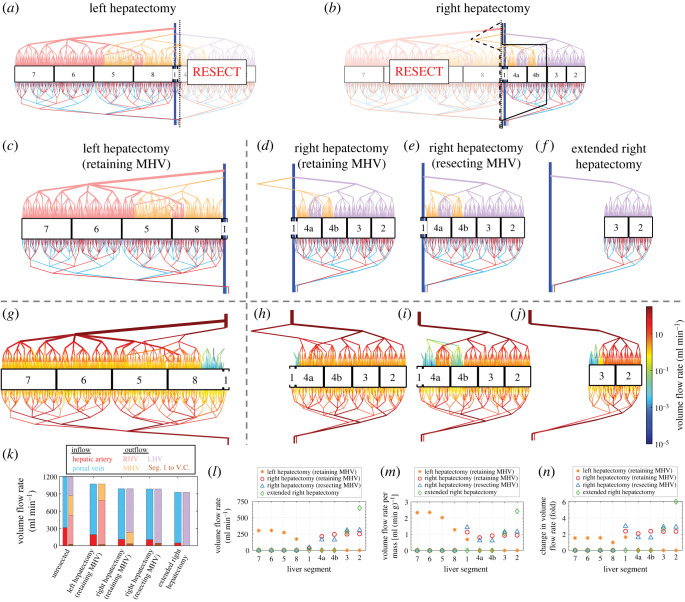
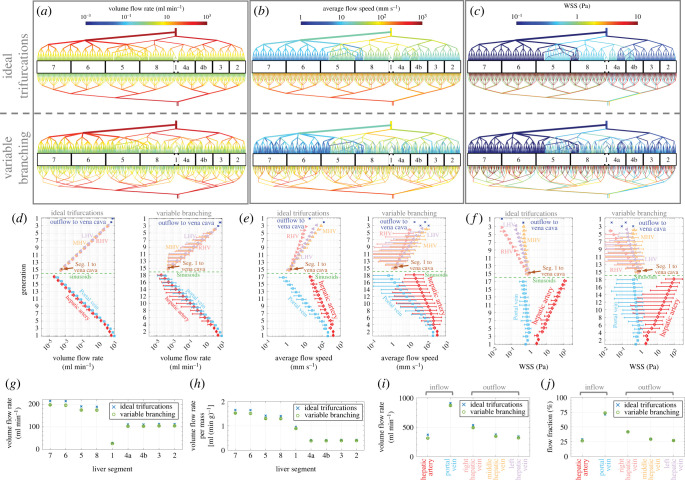
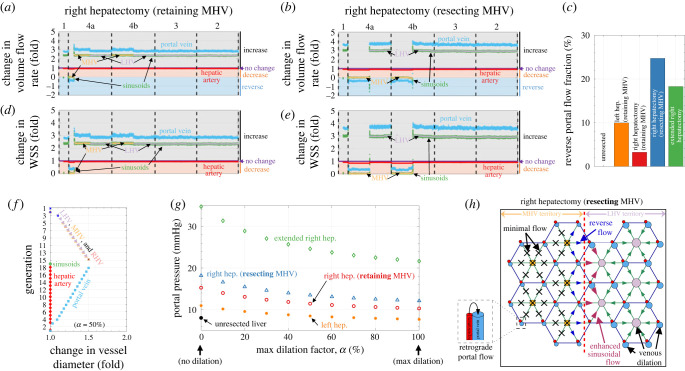
Partial liver resections are routinely performed in living donor liver transplantation and to debulk tumours in liver malignancies, but surgical decisions on vessel reconstruction for adequate inflow and outflow are challenging. Pre-operative evaluation is often limited to radiological imaging, which fails to account for post-resection haemodynamic alterations. Substantial evidence suggests post-surgical increase in local volume flow rate enhances shear stress, signalling hepatic regeneration, but excessive shear stress has been postulated to result in small for size syndrome and liver failure. Predicting haemodynamic alterations throughout the liver is particularly challenging due to the dendritic architecture of the vasculature, spanning several orders of magnitude in diameter. Therefore, we developed a mathematical lumped parameter model with realistic heterogeneities capturing inflow/outflow of the human liver to simulate acute perfusion alterations following surgical resection. Our model is parametrized using clinical measurements, relies on a single free parameter and accurately captures established perfusion characteristics. We quantify acute changes in volume flow rate, flow speed and wall shear stress following variable, realistic liver resections and make comparisons with the intact liver. Our numerical model runs in minutes and can be adapted to patient-specific anatomy, providing a novel computational tool aimed at assisting pre- and intra-operative surgical decisions for liver resections.

Keywords: haemodynamics; hepatic blood flow; liver resection; lumped parameter model.


Conflict of interest statement

The authors declare no competing interests.

Figures

Figure 1.
Figure 1.
Schematic of the realistic model of human liver blood flow. (a) An illustration of liver anatomy, highlighting the eight segments and inflow/outflow vasculature for each liver segment. (b) The numerical model developed in this study represents liver segments, labelled with white numbered boxes, arranged linearly. Box size is proportional to liver segment volume fraction (indicated in table 1). The hepatic artery, portal vein, sinusoids, vena cava and three hepatic veins are colour-coded, as indicated; these colours are used consistently throughout this article. The outflow of blood from liver segment 1 which often drains directly into the vena cava is plotted in brown and is barely visible. (c) An enlarged view of the idealized geometry of the sinusoidal microvasculature, which is obtained by considering (d) a segment of an infinite two-dimensional tiling of hexagonal lobules. Parallel branches of the hepatic artery and portal vein merge at the start of the sinusoids, with blood flowing toward a central (hepatic) vein. Each hepatic artery–portal vein is assumed to drain into three adjacent central veins, and each central vein receives blood from six adjacent hepatic artery/portal veins as is captured in our idealized network model (c). Thus, each lobule has six lumped sinusoid channels in our model. The network shown in (b) models a liver with only 730 lobules for the sake of visual simplicity and clarity.
Figure 3.
Figure 3.
Simulations of variable liver resections predicting hepatic haemodynamic alterations. (a,b) Schematics of left and right hepatectomy applied to a realistically sized network (containing five million lobules); dashed/dotted/solid black lines indicate surgical resection planes. (c–f) Schematic illustration of networks following (c) left hepatectomy (33% resection) or (d–f) three variations of a right hepatectomy (67%, 67% and 84% resection, respectively), as indicated. (g–j) Schematic plots with colour, encoding the volume flow rate. The colour bar at the far right corresponds to all four plots. (k–n) Plots of the (k,l) volume flow rate, (m) volume flow rate per unit mass and (n) fractional change in volume flow rate for different (k) vessels and (l–n) liver segments under all four resection scenarios.
Figure 2.
Figure 2.
Comparisons of idealized trifurcations or realistic variable branching networks. (a–c) Schematics of realistically sized networks (each containing 5 million lobules) showing only the first few branching generations, with colour encoding the volume flow rate, average flow speed and wall shear stress (WSS), respectively. The top and bottom rows correspond to idealized trifurcations and realistic variable branching, as indicated. (d–f) Semilogarithmic plots of the branching generation versus the volume flow rate, average flow speed and wall shear stress with different vessel segments colour-coded and labelled. The left and right plots correspond to idealized trifurcations and realistic variable branching, as indicated. Quantities are not plotted for the lumped sinusoid channels (labelled ‘sinusoids’), which are idealized (see Methods). The uncertainty bars indicate the range of the data. (g–j) Plots of the volume flow rate and volume flow rate per unit mass for (g,h) each of the nine liver segments and (i,j) each of the five major inflow/outflow vascular networks, as indicated. The uncertainty bars for the variable branching correspond to the standard deviation across 10 simulations, indicating results are robust for the randomly generated variable branching networks. The volume flow rates and flow fractions closely approximate clinical observations.
Figure 4.
Figure 4.
Quantification of perfusion alterations for variable liver resections. (a,b) Plots of the factor by which volume flow rate changes in the resected liver, compared with the unresected liver, for each vessel (colour-coded) in each liver segment (labelled and divided by dashed black lines) following right hepatectomy with MHV (a) retention or (b) resection. Labels at the right indicate regions in which the resected liver volume flow rate increases, is unchanged, decreases, or reverses. Quantities are plotted seven generations from the sinusoids. (c) The total percentage of portal vein segments which exhibit retrograde flow in each indicated resection scenario. (d,e) Plots analogous to (a,b), but for wall shear stress. (f) A plot of the dilation, for α = 50%, as a function of generation applied to each colour-coded vessel. Note that dilation is implemented for only the portal and hepatic veins. (g) Plots of the portal pressure as a function of the maximum dilation factor α for all four resections. (h) A schematic illustrating the key features of altered haemodynamics obtained in our model for right hepatectomy with MHV resection. Note that the corresponding unresected liver has five million lobules, and lumped sinusoid channels are labelled only as ‘sinusoids’ for the sake of concise labelling.

Similar articles

References

    1. Lautt WW. 2009. Hepatic circulation: physiology and pathophysiology. In Colloquium series on integrated systems physiology: from molecule to function to disease (eds D Granger, JP Granger). San Rafael, CA: Morgan & Claypool Life Sciences. Copyright © 2010 by Morgan & Claypool Life Sciences.
    1. Couinaud C. 1992. The anatomy of the liver. Ann. Ital. Chir. 63, 693-697. - PubMed
    1. Kiernan F. 1834. Kiernan on the anatomy and physiology of the liver. Med. Chir. Rev. 20, 305-315. - PMC - PubMed
    1. Teutsch HF, Schuerfeld D, Groezinger E. 1999. Three-dimensional reconstruction of parenchymal units in the liver of the rat. Hepatology 29, 494-505. (10.1002/hep.510290243) - DOI - PubMed
    1. Dahmen U, Hall CA, Madrahimov N, Milekhin V, Dirsch O. 2007. Regulation of hepatic microcirculation in stepwise liver resection. Acta Gastroenterol. Belg. 70, 345-351. - PubMed

Publication types

LinkOut - more resources