. 2023 Oct 31;42(10):113254.
doi: 10.1016/j.celrep.2023.113254. Epub 2023 Oct 17.

Blocking of ebolavirus spread through intercellular connections by an MPER-specific antibody depends on BST2/tetherin

Affiliations

Blocking of ebolavirus spread through intercellular connections by an MPER-specific antibody depends on BST2/tetherin

Rodrigo I Santos et al. Cell Rep. .

Abstract

Ebola virus (EBOV) and Bundibugyo virus (BDBV) belong to the family Filoviridae and cause a severe disease in humans. We previously isolated a large panel of monoclonal antibodies from B cells of human survivors from the 2007 Uganda BDBV outbreak, 16 survivors from the 2014 EBOV outbreak in the Democratic Republic of the Congo, and one survivor from the West African 2013-2016 EBOV epidemic. Here, we demonstrate that EBOV and BDBV are capable of spreading to neighboring cells through intercellular connections in a process that depends upon actin and T cell immunoglobulin and mucin 1 protein. We quantify spread through intercellular connections by immunofluorescence microscopy and flow cytometry. One of the antibodies, BDBV223, specific to the membrane-proximal external region, induces virus accumulation at the plasma membrane. The inhibiting activity of BDBV223 depends on BST2/tetherin.

Keywords: BST2; CP: Immunology; CP: Microbiology; Ebola virus; MPER; TIM-1; cell-to-cell transmission; intercellular connections; monoclonal antibodies; tetherin; virus egress.


Conflict of interest statement

Declaration of interests The authors declare no competing interests.

Figures
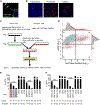
Figure 1.
Figure 1.. Mechanistic analysis of ebolavirus spread through intercellular connections
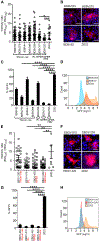
(A) Fluorescent microscopy showing a Huh7 intercellular connection (white arrow) filled with BDBV antigens (gray) co-localized with actin-GFP (green). MOI of0.01 PFU/cell, 3 days post infection. Bar represents 20 μm. (B) Abrogation of ebolavirus spread in Huh7 cells through intercellular connections by cytochalasin D but not by nocodazole. MOI 0.01 PFU/cell, 3 days post infection. Red, BDBV; blue (DAPI), nuclei. Bar represents 100 μm. (C) Experimental layout for (D)–(F). (D) Flow cytometry histogram: the samples are highlighted in (E) and (F). (E and F) Importance of Tim-1 in the intercellular connection spread of BDBV (E) or EBOV (F); Sc, scrambled, Huh7.5; e2, Tim1 KO Huh7.5, deletion exon 2; e3, Tim1 KO Huh7.5, deletion exon 3. p values were calculated by one-way ANOVA (Tukey’s post test): **p < 0.01, ***p < 0.001.
Figure 2.
Figure 2.. GP2-specific antibodies block spread of EBOV through intercellular connections
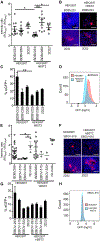
Huh7 cells were inoculated with WT BDBV (A and B), eGFP-expressing EBOV/BDBV-GP (C and D), WT EBOV (E and F), or eGFP-expressing EBOV (G and H). After 4 h of infection, the monolayers were washed, the mAbs (epitope specificities are indicated in red) were added at 50 μg/mL, and the cells were incubated for 4 days. The monolayers were fixed, immunostained, and analyzed by fluorescence microscopy (A, B, E, and F) or flow cytometry for GFP quantification (C, D, G, and H). p values were calculated by one-way ANOVA (Dunnett’s post test): *p < 0.05, **p < 0.01, ***p < 0.001, ****p < 0.0001. (B and F) Bars correspond to 40 μm. Foci were defined as continuous positive cell groups presumably originating from one initial infected cell. (A and E) Intensity ratio is defined as ROItotal/ROIinitial; see Figure S1 for the experimental layout.
Figure 3.
Figure 3.. Antibodies can block viral spread in HeLa cells with high endogenous BST2 level
(A) The indicated cell lines were stained with either an antibody specific to human BST2 conjugated with phycoerythrin or an isotype control antibody and analyzed by flow cytometry to calculate the percentages of phycoerythrin-positive cells in the total cell population. Representative histograms are shown. (B) HeLa cells were inoculated with EBOV-eGFP at an MOI of 0.1 PFU/cell. After 3 h of infection, the monolayers were washed, and the mAbs were added at the indicated concentrations. The fluorescence intensity of infected cells was measured at 4 dpi. Data represent mean ± SEM based on n = 3. The p values were calculated by one-way ANOVA (Tukey’s post test): *p < 0.01, **p < 0.001, ***p < 0.0001, compared to the irrelevant control antibody 2D22 at the corresponding concentration. Representative UV microscopic images are shown.
Figure 4.
Figure 4.. BST2 complements the effect of BDBV223 on inhibition of virus spread through intercellular connections
HEK293T cells were inoculated with WT BDBV (A and B), eGFP-expressing EBOV/BDBV-GP (C and D), WT EBOV (E and F), or eGFP-expressing EBOV (G and H). After 4-h-long incubation with viruses, the monolayers were washed, and mAbs at 50 μg/mL were added to the monolayers. After 3 days, the monolayers were fixed, immunostained, and analyzed by fluorescence microscopy (A, B, E, and F) or flow cytometry for GFP quantification (C, D, G, and H). p values were calculated by one-way ANOVA (Tukey’s post test): **p < 0.01, ***p < 0.001. (B and F) bars correspond to 40 mm. Foci were defined as in Figure 2. In (A) and (E), the intensity ratio is defined as ROItotal/ROIinitial; see Figure S1 for the experimental layout.
Figure 5.
Figure 5.. The BDBV223 mAb cooperates with BST2 to limit egress of the viral particles
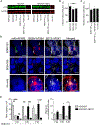
(A) Western blot analysis of VP40 accumulation in HEK293T and HEK293T-hBST2 cells. VLPs were generated by transfection of EBOV VP40 and NP and BDBV GP (WT or escape mutant for BDBV223) plasmids to HEK293T or HEK293T-hBST2. After 3 days, cells were lysed, and viral proteins were separated in SDS-polyacrylamide gel. Western blots were immunostained for VP40, and band quantification was performed using LICOR Odyssey FC Imaging System. (B) Mean intensity values for VLPs with WT GP. (C) Mean intensity values for VLPs with the GP escape mutant. Graphs were plotted based on three independent experiments. (D) The BDBV223 antibody results in colocalization of BDBV with BST2. Monolayers of HEK293T-hBST2 cells were incubated with WT BDBV for 3 h and washed, and mAbs were added at 50 μg/mL. In 72 h, cells were fixed, and BDBV, BST2, and mAbs were immunostained. Red, BDBV; green, mAbs; gray, BST2; blue, cell nuclei. White arrows indicate colocalization of mAb, virus, and BST2; white arrowheads indicate that the virus and BST2 do not colocalize in the absence of BDBV223. Bar represents 30 μm. (E) Virus egress inhibition by the BDBV223 mAb is stronger in presence of BST2. HEK293T and HEK293T-hBST2 cells were inoculated with VSV/BDBV-GP at an MOI of 0.01 PFU/cell, and BDBV223 was added to cell medium at 1 μg/mL. Viral RNA levels in cell culture supernatants were determined by droplet digital RT-PCR at the indicated time points. Data represent mean ± SEM based on n = 3. The p values were calculated by one-way ANOVA (Tukey’s post test): *p < 0.05, **p < 0.01, ***p < 0.001, ****p < 0.0001; ns, not significant.
Figure 6.
Figure 6.. Effect of escape mutations on viral susceptibility to antibodies and viral spread through intercellular connections
Huh7 cells were inoculated with different escape mutants, and the infected intercellular connection foci were analyzed by microscopy (A and D) or flow cytometry (B and E). Selected images from fluorescent microscopy analysis are shown in (C) and (F). (A–C) Escape mutant for BDBV223 mAb. (D and F) Escape mutant for EBOV-515. Note that the mAbs were added to prevent spread of the virus through the medium and otherwise were not expected to affect interpretation of the data. The p values were calculated by one-way ANOVA (Tukey’s post test): ***p < 0.001. Bars correspond to 40 0m.
Figure 7.
Figure 7.. Model of inhibition of ebolavirus spread through intercellular connections by BDBV223
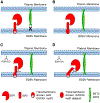
(A) In the absence of BDBV223, BST2 in the plasma membrane cannot tether ebolavirus envelope. (B) Deletions in the motif GXXXA in the GP transmembrane domain block the ebolavirus antagonism for BST2; consequently, BST2 GPI anchors the ebolavirus envelope to the plasma membrane blocking viral egress. (C) The direct competition model: BDBV223 binding to GP abrogates BST2 antagonism by blocking access of the GP GXXXA motif to BST2. (D) The conformational change model: BDBV223 binding to GP abrogates BST2 antagonism by changing the GP three-dimensional structure, resulting in blocking of the GXXXA motif’s access to BST2.

Similar articles

Cited by

References

    1. Amarasinghe GK, Bào Y, Basler CF, Bavari S, Beer M, Bejerman N, Blasdell KR, Bochnowski A, Briese T, Bukreyev A, et al. (2017). Taxonomy of the order Mononegavirales: update 2017. Arch. Virol. 162, 2493–2504. 10.1007/s00705-017-3311-7. - DOI - PMC - PubMed
    1. Goldstein T, Anthony SJ, Gbakima A, Bird BH, Bangura J, Tremeau-Bravard A, Belaganahalli MN, Wells HL, Dhanota JK, Liang E, et al. (2018). The discovery of Bombali virus adds further support for bats as hosts of ebolaviruses. Nat. Microbiol. 3, 1084–1089. 10.1038/s41564-018-0227-2. - DOI - PMC - PubMed
    1. Aleksandrowicz P, Marzi A, Biedenkopf N, Beimforde N, Becker S, Hoenen T, Feldmann H, and Schnittler HJ (2011). Ebola virus enters host cells by macropinocytosis and clathrin-mediated endocytosis. J. Infect. Dis. 204, S957–S967. 10.1093/infdis/jir326. - DOI - PMC - PubMed
    1. Nanbo A, Watanabe S, Halfmann P, and Kawaoka Y (2013). The spatio-temporal distribution dynamics of Ebola virus proteins and RNA in infected cells. Sci. Rep. 3, 1206. 10.1038/srep01206. - DOI - PMC - PubMed
    1. Saeed MF, Kolokoltsov AA, Albrecht T, and Davey RA (2010). Cellular entry of ebola virus involves uptake by a macropinocytosis-like mechanism and subsequent trafficking through early and late endosomes. PLoS Pathog. 6, e1001110. 10.1371/journal.ppat.1001110. - DOI - PMC - PubMed

Publication types