Deep UV Microscopy Identifies Prostatic Basal Cells: An Important Biomarker for Prostate Cancer Diagnostics
- PMID: 37850167
- PMCID: PMC10521648
- DOI: 10.34133/2022/9847962
Deep UV Microscopy Identifies Prostatic Basal Cells: An Important Biomarker for Prostate Cancer Diagnostics
Abstract
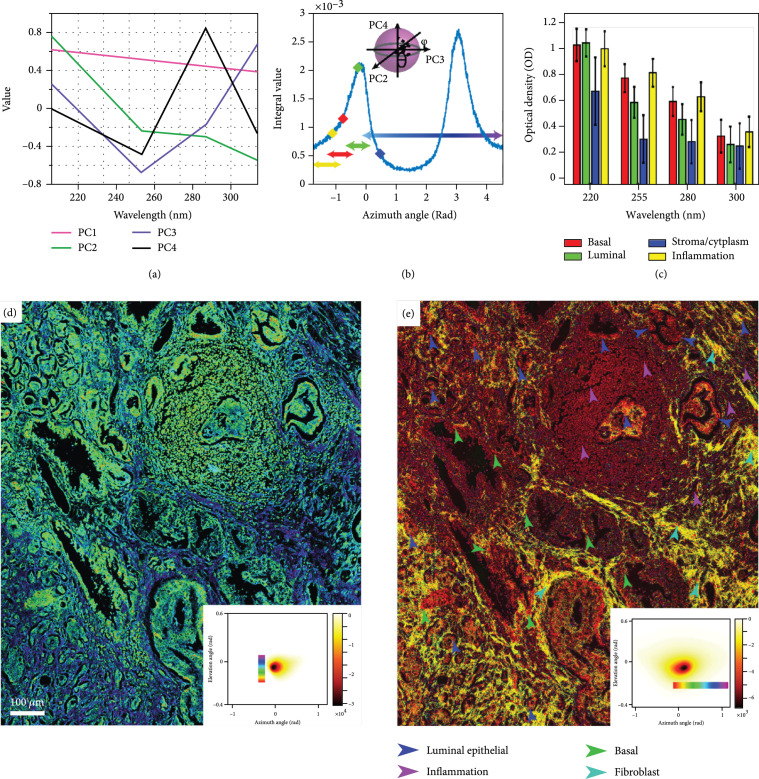
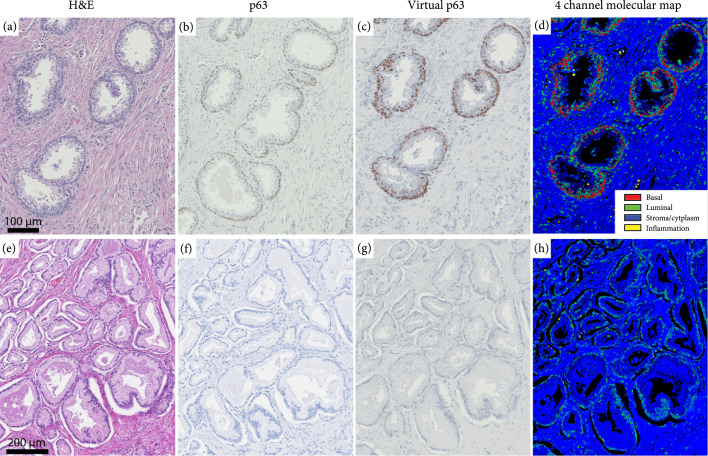
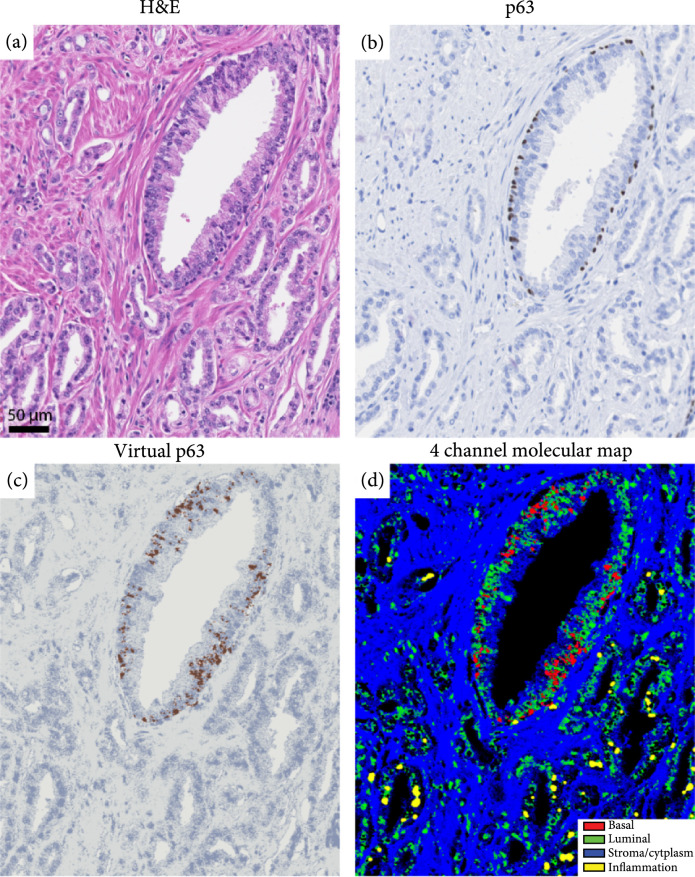
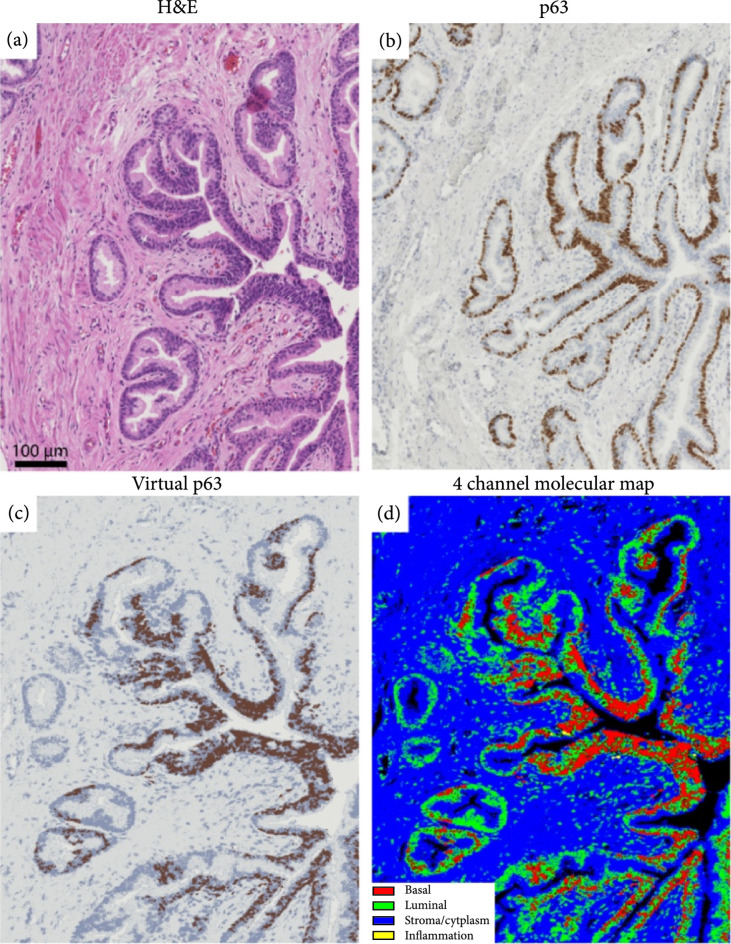
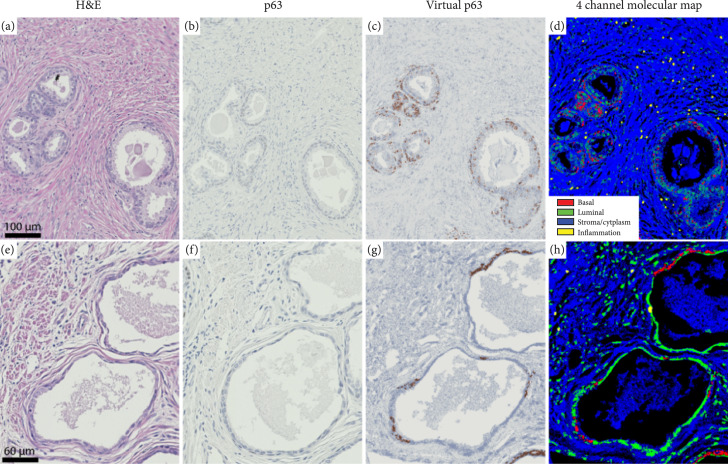
Objective and Impact Statement. Identifying benign mimics of prostatic adenocarcinoma remains a significant diagnostic challenge. In this work, we developed an approach based on label-free, high-resolution molecular imaging with multispectral deep ultraviolet (UV) microscopy which identifies important prostate tissue components, including basal cells. This work has significant implications towards improving the pathologic assessment and diagnosis of prostate cancer. Introduction. One of the most important indicators of prostate cancer is the absence of basal cells in glands and ducts. However, identifying basal cells using hematoxylin and eosin (H&E) stains, which is the standard of care, can be difficult in a subset of cases. In such situations, pathologists often resort to immunohistochemical (IHC) stains for a definitive diagnosis. However, IHC is expensive and time-consuming and requires more tissue sections which may not be available. In addition, IHC is subject to false-negative or false-positive stains which can potentially lead to an incorrect diagnosis. Methods. We leverage the rich molecular information of label-free multispectral deep UV microscopy to uniquely identify basal cells, luminal cells, and inflammatory cells. The method applies an unsupervised geometrical representation of principal component analysis to separate the various components of prostate tissue leading to multiple image representations of the molecular information. Results. Our results show that this method accurately and efficiently identifies benign and malignant glands with high fidelity, free of any staining procedures, based on the presence or absence of basal cells. We further use the molecular information to directly generate a high-resolution virtual IHC stain that clearly identifies basal cells, even in cases where IHC stains fail. Conclusion. Our simple, low-cost, and label-free deep UV method has the potential to improve and facilitate prostate cancer diagnosis by enabling robust identification of basal cells and other important prostate tissue components.
Copyright © 2022 Soheil Soltani et al.
Conflict of interest statement
Dr. Robles has a financial interest in Cellia Science, the company that holds a licensing agreement for part of the technology described in this study. The terms of this arrangement have been reviewed and approved by Georgia Tech in accordance with its conflict of interest policies.
Figures

Similar articles
-
Prostate cancer histopathology using label-free multispectral deep-UV microscopy quantifies phenotypes of tumor aggressiveness and enables multiple diagnostic virtual stains.Sci Rep. 2022 Jun 4;12(1):9329. doi: 10.1038/s41598-022-13332-9. Sci Rep. 2022. PMID: 35665770 Free PMC article.
-
How often does alpha-methylacyl-CoA-racemase contribute to resolving an atypical diagnosis on prostate needle biopsy beyond that provided by basal cell markers?Am J Surg Pathol. 2004 Feb;28(2):239-43. doi: 10.1097/00000478-200402000-00012. Am J Surg Pathol. 2004. PMID: 15043314
-
Basal cell cocktail (34betaE12 + p63) improves the detection of prostate basal cells.Am J Surg Pathol. 2003 Mar;27(3):365-71. doi: 10.1097/00000478-200303000-00010. Am J Surg Pathol. 2003. PMID: 12604893
-
Immunohistochemistry in diagnostic surgical pathology of the prostate.Semin Diagn Pathol. 2005 Feb;22(1):88-104. doi: 10.1053/j.semdp.2005.11.001. Semin Diagn Pathol. 2005. PMID: 16512601 Review.
-
Diagnosis and reporting of limited adenocarcinoma of the prostate on needle biopsy.Mod Pathol. 2004 Mar;17(3):307-15. doi: 10.1038/modpathol.3800050. Mod Pathol. 2004. PMID: 14739905 Review.
Cited by
-
Virtual histological staining of unlabeled autopsy tissue.Nat Commun. 2024 Feb 23;15(1):1684. doi: 10.1038/s41467-024-46077-2. Nat Commun. 2024. PMID: 38396004 Free PMC article.
-
Compact and low-cost deep-ultraviolet microscope system for label-free molecular imaging and point-of-care hematological analysis.Biomed Opt Express. 2023 Feb 24;14(3):1245-1255. doi: 10.1364/BOE.482294. eCollection 2023 Mar 1. Biomed Opt Express. 2023. PMID: 36950241 Free PMC article.
-
Deep learning-assisted low-cost autofluorescence microscopy for rapid slide-free imaging with virtual histological staining.Biomed Opt Express. 2024 Mar 6;15(4):2187-2201. doi: 10.1364/BOE.515018. eCollection 2024 Apr 1. Biomed Opt Express. 2024. PMID: 38633074 Free PMC article.
-
Deep learning-enabled virtual histological staining of biological samples.Light Sci Appl. 2023 Mar 3;12(1):57. doi: 10.1038/s41377-023-01104-7. Light Sci Appl. 2023. PMID: 36864032 Free PMC article. Review.
References
-
- Surveillance,Epidemiology, and End Results (SEER) Program, National Cancer Institute: Cancer Stat Facts: Prostate Cancer, 2021
-
- Sakr W. A., Grignon D. J., Crissman J. D., Heilbrun L. K., Cassin B. J., Pontes J. J., and Haas G. P., “High grade prostatic intraepithelial neoplasia (HGPIN) and prostatic adenocarcinoma between the ages of 20-69: an autopsy study of 249 cases,” In vivo (Athens, Greece), vol. 8, no. 3, pp. 439–443, 1994 - PubMed
-
- Beltran L., Ahmad A. S., Sandu H., Kudahetti S., Soosay G., Møller H., Cuzick J., Berney D. M., and Transatlantic Prostate Group, “Histopathologic false-positive diagnoses of prostate cancer in the age of immunohistochemistry,” The American Journal of Surgical Pathology, vol. 43, no. 3, pp. 361–368, 2019 - PMC - PubMed
LinkOut - more resources
Full Text Sources