[Preprint]. 2023 Sep 28:rs.3.rs-3270664.
doi: 10.21203/rs.3.rs-3270664/v1.

Microglial over-pruning of synapses during development in autism-associated SCN2A-deficient mice and human cerebral organoids

Affiliations

Microglial over-pruning of synapses during development in autism-associated SCN2A-deficient mice and human cerebral organoids

Yang Yang et al. Res Sq. .

Update in

Abstract

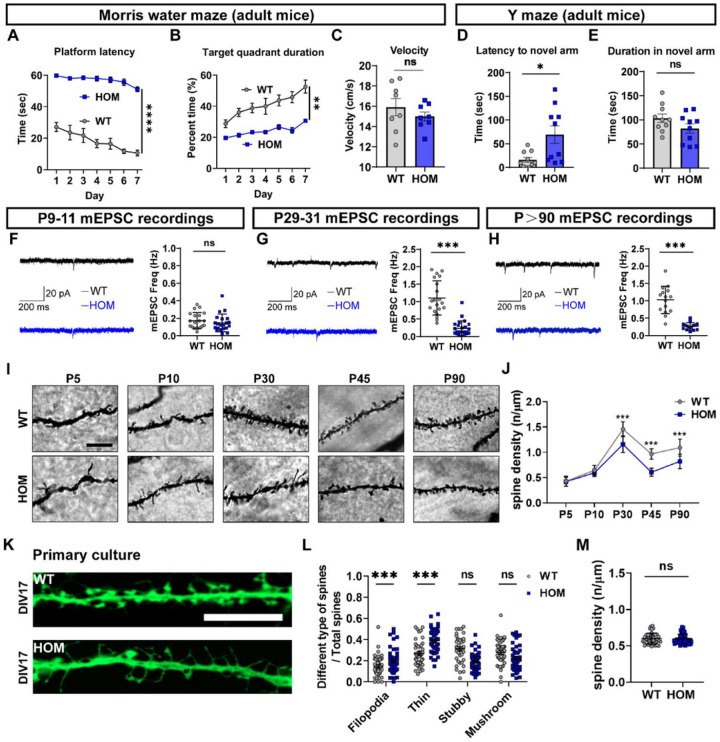
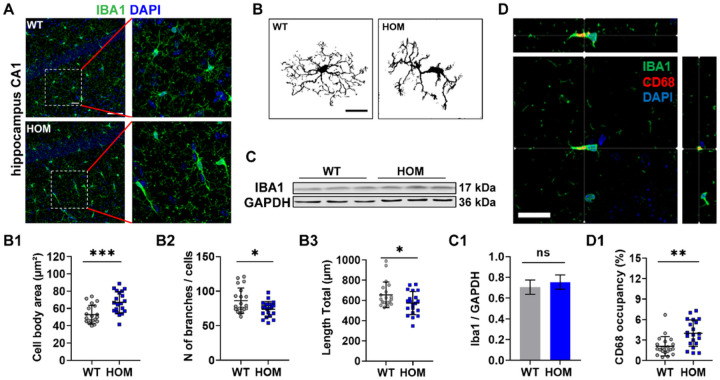
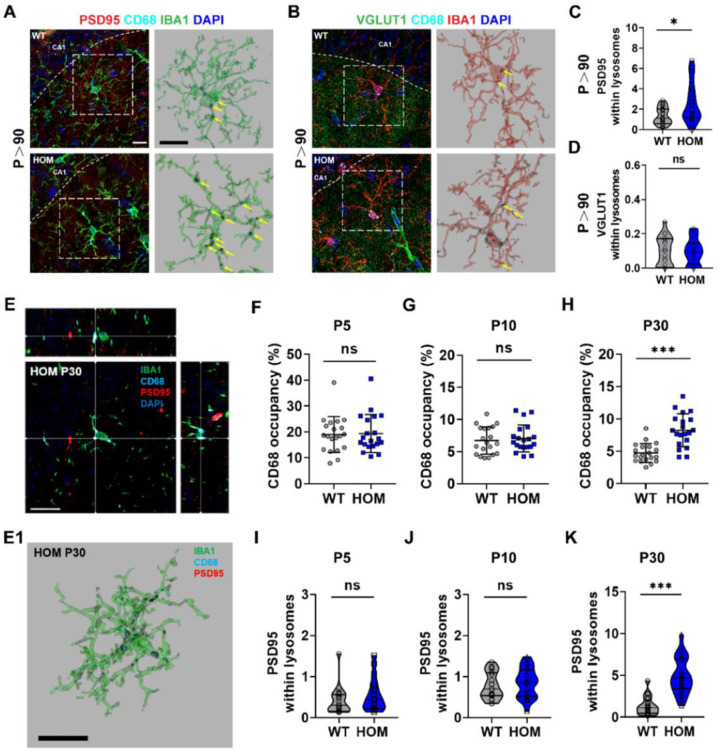
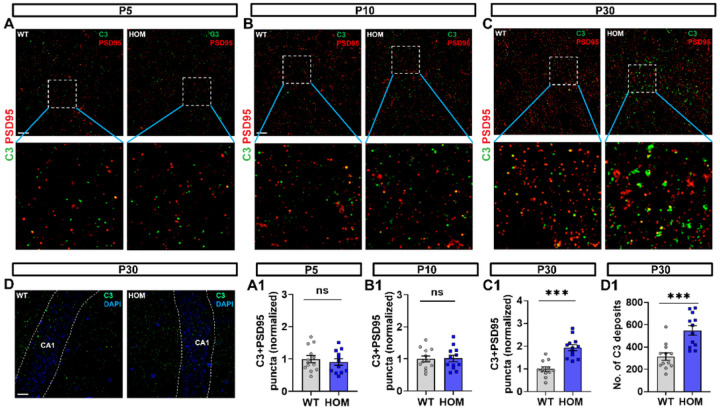
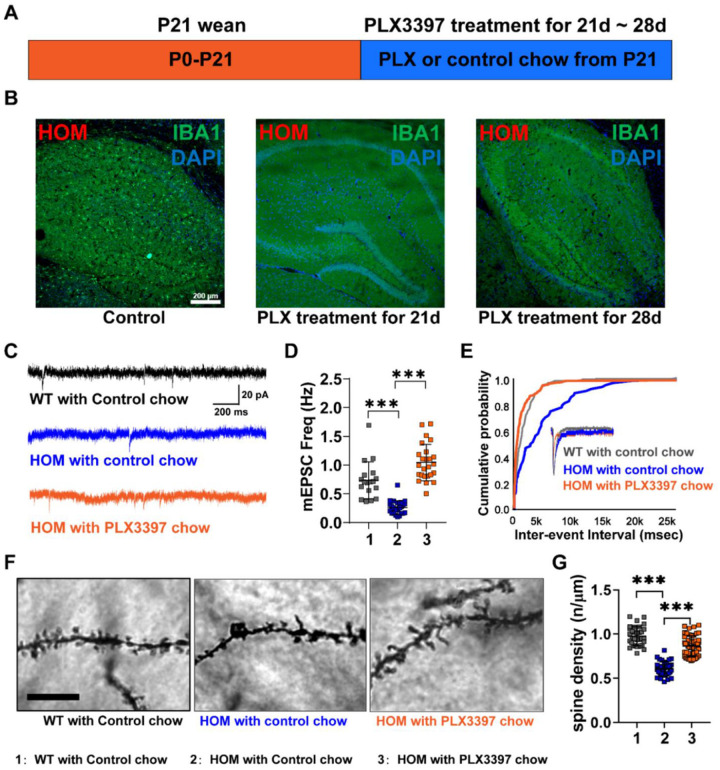
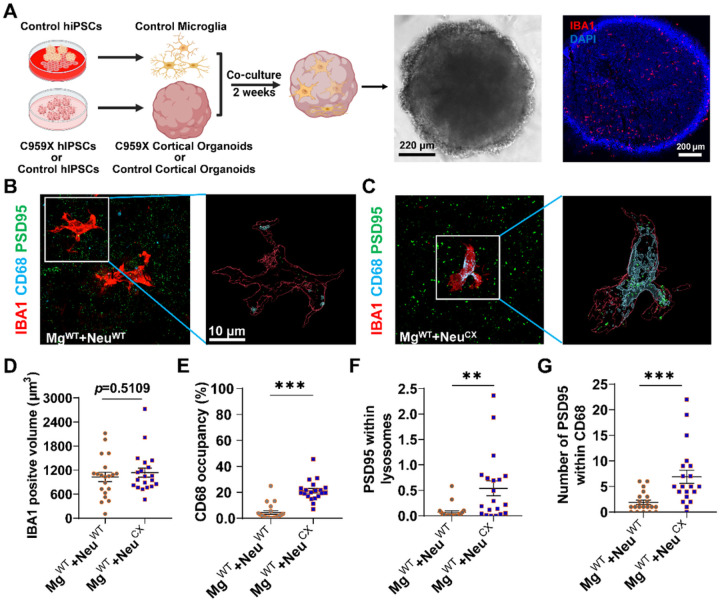
Autism spectrum disorder (ASD) is a major neurodevelopmental disorder affecting 1 in 36 children in the United States. While neurons have been the focus to understand ASD, an altered neuro-immune response in the brain may be closely associated with ASD, and a neuro-immune interaction could play a role in the disease progression. As the resident immune cells of the brain, microglia regulate brain development and homeostasis via core functions including phagocytosis of synapses. While ASD has been traditionally considered a polygenic disorder, recent large-scale human genetic studies have identified SCN2A deficiency as a leading monogenic cause of ASD and intellectual disability. We generated a Scn2a-deficient mouse model, which displays major behavioral and neuronal phenotypes. However, the role of microglia in this disease model is unknown. Here, we reported that Scn2a-deficient mice have impaired learning and memory, accompanied by reduced synaptic transmission and lower spine density in neurons of the hippocampus. Microglia in Scn2a-deficient mice are partially activated, exerting excessive phagocytic pruning of post-synapses related to the complement C3 cascades during selective developmental stages. The ablation of microglia using PLX3397 partially restores synaptic transmission and spine density. To extend our findings from rodents to human cells, we established a microglial-incorporated human cerebral organoid model carrying an SCN2A protein-truncating mutation identified in children with ASD. We found that human microglia display increased elimination of post-synapse in cerebral organoids carrying the SCN2A mutation. Our study establishes a key role of microglia in multi-species autism-associated models of SCN2A deficiency from mouse to human cells.

Keywords: Development; Microglia; Organoids; SCN2A; Synaptic pruning.


Conflict of interest statement

COMPETING INTERESTS The authors declare no conflict of interest.

Figures

Figure 1
Figure 1. Adult Scn2a-deficient (HOM) mice exhibit impaired learning and memory as well as impaired synaptic functions and structures.
(A-C) Morris water maze: (A) Platform latency (time to find the hidden platform) plotted against training day. (B) Target quadrant duration (time in the platform quadrant) plotted against training day. Repeated-measures two-way ANOVA. (C) Swimming velocity of each group. Two-way ANOVA, n=8 mice for each genotype. (D-E) Y maze: (D) Latency to novel arm (time to enter the novel arm) of each group. (E) Duration in the novel arm (time in the novel arm) of each group. Two-way ANOVA, n=10 mice for each genotype. (F-H) Representative images of mEPSCs recorded and quantitation of mEPSCs frequency in hippocampal CA1 pyramidal neurons during the development of P9–11 (F), P29–31 (G), and P>90 (H). Scale bars, 20 pA (vertical) and 200 ms (horizontal). Unpaired student’s t-test, P9–11: WT, n=20 cells/4 mice; HOM, n=20 cells/4 mice. P29–31: WT, n=20 cells/4 mice; HOM, n=20 cells/4 mice. P>90: WT, n=12 cells/3 mice; HOM, n=12 cells/3 mice. (I) Representative images of Golgi-stained apical dendrites of hippocampal CA1 pyramidal neurons at P5, P10, P30, P45, and P90. Scale bar: 10 μm. (J) Quantitation of the spine density of apical dendrites of hippocampal CA1 neurons. Unpaired student’s t-test, P5: WT, n=40 cells/5 mice; HOM, n=40 cells/5 mice. P10: WT, n=40 cells/5 mice; HOM, n=40 cells/5 mice. P30: WT, n=40 cells/5 mice; HOM, n=40 cells/5 mice. P45: WT, n=43 cells/4 mice; HOM, n=38 cells/4 mice. P90: WT, n=48 cells/6 mice; HOM, n=48 cells/6 mice. (K) Representative images of dendrites from the AAV-CaMKII virus transfected hippocampal primary cultured neurons from WT or HOM mice cultured for 17 days. (L) Quantitation of different types of spines. Unpaired student’s t-test, WT, n=42 cells from 6 mice, HOM, n=44 cells from 6 mice. (M) Quantitation of spine density of hippocampal primary cultured neurons. Unpaired student’s t-test, WT, n=42 cells from 6 mice; HOM, n=44 cells from 6 mice. Results are presented as mean ± standard error of the mean (SEM). p<0.05 (*), p<0.01 (**),p<0.001 (***), and p<0.0001 (****), ns means not significant.
Figure 2
Figure 2. Hippocampal microglia in Scn2a-deficient (HOM) mice exhibit altered morphology and increased volume of the lysosome (CD68 marker).
(A) Representative images of Iba1 labeled hippocampal microglia from WT or HOM mice. Scale bar: 20 μm. Left two panels scale bar: 40 μm, right two panels scale bar: 20 μm. (B) Representative microglial morphology of each group. (C) Representative Western blot of Iba1 and GAPDH from each group. (D) Representative orthogonal image of hippocampal microglia from adult Scn2a-deficient mice. Each cross in the three graphs represents the CD68 marker labeled microglial lysosome from three angles. Scale bar: 20 μm. (B1) Quantitation of microglial cell body area from each group. Unpaired student’s t-test, WT, n=20 cells/5 mice; HOM, n=20 cells/5 mice. (B2) Quantitation of the number of microglial branches from each group. Unpaired student’s t-test, WT, n=20 cells/5 mice; HOM, n=20 cells/5 mice. (B3) Quantitation of the total length of the microglial process from each group. Unpaired student’s t-test, WT, n=20 cells/5 mice; HOM, n=20 cells/5 mice. (C1) Quantitation of Iba1 expression compared to GAPDH between samples from WT or HOM mice. Unpaired student’s t-test, WT, n=3 mice; HOM, n=3 mice. (D1) Quantitation of CD68 positive occupancy (%) from each group. Unpaired student’s t-test, WT, n=20 cells/5 mice; HOM, n=20 cells/5 mice. Results are presented as mean ± standard error of the mean (SEM). p<0.05 (*), p<0.01 (**), and p<0.001 (***), ns means not significant.
Figure 3
Figure 3. Excessive phagocytic pruning of microglia occurs during development and continues into adulthood in the hippocampus of Scn2a-deficient (HOM) mice.
(A-B) Representative images of post-synapse engulfment (A) and pre-synapse engulfment (B) by microglia in the hippocampus from each group. Scale bar: 10 μm. (C, D) Quantitation of post-synapse engulfment (C) and pre-synapse engulfment (D) by hippocampal microglia from each group. Unpaired student’s t-test, WT, n=20 cells/5 mice; HOM, n=20 cells/5 mice. (E) Representative orthogonal image of hippocampal microglia from P30 Scn2a-deficient mice. Each intersection point in the three graphs represents the PSD95 post-synaptic marker engulfed within microglial lysosome marker CD68 from three angles. Scale bar: 20 μm. (F-H) Quantitation of CD68 positive occupancy (%) from each group at P5 (F), P10 (G), and P30 (H). Unpaired student’s t-test, P5: WT, n=20 cells/5 mice; HOM, n=20 cells/5 mice. P10: WT, n=20 cells/5 mice; HOM, n=20 cells/5 mice. P30: WT, n=20 cells/5 mice; HOM, n=20 cells/5 mice. (E1) Representative image of hippocampal microglia from P30 Scn2a-deficient mice using Imaris for 3D reconstruction. Scale bar: 20 μm. (I-K) Quantitation of post-synapse engulfment by hippocampal microglia from each group at P5 (I), P10 (J), and P30 (K). Unpaired student’s t-test, P5: WT, n=20 cells/5 mice; HOM, n=20 cells/5 mice. P10: WT, n=20 cells/5 mice; HOM, n=20 cells/5 mice. P30: WT, n=20 cells/5 mice; HOM, n=20 cells/5 mice. All results were presented as mean ± SEM. p<0.05 (*), p<0.001 (***), ns means not significant.
Figure 4
Figure 4. Complement components C3 localized to post-synapses (PSD95) in hippocampal CA1 of Scn2a-deficient (HOM) mice during development.
(A) Representative images of hippocampal CA1 immunolabeled with post-synaptic PSD95 (red) and complement component C3 (green) at P5 from each genotype. Scale bar: 10 μm. (A1) Quantitation of colocalized puncta of C3 with PSD95 at P5. Unpaired student’s t-test, n=12/3 mice for both genotypes. (B) Representative images of hippocampal CA1 immunolabeled with post-synaptic PSD95 (red) and complement component C3 (green) at P10 from each genotype. Scale bar: 10 μm. (B1) Quantitation of colocalized puncta of C3 with PSD95 at P10. Unpaired student’s t-test, n=12/3 mice for both genotypes. (C) Representative images of hippocampal CA1 immunolabeled with post-synaptic PSD95 (red) and complement component C3 (green) at P30 from each genotype. Scale bar: 10 μm. (C1) Quantitation of colocalized puncta of C3 with PSD95 at P30. Unpaired student’s t-test, n=12/3 mice for both genotypes. (D) Representative images of hippocampal CA1 immunolabeling of C3 deposits from each genotype. Scale bar: 20 μm. (D1) Quantitation of the number of C3 deposits. Unpaired student’s t-test, n=12/3 mice for both genotypes. Results were presented as mean ± SEM. p<0.05 (*), p<0.01 (**), and p<0.001 (***), ns means not significant.
Figure 5
Figure 5. Microglia depletion during development restores neural transmission and spine density of hippocampal pyramidal neurons of Scn2a-deficient (HOM) mice.
(A) Experimental timeline for microglial depletion in mice during the development. (B) Representative images of Iba1 staining in the hippocampus of control P45 HOM mice (left panel), PLX3397 treatment for 21 days (middle panel), and PLX3397 treatment for 28 days (right panel). Scale bar: 200 μm. (C) Representative mEPSCs recordings of hippocampal CA1 pyramidal neurons from each group. Scale bars, 20 pA (vertical) and 200 ms (horizontal). (D) Quantitation of mEPSCs frequency from each group. One-way ANOVA, WT with control chow: n=18 cells/3 mice; HOM with control chow: n=25 cells/5 mice; HOM with PLX3397 chow: n=25 cells/5 mice. (E) Associated cumulative probability of each group. (F) Representative images of Golgi-stained apical dendrites of hippocampal CA1 pyramidal neurons from each group. Scale bar: 10 μm. (G) Quantitation of the spine density of apical dendrites of hippocampal CA1 neurons from each group. One-way ANOVA, WT with control chow: n=33 cells/4 mice; HOM with control chow: n=38 cells/4 mice; HOM with PLX3397 chow: n=60 cells/5 mice. Results were presented as mean ± SEM. p<0.001 (***).
Figure 6
Figure 6. Increased post-synapse elimination by hiPSC-derived microglia in cortical organoid carrying autism-associated SCN2A-C959X mutation.
(A) Schematic representation of developing microglia-containing cortical organoids and representative brightfield image and Iba1 staining image. Brightfield image: scale bars, 220 μm, Iba1 staining image: scale bars, 200 μm. (B-C) Representative triple-staining images (Iba1, PSD95, and CD68) and Imaris reconstructed images from control microglia co-cultured with the control cortical organoids (B) or C959X cortical organoids (C). Scale bar, 10 μm. (D) Quantitation of Iba1 labeled microglial volume from each group. Unpaired t-test, MgWT+NeuWT, n=20 cells/5 organoids, MgWT+NeuCX, n=20 cells/5 organoids. (E) Quantitation of CD68 positive occupancy (%) from each group. Unpaired student’s t-test, MgWT+NeuWT, n=20 cells/5 organoids; MgWT+NeuCX, n=20 cells/5 organoids. (F) Quantitation of post-synapse engulfment by control microglia from each group. Unpaired student’s t-test, MgWT+NeuWT, n=20 cells/5 organoids; MgWT+NeuCX, n=20 cells/5 organoids. (G) The number of PSD95 puncta inside CD68 labeled microglial lysosome from each group. Unpaired student’s t-test, MgWT+NeuWT, n=20 cells/5 organoids; MgWT+NeuCX, n=20 cells/5 organoids. Results are presented as mean ± standard error of the mean (SEM). p<0.05 (*), p<0.01 (**), and p=0.5109 means not significant.

Similar articles

References

    1. Maenner MJ, W Z., et al., Prevalence and Characteristics of Autism Spectrum Disorder Among Children Aged 8 Years - Autism and Developmental Disabilities Monitoring Network, 11 Sites, United States, 2020., in MMWR Surveill Summ. 2023. - PMC - PubMed
    1. Rolland T., et al., Phenotypic effects of genetic variants associated with autism. Nat Med, 2023. - PMC - PubMed
    1. Qin Y., et al., Polygenic risk for autism spectrum disorder affects left amygdala activity and negative emotion in schizophrenia. Transl Psychiatry, 2020. 10(1): p. 322. - PMC - PubMed
    1. Satterstrom F.K., et al., Large-Scale Exome Sequencing Study Implicates Both Developmental and Functional Changes in the Neurobiology of Autism. Cell, 2020. 180(3): p. 568–584 e23. - PMC - PubMed
    1. Sanders S.J., et al., De novo mutations revealed by whole-exome sequencing are strongly associated with autism. Nature, 2012. 485(7397): p. 237–41. - PMC - PubMed

Publication types