. 2022 Apr:2:10400.
doi: 10.3389/adar.2022.10400. Epub 2022 Apr 25.

Sex-Dependent Synaptic Remodeling of the Somatosensory Cortex in Mice With Prenatal Methadone Exposure

Affiliations

Sex-Dependent Synaptic Remodeling of the Somatosensory Cortex in Mice With Prenatal Methadone Exposure

Gregory G Grecco et al. Adv Drug Alcohol Res. 2022 Apr.

Abstract

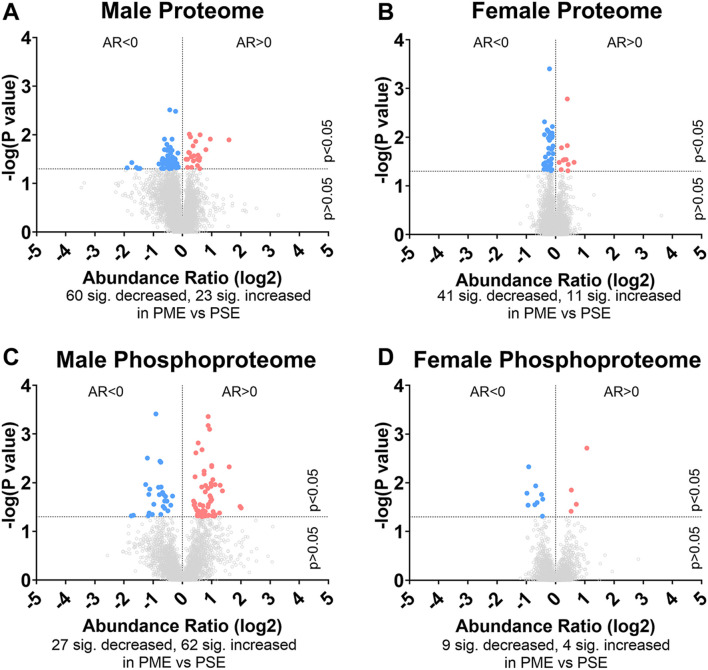
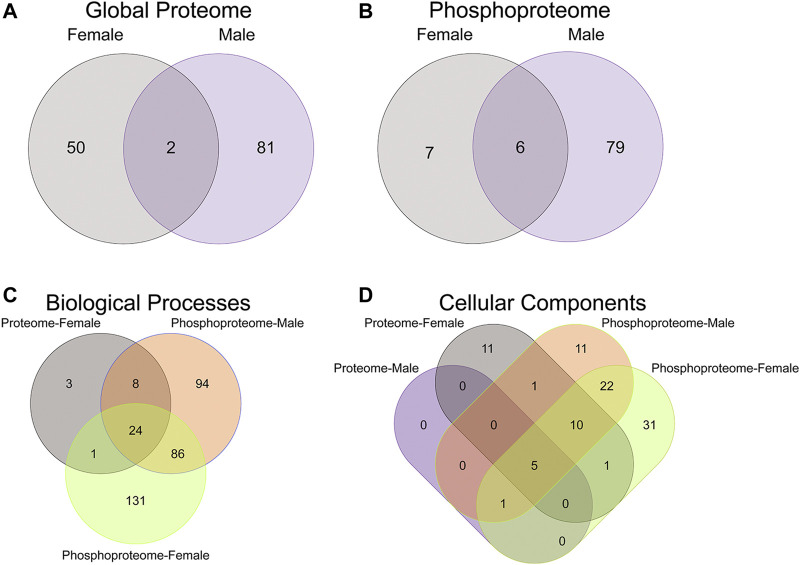
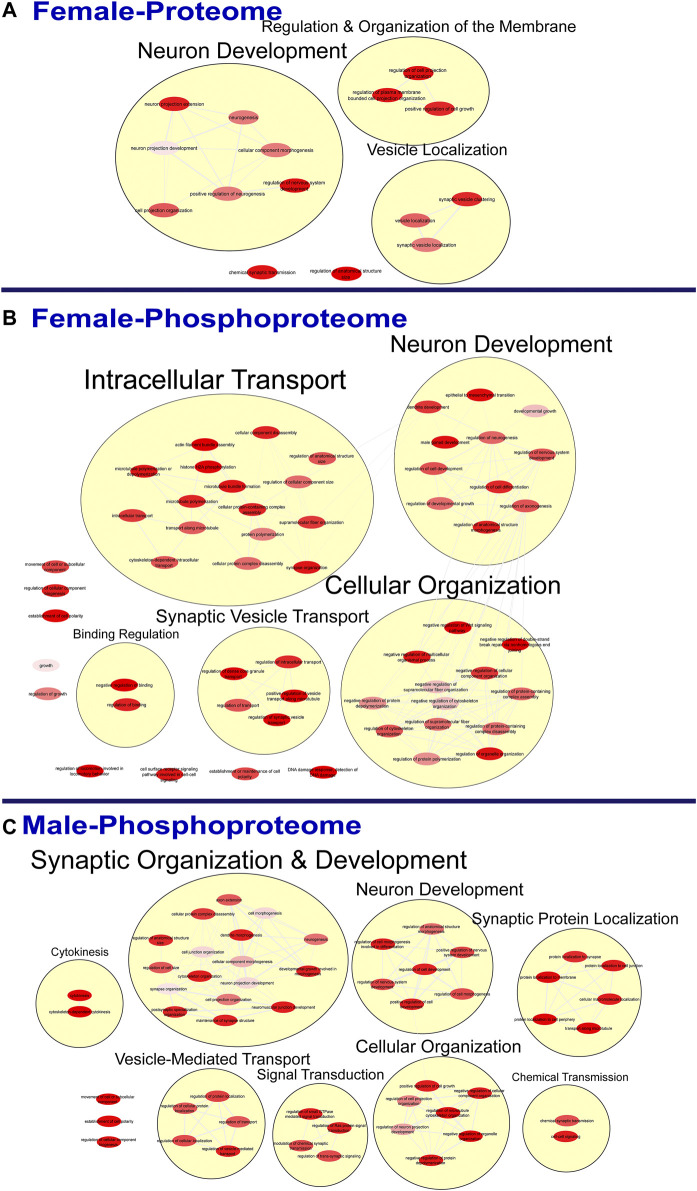
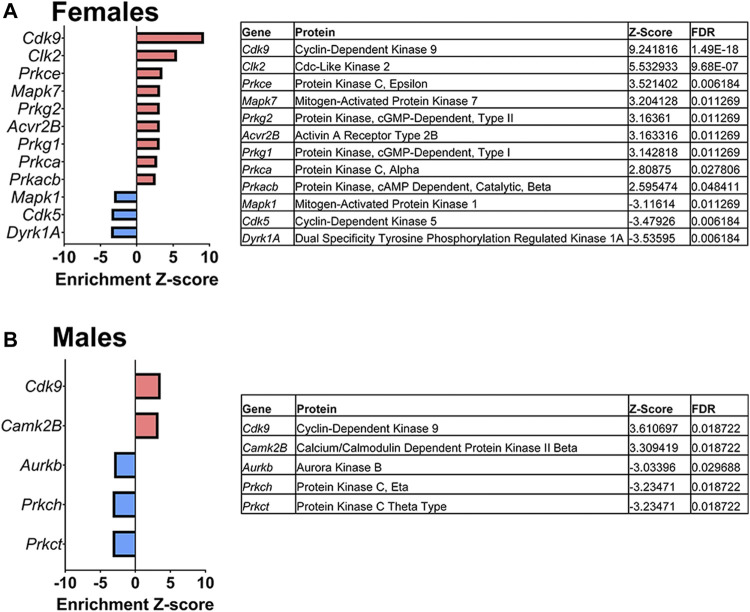
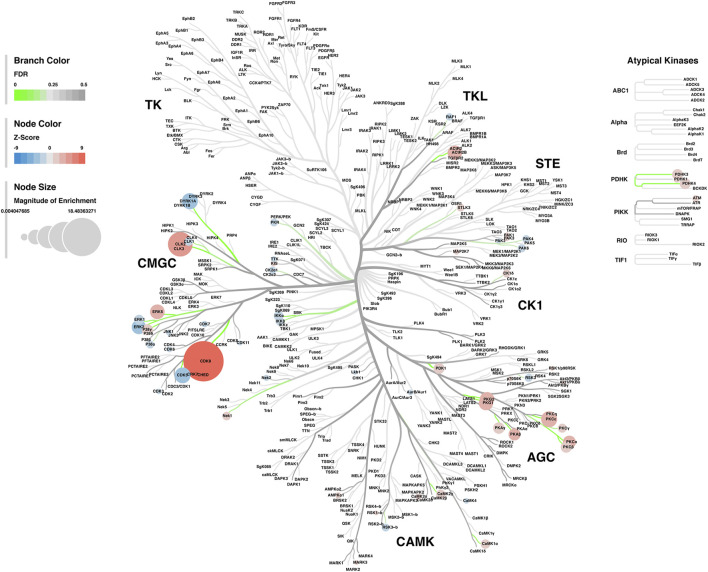
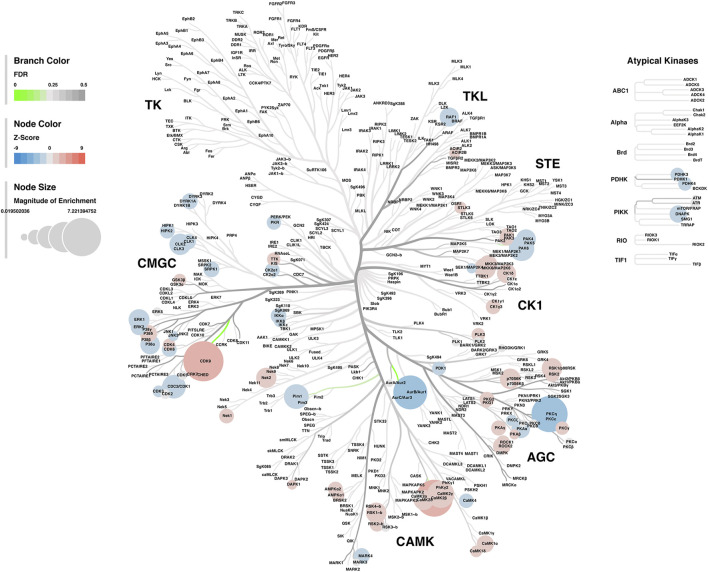
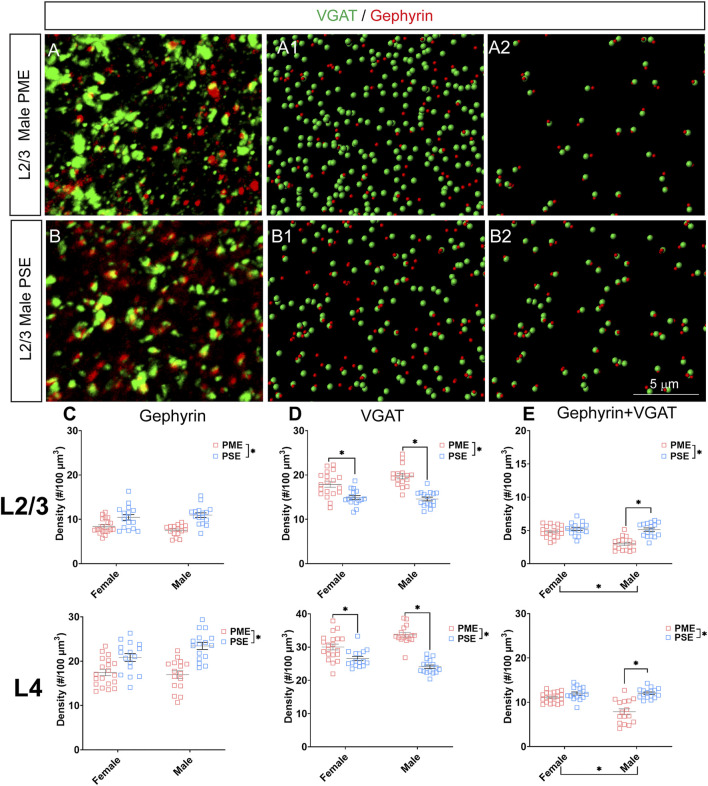
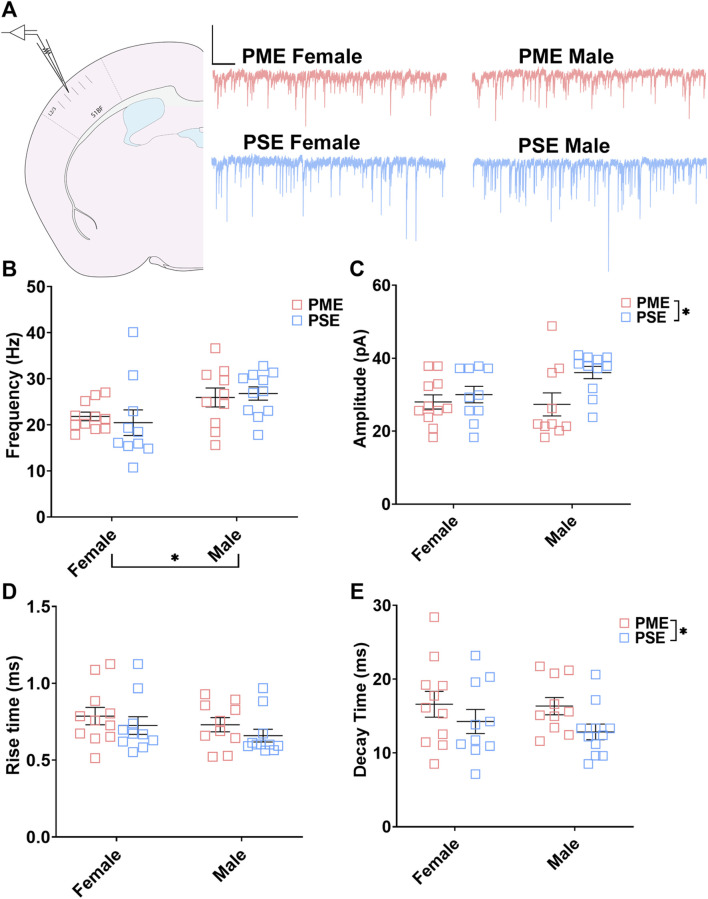
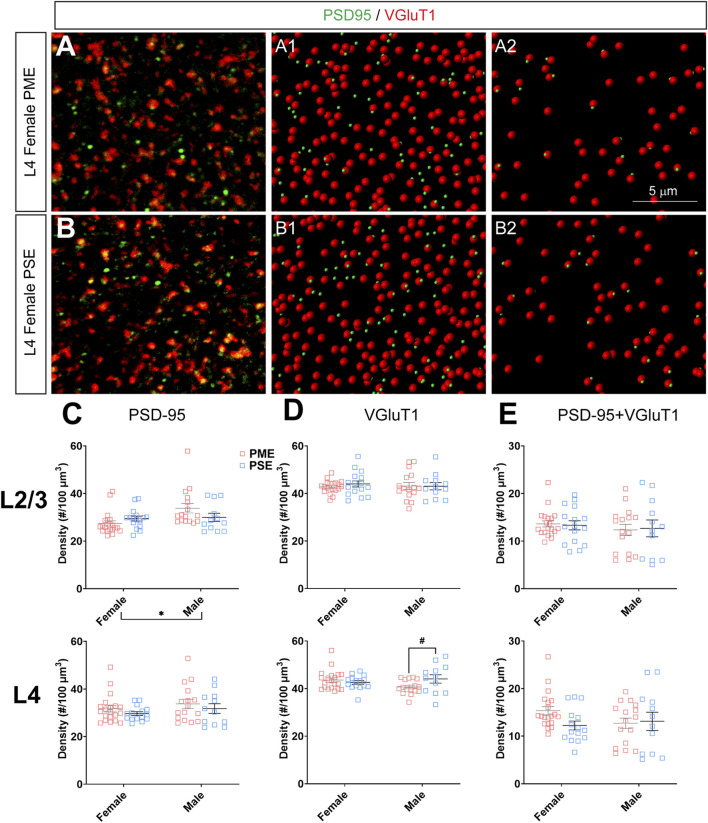
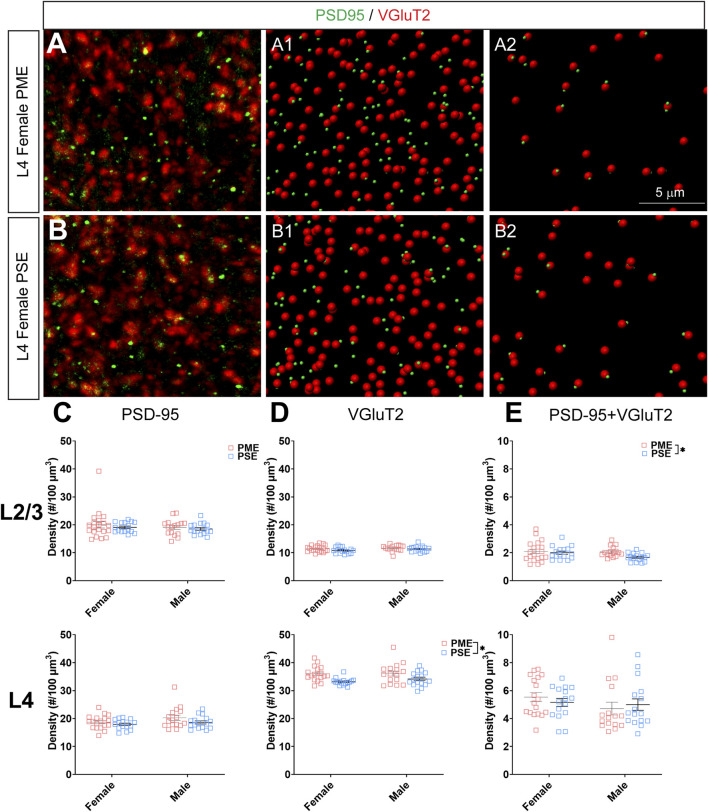
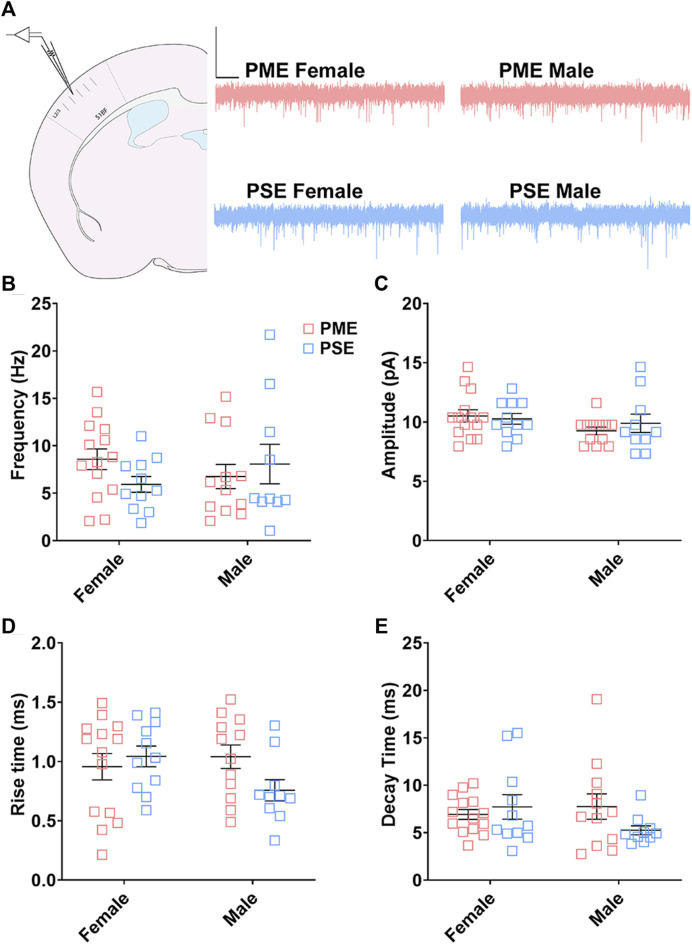
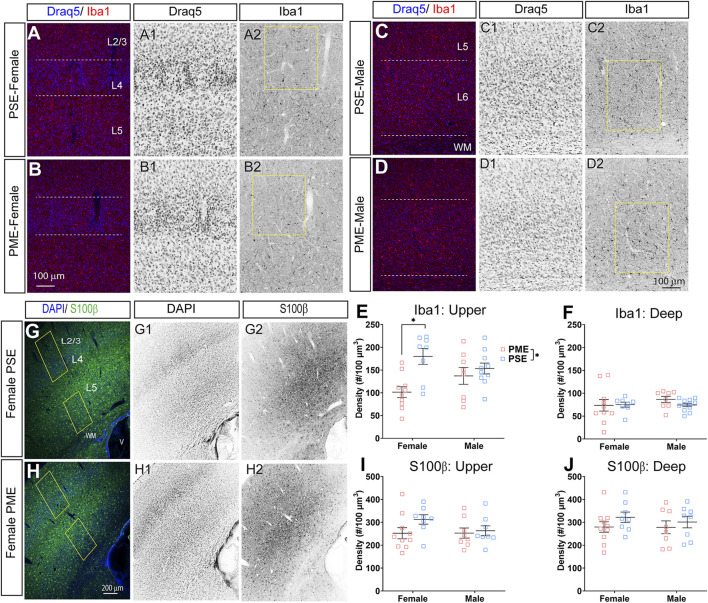
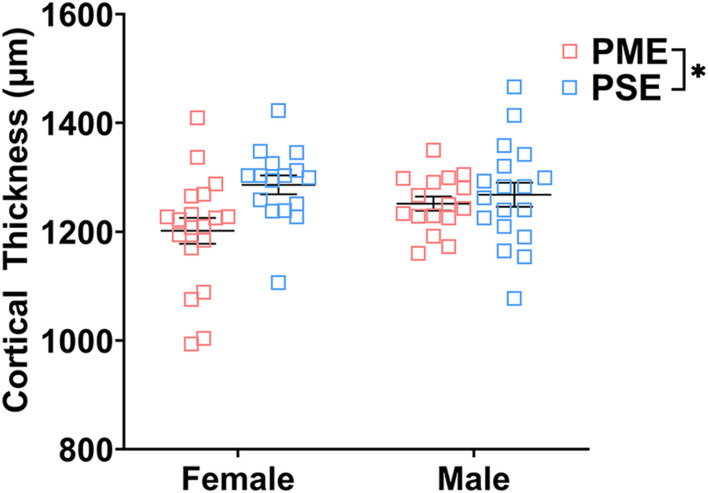
Rising opioid use among pregnant women has led to a growing population of neonates exposed to opioids during the prenatal period, but how opioids affect the developing brain remains to be fully understood. Animal models of prenatal opioid exposure have discovered deficits in somatosensory behavioral development that persist into adolescence suggesting opioid exposure induces long lasting neuroadaptations on somatosensory circuitry such as the primary somatosensory cortex (S1). Using a mouse model of prenatal methadone exposure (PME) that displays delays in somatosensory milestone development, we performed an un-biased multi-omics analysis and investigated synaptic functioning in the primary somatosensory cortex (S1), where touch and pain sensory inputs are received in the brain, of early adolescent PME offspring. PME was associated with numerous changes in protein and phosphopeptide abundances that differed considerably between sexes in the S1. Although prominent sex effects were discovered in the multi-omics assessment, functional enrichment analyses revealed the protein and phosphopeptide differences were associated with synapse-related cellular components and synaptic signaling-related biological processes, regardless of sex. Immunohistochemical analysis identified diminished GABAergic synapses in both layer 2/3 and 4 of PME offspring. These immunohistochemical and proteomic alterations were associated with functional consequences as layer 2/3 pyramidal neurons revealed reduced amplitudes and a lengthened decay constant of inhibitory postsynaptic currents. Lastly, in addition to reduced cortical thickness of the S1, cell-type marker analysis revealed reduced microglia density in the upper layer of the S1 that was primarily driven by PME females. Taken together, our studies show the lasting changes on synaptic function and microglia in S1 cortex caused by PME in a sex-dependent manner.

Keywords: methadone; neurodevelopment; prenatal opioid exposure; proteomics; somatosensory cortex.


Conflict of interest statement

CONFLICT OF INTEREST The authors declare that the research was conducted in the absence of any commercial or financial relationships that could be construed as a potential conflict of interest.

Figures

FIGURE 1
FIGURE 1
Differential protein and phosphopeptide expression in the somatosensory cortex of prenatal methadone exposed offspring. Volcano plots for the differential proteome in males (A) and females (B), and phosphoproteome of males (C) and females (D) with blue circles representing individual proteins/phosphopeptides decreased in PME vs. PSE and red circles representing individual proteins/phosphopeptides increased in PME vs. PSE which reach the level of significance. AR, abundance ratio. n = 8 (4M:4F) PME, 8 PSE (4M:4F).
FIGURE 2
FIGURE 2
Overlap in the protein, phosphopeptides, and gene ontology enrichment between prenatal methadone exposed males and females. Of the significantly differentially abundant proteins in the global proteome (A) and phosphoproteome (B) of PME females (grey) and males (purple), only 2 proteins and 6 phosphorylated proteins were identified in both males and females. The overlap in enriched biological processes (C) and cellular components (D) revealed 24 biological processes terms and five cellular component terms that were identified in all completed gene ontology analyses.
FIGURE 3
FIGURE 3
Clustering of enriched biological processes. Gene ontology enrichment analysis of biological processes enriched among the significant differentially abundant proteins in females (A) and differentially abundant phosphopeptides in females (B) and males (C) were reduced and clustered by REVIGO and visualized to facilitate identification of similarities. No enrichment was present in the males for the global proteome. The full results of the GO analysis for biological processes is provided in the Supplementary Material.
FIGURE 4
FIGURE 4
Clustering of enriched cellular components. Gene ontology enrichment analysis of cellular components enriched among the significant differentially abundant proteins in females (A) and males (B) and differentially abundant phosphopeptides in females (C) and males (D) were reduced and clustered by REVIGO and visualized to facilitate identification of similarities. The full results for the GO analysis for cellular components is provided in the Supplementary Material.
FIGURE 5
FIGURE 5
Dysregulated kinases. The results of a kinase-substrate enrichment analysis demonstrating the kinases that are significantly dysregulated (left; blue bars represent kinases predicted to be decreased in PME vs. PSE (FDR<0.05) and red bars represents kinases predicted to be increased in PME vs. PSE (FDR<0.05) with gene identities, protein names, z-score of enrichment, and FDR significance values provided in the tables (right) for females (A) and males (B).
FIGURE 6
FIGURE 6
Kinome tree plot in females. The results from kinase-substrate enrichment analysis were mapped onto kinome treeplots via Coral in which branch color corresponds to significance level, node color corresponds to z-score of enrichment, and node size correspond to magnitude of enrichment for kinase pathways in the S1 of females.
FIGURE 7
FIGURE 7
Kinome tree plot in males. The results from kinase-substrate enrichment analysis were mapped onto kinome treeplots via Coral in which branch color corresponds to significance level, node color corresponds to z-score of enrichment, and node size correspond to magnitude of enrichment for kinase pathways in the S1 of males.
FIGURE 8
FIGURE 8
Neurochemical assessment of functional GABAergic synapses. In a PME male (A) and a PSE male (B) in L2/3, an exemplary confocal stack of post-synaptic density (gephyrin) and vesicular GABA transporter (VGAT) double-stained image in L2/3. The use of the spot detection in Imaris to identify the gephyrin+ and VGAT + puncta (A1,B1). The gephyrin and VGAT spot pairs in the vicinity of 0.5 µm, which defined neurochemical VGAT input synapses (A2,B2). (C) PME significantly reduces gephyrin densities in L2/3 (ANOVA: Exposure, p < 0.0001; top) and in L4 (ANOVA: Exposure, p < 0.0001; bottom). (D) PME significantly increases VGAT densities in L2/3 (ANOVA: Interaction, p = 0.049; PME female vs. PSE female, p = 0.0005; PME male vs. PSE male, p < 0.0001; top) and in L4 (ANOVA: Interaction, p < 0.0001; PME female vs. PSE female, p = 0.0017; PME male vs. PSE male, p < 0.0001; bottom). (E) PME significantly reduced functional GABAergic synapses in L2/3 (ANOVA: Interaction, p = 0.0004; PME male vs. PSE male, p < 0.0001; top) and L4 (ANOVA: Interaction, p = 0.0002; PME male vs. PSE male, p < 0.0001; top). n = 9 (4M:5F) PME, 8 PSE (4M:4F). Two images per hemisphere, both hemispheres were quantified in each animal. *p < 0.05.
FIGURE 9
FIGURE 9
PME impairs inhibitory transmission in L2/3 pyramidal neurons. (A) Schematic demonstrating coronally sectioned brain slice to acquire the S1 barrel fields (S1BF) for whole cell voltage clamp recordings at approximately −0.82 mm bregma (left). Representative traces for miniature inhibitory postsynaptic currents (mIPSCs) in the S1 (right). Scale Bars = 500 ms, 100 mV (B) mIPSC frequency was not affected by PME. (C) The amplitude of mIPSCs was significantly reduced in PME offspring (ANOVA: Exposure, p = 0.024). (D) The rise time was not altered by prenatal exposure. (E) The decay constant was significantly lengthened in PME offspring (ANOVA: Exposure, p = 0.049). n = 8 PME mice (4M:4F), 21 neurons (10M:11F) and 8 PSE mice (4M:4F), 21 neurons (11M:10F). *p < 0.05.
FIGURE 10
FIGURE 10
Neurochemical assessment of functional intracortical glutamatergic synapses. In a PME female (A) and a PSE female (B) in L4, an exemplary confocal stack of post-synaptic density (PSD95) and vesicular glutamatergic transporter 1 (VGluT1) double-stained image in L4. The use of the spot detection in Imaris to identify the PSD95+ and VGluT1+ puncta (A1,B1). The PSD95 and VGluT1 spot pairs in the vicinity of 0.5 µm, which defined neurochemical VGluT1 input synapses (A2,B2). (C) Although a main effect of sex was present, there was not an effect of exposure on PSD-95 density in L2/3 (top) or L4 (bottom). (D) There was no change in VGluT1 density in L2/3 (top), although there was a trend for decreased VGluT1 density in PME males (ANOVA: Interaction, p = 0.043; p = 0.069; bottom). (E) PME did not impact PSD-95 and VGluT1 co-localization in L2/3 (top) or L4 (bottom). n = 9 (4M:5F) PME, 8 PSE (4M:4F). Two image per hemisphere per animal. *p < 0.05. #p = 0.069.
FIGURE 11
FIGURE 11
Neurochemical assessment of functional thalamocortical glutamatergic synapses. In a PME female (A) and a PSE female (B) in L4, an exemplary confocal stack of post-synaptic density (PSD95) and vesicular glutamatergic transporter 2 (VGluT2) double-stained image in L4. The use of the spot detection in Imaris to identify the PSD95+ and VGluT2+ puncta (A1,B1). The PSD95 and VGluT2 spot pairs in the vicinity of 0.5 µm, which defined neurochemical VGluT2 input synapses (A2,B2). (C) No exposure-related effects on PSD-95 density were present in L2/3 (top) or L4 (bottom). (D) There was no change in VGluT2 density in L2/3 (top); however, VGluT2 density was significantly increased in PME offspring in L4 (ANOVA: Exposure, p = 0.0005; bottom). (E) PME significantly increased PSD-95 and VGluT2 co-localization in L2/3 (ANOVA: Exposure, p = 0.049; top) but not in L4 (bottom). n = 9 (4M:5F) PME, 8 PSE (4M:4F). Two image per hemisphere per animal. *p < 0.05.
FIGURE 12
FIGURE 12
Excitatory transmission is not altered in L2/3 Pyramidal Neurons. (A) Schematic demonstrating coronally sectioned brain slice to acquire the S1 barrel fields (S1BF) for whole cell voltage clamp recordings at approximately −0.82 mm bregma (left). Representative traces for miniature excitatory postsynaptic currents (mEPSCs) in the S1 (right). Scale Bars = 500 ms, 50 mV. PME did not impact mEPSC (B) frequency, (C) amplitude, (D) rise time, or (E) decay constant. n = 8 PME mice (4M:4F), 26 neurons (12M:14F) and 8 PSE mice (4M:4F), 22 neurons (12M:10F).
FIGURE 13
FIGURE 13
Neurochemical assessment of glia cell density. Representative slices of the S1 in a PME female (A) and a PSE female (B) demonstrating Draq5 [blue in (A,B), isolated in (A1,B1): marker of nuclei] and Iba1 [red in (A,B), isolated in (A2,B2): marker of microglia] in the upper layer. Similarly, representative slices of the S1 in a PME male (C) and a PSE female (D) demonstrating Draq5 [blue in (C,D), isolated in (C1,D1): marker of nuclei] and Iba1 [red in (C,D), isolated in (C2,D2): marker of microglia) in the upper layer. Yellow boxes represent the areas used for quantification. (E) Iba1+ cell density was significantly affected by PME in the upper layer (ANOVA: Exposure, p = 0.003; Interaction, p = 0.043) with PME female showing reduced densities in the upper layer compared to PSE females (p = 0.0014). (F) There was no impact of PME on Iba1+ density in the deep layer. Representative slices of the S1 in a PME female (G) and a PSE female (H) demonstrating DAPI [blue in (D,E), isolated in (G1,H1): marker of nuclei] and S100β [blue in (D,E), isolated in (G2,H2): marker of astrocytes]. Yellow boxes represent the areas used for quantification. There was no effect of PME on S100β in either the (I) upper or (J) deep layer. n = 9 (4M:5F) PME, 8 PSE (4M:4F). 1, 2 image per hemisphere per animal. *p < 0.05.
FIGURE 14
FIGURE 14
Cortical thickness of somatosensory cortex. PME significantly reduced cortical thickness of S1 (ANOVA: Interaction, p = 0.015). Although no significant main effect of sex or interactions with sex were present, this reduction in cortical thickness visually appears to be driven by PME females. n = 9 (4M:5F) PME, 8 PSE (4M:4F), one image per hemisphere, two brain section/animal.

Similar articles

Cited by

References

    1. Hirai AH, Ko JY, Owens PL, Stocks C, Patrick SW. Neonatal Abstinence Syndrome and Maternal Opioid-Related Diagnoses in the US, 2010-2017. JAMA (2021) 325(2):146–55. 10.1001/jama.2020.24991 - DOI - PMC - PubMed
    1. Yeoh SL, Eastwood J, Wright IM, Morton R, Melhuish E, Ward M, et al. Cognitive and Motor Outcomes of Children with Prenatal Opioid Exposure: A Systematic Review and Meta-Analysis. JAMA Netw Open (2019) 2(7):e197025. 10.1001/jamanetworkopen.2019.7025 - DOI - PMC - PubMed
    1. Monnelly VJ, Hamilton R, Chappell FM, Mactier H, Boardman JP. Childhood Neurodevelopment after Prescription of Maintenance Methadone for Opioid Dependency in Pregnancy: a Systematic Review and Meta‐Analysis. Dev Med Child Neurol (2019) 61(7):750–60. 10.1111/dmcn.14117 - DOI - PMC - PubMed
    1. Wouldes TA, Woodward LJ. Neurobehavior of Newborn Infants Exposed Prenatally to Methadone and Identification of a Neurobehavioral Profile Linked to Poorer Neurodevelopmental Outcomes at Age 24 Months. PLoS One (2020) 15(10):e0240905. 10.1371/journal.pone.0240905 - DOI - PMC - PubMed
    1. Grecco GG, Atwood BK. Prenatal Opioid Exposure Enhances Responsiveness to Future Drug Reward and Alters Sensitivity to Pain: A Review of Preclinical Models and Contributing Mechanisms. eneuro (2020) 7(6):ENEURO.0393-20.2020. 10.1523/ENEURO.0393-20.2020 - DOI - PMC - PubMed