. 2023 Feb 28;19(2):149-159.
doi: 10.6026/97320630019149. eCollection 2023.

Repurposing of known drugs for COVID-19 using molecular docking and simulation analysis

Affiliations

Repurposing of known drugs for COVID-19 using molecular docking and simulation analysis

Piyush Bhanu et al. Bioinformation. .

Abstract

We selected fifty one drugs already known for their potential disease treatment roles in various studies and subjected to docking and molecular docking simulation (MDS) analyses. Five of them showed promising features that are discussed and suggested as potential candidates for repurposing for COVID-19. These top five compounds were boswellic acid, pimecrolimus, GYY-4137, BMS-345541 and triamcinolone hexacetonide that interacted with the chosen receptors 1R42, 4G3D, 6VW1, 6VXX and 7MEQ, respectively with binding energies of -9.2 kcal/mol, -9.1 kcal/mol, -10.3 kcal/mol, -10.1 kcal/mol and -8.7 kcal/mol, respectively. The MDS studies for the top 5 best complexes revealed binding features for the chosen receptor, human NF-kappa B transcription factor as an important drug target in COVID-19-based drug development strategies.

Keywords: COVID-19; SARS-CoV-2; ligand; molecular dynamics simulation; receptor.


Conflict of interest statement

The authors declare no conflicts of interest.

Figures
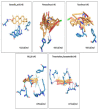
Figure 1
Figure 1
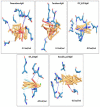
3D visualization of the top five best docked complexes for receptor 1R42. Their binding energies and the amino acid interactions between the ligands and the receptor, as viewed and analysed in PLIP tool. Orange colour represented the ligand part of the complex, while the bluish colours indicated the areas of the proteins to which the ligands interacted.
Figure 2
Figure 2
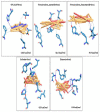
3D visualization of the top five best docked complexes for receptor 4G3D. Their binding energies and the amino acid interactions between the ligands and the receptor, as viewed and analysed in PLIP tool. Orange colour represented the ligand part of the complex, while the bluish colours indicated the areas of the proteins to which the ligands interacted.
Figure 3
Figure 3
3D visualization of the top five best docked complexes for receptor 6VW1. Their binding energies and the amino acid interactions between the ligands and the receptor, as viewed and analysed in PLIP tool. Orange colour represented the ligand part of the complex, while the bluish colours indicated the areas of the proteins to which the ligands interacted.
Figure 4
Figure 4
3D visualization of the top five best docked complexes for receptor 6VXX. Their binding energies and the amino acid interactions between the ligands and the receptor, as viewed and analyzed in PLIP tool. Orange colour represented the ligand part of the complex, while the bluish colours indicated the areas of the proteins to which the ligands interacted.
Figure 5
Figure 5
3D visualization of the top five best docked complexes for receptor 7MEQ. Their binding energies and the amino acid interactions between the ligands and the receptor, as viewed and analysed in PLIP tool were shown here. Orange colour represented the ligand part of the complex, while the bluish colours indicated the areas of the proteins to which the ligands interacted.
Figure 6
Figure 6
A cumulative protein RMSD graph for the five best docked complexes obtained via MDS. The y-axis showed the RMSD evolution of the proteins plotted against time in nano seconds. RMSD analysis indicated that the simulation had equilibrated towards the end. As observed from the graph, the RMSD after simulation showed stability towards the end. Changes between 1-3 Å are acceptable for smaller proteins, while changes in RMSD larger than that indicated that the proteins had undergone a large conformational change during MDS. It is essential that the RMSD values stabilized around a fixed value and the same was observed after MDS for all five complexes.
Figure 7
Figure 7
A cumulative figure showing the ligand-protein (LP) contacts for all the five docked complexes, obtained after MDS. A) Boswellic_acid-1R42, B) GYY_4137-6VW1, C) Pimecrolimus-4G3D, D) Triamcinolone_hexacetonide-7MEQ, E) BMS_345541-6VXX. The figure showed different types of amino acid contacts between the ligand and protein during MDS.
Figure 8
Figure 8
The ligand RMSF values for all five complexes which represents the ligand fit on the protein and shows the fluctuations of the ligand with respect to the proteins (displayed in violet colour). It represented how the ligands interacted with the proteins. The RMSF is generally measured on the heavy atoms of the ligand by first aligning the protein-ligand complex on the backbone of the protein and is useful in characterizing changes in the positions of the ligand atoms. A) Boswellic_acid-1R42; B) GYY_4137-6VW1; C) Pimecrolimus-4G3D, D) Triamcinolone_ hexacetonide-7MEQ, E) BMS_345541-6VXX complexes.
Figure 9
Figure 9
Graphs for protein RMSF with their ligand contacts for all top docked complexes, obtained as a result after MDS. A) Boswellic_acid-1r42, B) GYY_4137-6vw1, C) Pimecrolimus-4g3d, D) Triamcinolone_hexacetonide-7meq, E) BMS_345541-6vxx. The peaks indicate the areas of the protein which fluctuate most during MDS. Green coloured vertical bars represent the residues of the proteins that interact with the ligands.
Figure 10
Figure 10
Graphs showing the interactions of the proteins with the ligand during MDS. Following molecules A) Boswellic_acid-1R42, B) GYY_4137-6VW1, C) Pimecrolimus-4G3D, D) Triamcinolone_hexacetonide-7MEQ, E) BMS_345541-6VXX. The y-axis represented the interaction fraction value and the x-axis represented the protein residues with which the ligands interacted. These interactions were categorized into 4 types- hydrophobic bonds, hydrogen bonds, ionic interactions and water bridges. The stacked bars were normalized over the trajectory course and values over 1.0 indicated that multiple contacts of the same sub-type with the ligands were possible.

Similar articles

References

    1. Ahmad S, et al. Bioinformation. . 2022;18:3. - PMC - PubMed
    1. Chen Z, et al. The EMBO journal. . 2021;40:17. - PMC - PubMed
    1. Davies JP, et al. ACS Infectious Diseases. . 2020;6:12. - PMC - PubMed
    1. Bouhaddou M, et al. Cell. . 2020;182:3. - PMC - PubMed
    1. Gordon DE, et al. bioRxiv . 2020 - PubMed

LinkOut - more resources