. 2023 Nov;8(11):2115-2129.
doi: 10.1038/s41564-023-01501-z. Epub 2023 Oct 9.

Antiviral responses are shaped by heterogeneity in viral replication dynamics

Affiliations

Antiviral responses are shaped by heterogeneity in viral replication dynamics

Lucas J M Bruurs et al. Nat Microbiol. 2023 Nov.

Abstract

Antiviral signalling, which can be activated in host cells upon virus infection, restricts virus replication and communicates infection status to neighbouring cells. The antiviral response is heterogeneous, both quantitatively (efficiency of response activation) and qualitatively (transcribed antiviral gene set). To investigate the basis of this heterogeneity, we combined Virus Infection Real-time IMaging (VIRIM), a live-cell single-molecule imaging method, with real-time readouts of the dsRNA sensing pathway to analyse the response of human cells to encephalomyocarditis virus (EMCV) infection. We find that cell-to-cell heterogeneity in viral replication rates early in infection affect the efficiency of antiviral response activation, with lower replication rates leading to more antiviral response activation. Furthermore, we show that qualitatively distinct antiviral responses can be linked to the strength of the antiviral signalling pathway. Our analyses identify variation in early viral replication rates as an important parameter contributing to heterogeneity in antiviral response activation.


Conflict of interest statement

The authors declare no competing interests.

Figures

Fig. 1
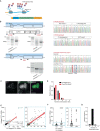
Fig. 1. IFIT1 is expressed in an MDA5/MAVS/TBK-dependent manner in EMCV(LZn)-infected cells.
a, Scheme of VIRIM experimental setup and VIRIM phases. During phase 1, a single GFP spot is visible, which represents the translated incoming vRNA. In phase 2, translation of the incoming vRNA is terminated and the vRNA undergoes replication, resulting in the disappearance of the GFP spot. In phase 3, newly synthesized vRNAs are produced and translated, resulting in the appearance of new GFP spots. Average phase durations are provided in minutes. 3DPOL, RNA-dependent RNA polymerase. b, Representative smFISH image of 5xSunTag-EMCV(LZn)-infected HeLa cells at 16 h.p.i., labelled with probes targeting IFIT1 and IFNB1 mRNAs and viral EMCV genomes. Scale bar, 20 µm. c, Fraction of (infected) cells with >10 IFNB1 (red bars) or >20 IFIT1 (black bars) mRNAs in uninfected cells and cells at 8 and 16 h.p.i. (n = 3 independent experiments). d, Fraction of infected cells expressing >10 IFNB1 or >20 IFIT1 mRNAs at 16 h.p.i. in either HeLa control or MDA5 and MAVS k.o. HeLa cells (n = 4 independent experiments). e, Fraction of infected cells expressing >10 IFNB1 or >20 IFIT1 mRNAs at 16 h.p.i. with or without treatment with an EMCV replication inhibitor (DiP), TBK1/IKKε inhibitor (MRT) or JAK1/3 inhibitor (TOFA) (n = 3 independent experiments). f, Fraction of IFIT1+ cells expressing >5 MX2 mRNAs at 16 h.p.i. A value of 0.04 indicates that on average, 4% of IFIT1+ cells are positive for MX2 expression (n = 3 independent experiments). g, Scatterplot showing the number of IFIT1 and IFNB1 mRNAs in 5xSunTag-EMCV(LZn) infected cells 16 h.p.i. (r indicates Pearson’s correlation coefficient, n = 771 cells, 3 independent experiments). Grey dots in cf represent values of individual biological replicates. All bars and error bars indicate mean ± s.e.m. P values in d and e were determined using two-sided, paired-samples t-test.
Fig. 2
Fig. 2. Antiviral response activated in cells with a lower viral load.
ag, For all panels, HeLa cells expressing GFP-STAb were infected with 5xSunTag-EMCV(LZn) and imaged for 16 h. Then, cells were fixed and subjected to smFISH labelling using probes targeting IFIT1 and either IFNB1 mRNAs or EMCV genomes. In g, smFISH labelling was combined with immunofluorescence for dsRNA. a, Representative images of live-cell virus infection imaging using VIRIM combined with post-fixation smFISH for IFIT1, IFNB1 and EMCV. Left (VIRIM): time since virus addition is noted. White arrows indicate GFP foci (translating vRNAs). Right: smFISH labelling of the infected cells with probes targeting IFIT1 and IFNB1 mRNA and EMCV genomes. Coloured dashed lines mark the outline of cell. Scale bar, 20 µm. b,c, Scatterplots showing viral load relative to the time in infection. Spot colour indicates number of IFIT1 mRNAs (b) and IFNB1 mRNAs (c) (n = 399 cells, 3 independent experiments). d, Fraction of infected cells expressing >20 IFIT1 mRNAs (black bars) or >10 IFNB1 mRNAs (red bars) at different time periods since the start of phase 3 (n = 399 cells, 3 independent experiments). e,f, Average viral load of 5xSunTag-EMCV(LZn) (e) and 5xSunTag-EMCV(LWT) (f) infected IFIT1− and IFIT1+ cells at different time periods in infection (e, n = 243 and 156 IFIT1− and IFIT1+ cells, respectively, 3 independent experiments; f, n = 26 and 106 IFIT1+ and IFIT1− cells, respectively, 6 independent experiments). g, Average dsRNA IF staining intensity of 5xSunTag-EMCV(LZn) infected, IFIT1− and IFIT1+ cells at different time periods in infection (relative to the start of phase 3) (n = 65 and 237 IFIT1+ and IFIT1− cells, respectively, 3 independent experiments). h, Number of IFIT1 mRNAs for cells in which infection did or did not progress to phase 3 (n = 118 and 24 phase 3+ and phase 3− cells, respectively, 3 independent experiments). In all panels, bars and error bars indicate mean ± s.e.m. P values in eg were determined using two-way analysis of variance (ANOVA).
Fig. 3
Fig. 3. Early viral replication rates are slower in cells that activate an antiviral response.
ag, For all panels, 24xPBS IFIT1 k.i. cells expressing GFP-STAb, GFP(1–10) and PCP-mCherry-NLS were infected with GFP11-5xSunTag-EMCV(LZn) and imaged for 16 h. a, Representative images from a 16 h time-lapse movie of cells infected with GFP11-5xSunTag-EMCV(LZn). Top row: VIRIM (early timepoints) and split-GFP expression levels (late timepoints). White arrows at 3h50m timepoint highlight the appearance of newly translating vRNAs that mark the start of phase 3. Middle row: PCP-mCherry-NLS used for IFIT1 transcription imaging. White asterisk indicates IFIT1 transcription site. In some cells, cytosolic GFP aggregates can be observed, which result from GFP-STAb and GFP1–10 co-aggregation. Aggregates can easily be discriminated from VIRIM foci (Methods). Scale bar, 20 µm. b, Example intensity time traces of VIRIM foci number (purple line) and split-GFP signal (green line) in a GFP11-5xSunTag-EMCV(LZn)-infected cell. c, Split-GFP signal accumulation in cells with (red line) and without (black line) IFIT1 transcription. Line and light shading represent mean ± s.e.m. of 4 independent experiments (n = 46 IFIT1+ and 117 IFIT1− infections). d, Split-GFP signal accumulation in IFIT1+ (dashed line) and IFIT1− (solid line) cells infected using either MOI = 1 (black lines) or MOI = 5 (red lines). Line and light shading represent mean ± s.e.m. of 3 independent experiments (n = 22 and 38 at MOI = 1 and n = 19 and 48 at MOI = 5 for IFIT1+ and IFIT1− cells, respectively). e, Cumulative fraction of IFIT1+ cells since the start of phase 3. Line and light shading indicate mean ± s.e.m. of 3 independent experiments (n = 60 (MOI = 1) and 67 (MOI = 5) infections). f, Split-GFP intensity time traces of split-GFP low/medium (red line) and high (blue line) infections. Line and light shading represent mean ± s.d. of 3 independent experiments (n: medium/low = 842, high = 129 infections). g, Average fraction of cells that activate IFIT1 transcription in different infection clusters. Grey dots represent values from individual replicates (n = 3 experiments, error bars are s.e.m.). P values in c, e and g were determined using two-sided, paired-samples t-test at t = 5 h (dashed line in c) or 14 h (e).
Fig. 4
Fig. 4. Efficiency of antiviral response activation varies throughout infection.
a,b, For both panels, 24xPBS IFIT1 k.i. cells stably expressing GFP-STAb and PCP-mCherry-NLS were infected with 5xSunTag-EMCV(LZn) and imaged for 16 h. a, Cumulative fraction of cells that have activated IFIT1 transcription at different timepoints since the start of phase 3. Line and error bars indicate mean ± s.e.m. of 4 experiments (n = 158 infections). b, Scatterplot showing the moment of IFIT1 transcription activation and average IFIT1 transcription site intensity in the first hour. Red bars and error bars indicate mean + s.d. IFIT1 transcription site intensity in different time bins (n = 76 cells, 4 independent experiments). P values were determined using two-sided, independent-samples t-test.
Fig. 5
Fig. 5. IRF3-BFP nuclear translocation and the antiviral response.
ag, IRF3-BFP and 24xPBS IFIT1 k.i. cells stably expressing GFP-STAb and PCP-mCherry-NLS were infected with 5xSunTag-EMCV(LZn) and imaged for 16 h. In e and f, cells additionally expressed GFP1–10 and infection was performed with GFP11-5xSunTag-EMCV(LZn). In g, live-cell imaging was followed by smFISH with probes targeting IFNB1 mRNA. a, Representative image of IRF3-BFP localization (top row) before and after IFIT1 transcription activation (bottom row). Dashed line indicates outline of the nucleus. White arrow in bottom row indicates IFIT1 transcription site. Scale bar, 20 µm. b, Normalized nucleocytoplasmic ratios of IRF3-BFP over time. Time traces of single cells were aligned to the onset of IFIT1 transcription (t = 0) (Methods). Red line indicates the average of all traces and grey lines represent individual traces (n = 21 cells, 2 experiments). c, IRF3-BFP nuclear translocation efficiency in IFIT1− and IFIT1+ cells. Dots represent individual cells, red lines and error bars indicate mean ± s.d. (n = 25 (IFIT1−) and 42 (IFIT1+) cells, 2 independent experiments). P value determined using two-sided, independent-samples t-test. d, Time between initial IFIT1 transcription and IRF3-BFP nuclear translocation. Red line and error bars indicate mean ± s.d. (n = 44 cells, 3 independent experiments). e, Split-GFP intensity time traces of infections synchronized in silico to the start of VIRIM phase 3. Infections were classified as ‘split-GFP fast’ (blue lines) or ‘split-GFP slow/intermediate’ (red lines) by a clustering algorithm. Lines reflect individual cells (n = 9 (fast) and 32 (slow/intermediate) infections, 3 independent experiments). f, Average normalized nucleocytoplasmic ratios of IRF3-BFP in split-GFP fast (blue line) or slow/intermediate (red line) infections. Traces were synchronized to the start of IFIT1 transcription. Lines and shaded areas indicate mean ± s.e.m. from 3 experiments (n = 9 (fast) and 32 (slow/intermediate) infections). g, Normalized nucleocytoplasmic ratios of IRF3-BFP in IFNB1+ (red line) and IFNB1− (black line) cells aligned to the onset of IFIT1 transcription. Solid lines and shaded areas indicate mean ± s.e.m. from 3 experiments (n = 16 (IFNB1+) and 29 (IFNB1−) cells, 3 independent experiments).
Extended Data Fig. 1
Extended Data Fig. 1. Extended data related to figure 1.
a) Fraction of 5xSunTag-EMCV(LWT) or 5xSunTag-EMCV(LZn) infected cells expressing 20 or more IFIT1 mRNAs at 8 h.p.i. (n = 3 independent experiments) P value determined using two-sided, independent samples T-test. b) Fraction of EMCV(LZn) or 5xSunTag-EMCV(LZn) infected cells expressing >20 IFIT1 or >10 IFNB1 mRNAs at 16 h.p.i. (n = 577 and 532 cells for EMCV(LZn) and 5xSunTag EMCV(LZn) respectively, 4 independent experiments) P value determined using two-sided, independent samples T-test. c) Histogram of the number of IFIT1 (black bars) and IFNB1 (red bars) smFISH spots in cells which were not incubated with virus (n = 144 cells, 3 independent experiments). d) Fraction of cells that express more than 20 IFIT1 mRNAs in cells that were treated with different concentrations of IFN for 24 h in the presence or absence of the the JAK1/3 inhibitor Tofacitinib (TOFA.) (n = 2 independent experiments). e) IFIT1 smFISH spot intensity distribution in IFNB1- (black line) and IFNB1 + (red line) cells (n = 600 and 570 spots respectively, 3 independent experiments). f) Left panel: Fraction of infected cells that have >10 IFIT1 and > 5IFNB1 nuclear mRNAs at 16 h.p.i. Right panel: Scatter plot showing the number of IFIT1 and IFNB1 mRNAs in the nucleus in 5xSunTag-EMCV(LZn) infected cells 16 h.p.i. (r indicates Pearson’s correlation coefficient, n = 269 cells, 3 independent experiments). g, h) MAVS (G) and TBK1 (H) mRNA expression levels at 8 h.p.i. in IFIT1- or IFIT1+ cells. Spots represent single cells and red lines indicate averages (MAVS: n = 222 and 77, TBK1: n = 238 and 103 in IFIT1- and IFIT1+ infections respectively, 3 independent experiments). P values were determined using two-sided, Mann-Whitney test. i) IRF3-BFP expression levels at the start of infection in cells that become either IFIT1- or IFIT1+ at 16 h.p.i. Spots represent single cells and red lines indicate averages (n = 93 and 92 IFIT1- and IFIT1+ infections respectively, 6 independent experiments). P value determined using two-sided, Mann-Whitney test. Grey dots in A,B,D,F represent in individual biological replicates. Bars and error bars indicate average ± s.e.m. in all panels.
Extended Data Fig. 2
Extended Data Fig. 2. Extended data related to figure 2.
a) Histogram of the time between the moment of virus addition to the cell culture medium and start of phase 3 (n = 399 infections, 3 independent experiments). b) Histogram of the number of IFIT (left) and IFNB1 (right) mRNAs in infected (black bars) and uninfected, neighbouring (red bars) cells observed in the experiments of which the results are presented in Fig. 2b–e and h (n = 49 uninfected cells and 399 infected cells, 3 independent experiments). c) Relative IFIT1 (black line, left y-axis) and IFNB1 (red line, right y-axis) mRNA levels in HeLa cells expressing GFP-STAb infected with 5xSunTag-EMCV(LZn) at different time points, as determined by qPCR. mRNA levels are expressed relative to expression at the moment of virus addition (t = 0) (n = 3 experiments). d) Viral genome abundance in HeLa cells expressing GFP-STAb infected with 5xSunTag-EMCV(LZn) at different time points as determined by qPCR (n = 3 experiments). e) Average viral load of 5xSunTag-EMCV(LZn) infected IFIT1-/IFNB1-, IFIT1 + /IFNB1-, and IFIT1 + /IFNB1+ cells at different time periods since the start of phase 3 (n = 243, 122, and 34 cells, respectively, 3 independent experiments). P values were determined using a two-way ANOVA test. f) Scatter plot showing the viral load and either the number of IFIT1 (left) or IFNB1 (right) mRNAs at 16 h.p.i. (r indicates Pearson’s correlation coefficient, n = 399 cells, 3 independent experiments). g) Fraction of infected cells without IFIT1 transcription site (TS) over time upon 1000U/ml IFN stimulation. Cells were infected and imaged for 16 h using VIRIM, after which cells were treated with IFN and IFIT1 transcription was imaged for 5 h. Appearance of an IFIT1 TS was scored in uninfected cells black line) or in cells that experienced an abortive infection (‘Infected, phase 1 only’, red line). Line and light shading represent average and s.e.m. of 3 independent experiments (n = 67 uninfected cells and 20 abortive infections). Error bars indicate s.e.m. in all panels.
Extended Data Fig. 3
Extended Data Fig. 3. Validation of 24xPBS IFIT1 reporter cell line.
a) Schematic representation of IFIT1 transcription imaging system using the PP7 system. PBS = PP7 binding site, PCP = PP7 coat protein. b) Schematic representation of the 24xPBS reporter gene integrated in the IFIT1 gene locus and genotyping results. Left panels: PCR reactions confirm correct integration of the reporter (expected size of PCR fragment indicated with red asterisk). PCR fragments were also subjected to Sanger sequencing to confirm correct integration (right panels). Representative result of two repeats is shown. In the sequence trace the PAM sequence (blue box) and the location of a single nucleotide insertion (red box) are highlighted. For panels C-F, 24xPBS IFIT1 cells were infected with 5xSunTag-EMCV(LZn) for 16 h and subjected to smFISH targeting the IFIT1 coding sequence (labelling mRNAs derived from both the tagged and untagged IFIT1 allele) and the Puro-P2A-SNAP coding sequence (labelling mRNAs derived from the tagged IFIT1 allele only). c) Representative image of an infected cell subjected to dual smFISH labeling of PP7-tagged and untagged IFIT1 mRNAs. Nuclear background signal in Puro-P2A-SNAP smFISH originates from residual PCP-mCherry-NLS fluorescence. Scale bar, 20 µm. d) Histogram of the number of untagged (black bars) or PP7-tagged (red bars) IFIT1 transcription sites per cell (n = 196 cells, 4 independent experiments). e) Number of PP7-tagged and untagged IFIT1 mRNAs in individual 24xPBS IFIT1 cells. Red line indicates linear regression of the data points with light red shading indicating the 95% confidence interval. Right scatter plot represents zoom in of the blue dashed box in the left graph (R2 indicates coefficient of determination, n = 177 cells, 3 independent experiments). Green Σ indicates the number of overlapping spots. f) Number of untagged IFIT1 mRNAs in cells that did or did not develop an IFIT1 transcription site during the 16 h of imaging. Right scatter plot represents zoom in of the blue dashed region in the left plot (n = 38 IFIT1+ and 135 IFIT1- cells, 3 independent experiments). g) Number of 24xPBS IFIT1 transcription sites observed in 6 h of live imaging after IFNα2 stimulation (1000U/ml) (n = 494 cells, 3 independent experiments). Source data
Extended Data Fig. 4
Extended Data Fig. 4. Extended data related to figure 3.
a) Maximum slope values of the split-GFP intensity time trace of IFIT1- (black) and IFIT1+ cells (red) in individual repeats of the experiment shown in Fig. 3c. Dots connected by a line represent values obtained in individual experiments. See method section for explanation about the quantification of the maximal slope. P values was determined using two-sided, paired samples T-test. b) Maximum slope values of split-GFP time traces from all individual infections in IFIT1- and IFIT1+ cells. Red bars indicate average and s.d. (n = 46 IFIT1+ and 117 IFIT1- infections, 4 independent experiments). P value was determined using two-sided, independent samples T-test. c) IFIT1 transcriptional output in infected and uninfected cells observed in the experiments reported in Figs. 3c, 4a,b (n = 163 infected cells and n = 33 uninfected cells, 3 independent experiments). AUC = area under the curve; a.u. = arbitrary units. d) Average split-GFP signal accumulation in cells that activate IFIT1 transcription (dashed lines) and cells that do not activate IFIT1 transcription (solid lines) infected using either MOI = 1 (black lines) or MOI = 0.2 (blue lines). Line and light shading represent average and s.e.m. of 3 independent experiments (n = 22 and 38 IFIT1+ and IFIT1- cells, respectively, at MOI = 1, n = 20 and 31 IFIT1+ and IFIT1- cells, respectively, at MOI = 0.2). e) Cumulative fraction of cells that have activated IFIT1 transcription at different time points since the start of phase 3. Line indicates average of 3 independent experiments, error bars = s.e.m. (n = 60 and 51 infections at MOI = 1 and MOI = 0.2, respectively). P value was determined using two-sided, independent samples T-test at t = 13 h. f) Characteristics of split-GFP Low/Medium and GFP High infections. n indicates the total number of infections that were assigned to either group over 3 independent experiments. Fraction of infections indicates the relative proportion of either type of infection. MSE = mean squared error.
Extended Data Fig. 5
Extended Data Fig. 5. Extended data related to figure 4.
24xPBS IFIT1 cells stably expressing GFP-STAb, PCP-mCherry-NLS, and a CMV-driven 24xPBS reporter RNA were infected with 5xSunTag-EMCV(LZn) and imaged for 16 h. Average CMV transcription site intensities during 5xSunTag-EMCV(LZn) infection in IFIT1 + (red line) and IFIT1- (black line) cells aligned to the start of phase 3 (n = 24 and 24 IFIT1+ and IFIT1- cells, respectively, 3 independent experiments). Shaded areas indicate s.e.m. Source data
Extended Data Fig. 6
Extended Data Fig. 6. Extended data related to figure 5.
a) Schematic representation of the BFP knock-in in the IRF3 gene locus and genotyping results. To assess correct integration of the BFP coding sequence, a 5’ and 3’ PCR fragment was amplified from genomic DNA using a primer that binds to the IRF3 genomic sequence and a primer that binds to the BFP sequence. PCR reactions were analysed by gel electrophoresis and PCR fragments of correct size (indicated with red asterisk) were subjected to Sanger sequencing (right panel). b) Fraction of EMCV(LZn) infected IRF3-BFP or parental HeLa cells expressing >20 IFIT1 mRNAs at 16 h.p.i. Bars and error bars indicate average ± s.e.m. (n = 426 and 399 infected cells for HeLa and IRF3-BFP, respectively, in 3 independent experiments). P value was determined using two-sided, independent samples T-test. Grey dots in B represent values determined in individual biological replicate experiments. c) Scatter plot showing the magnitude of IRF3-BFP nuclear translocation and the average IFIT1 transcription site intensity. IRF3-BFP, 24xPBS IFIT1 cells were infected with GFP11-5xSunTag-EMCV(LZn) at imaged for 16 h. See Methods for detailed explanation on the quantification. r indicates Pearson’s correlation coefficient (n = 80 cells, 6 independent experiments). d) IFIT1 transcriptional output in infected and uninfected cells observed in the experiments reported in Fig. 5a-d, g (n = 57 infected cells and n = 37 uninfected cells in 3 independent experiments).

Similar articles

Cited by

References

    1. O’Neill LAJ, Bowie AG. Sensing and signaling in antiviral innate immunity. Curr. Biol. 2010;20:R328–R333. doi: 10.1016/j.cub.2010.01.044. - DOI - PubMed
    1. Schoggins JW, Rice CM. Interferon-stimulated genes and their antiviral effector functions. Curr. Opin. Virol. 2011;1:519–525. doi: 10.1016/j.coviro.2011.10.008. - DOI - PMC - PubMed
    1. Mesev EV, LeDesma RA, Ploss A. Decoding type I and III interferon signalling during viral infection. Nat. Microbiol. 2019;4:914–924. doi: 10.1038/s41564-019-0421-x. - DOI - PMC - PubMed
    1. Postal M, et al. Type I interferon in the pathogenesis of systemic lupus erythematosus. Curr. Opin. Immunol. 2020;67:87–94. doi: 10.1016/j.coi.2020.10.014. - DOI - PMC - PubMed
    1. Lee JS, Shin E-C. The type I interferon response in COVID-19: implications for treatment. Nat. Rev. Immunol. 2020;20:585–586. doi: 10.1038/s41577-020-00429-3. - DOI - PMC - PubMed

Substances