. 2023 Oct 7;14(1):6262.
doi: 10.1038/s41467-023-41824-3.

UV-B irradiation-activated E3 ligase GmILPA1 modulates gibberellin catabolism to increase plant height in soybean

Affiliations

UV-B irradiation-activated E3 ligase GmILPA1 modulates gibberellin catabolism to increase plant height in soybean

Jiaqi Sun et al. Nat Commun. .

Abstract

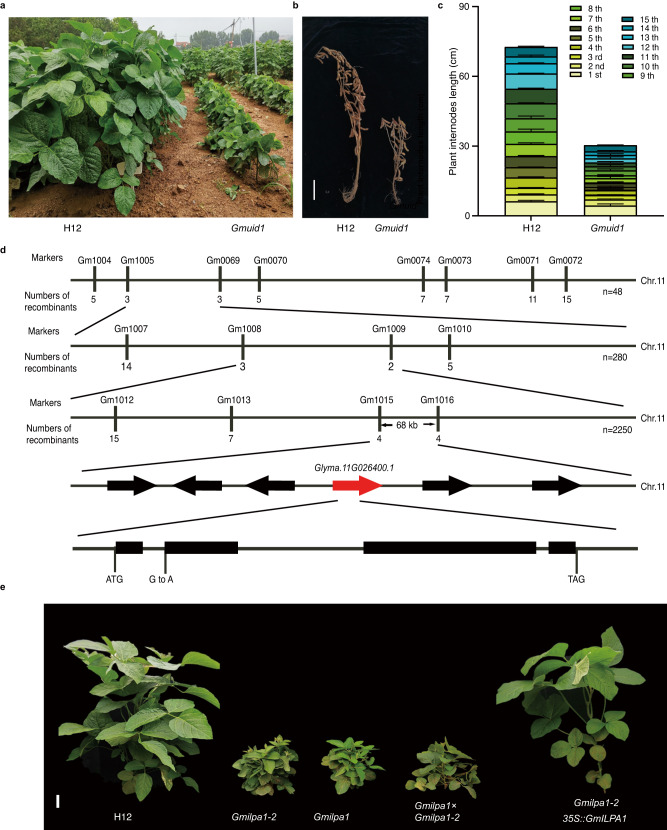
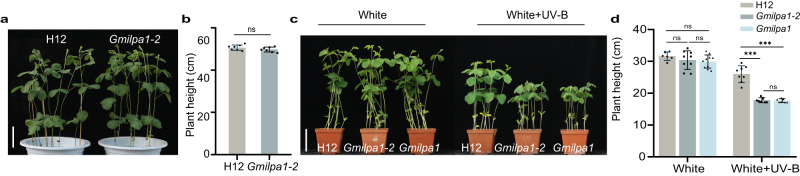
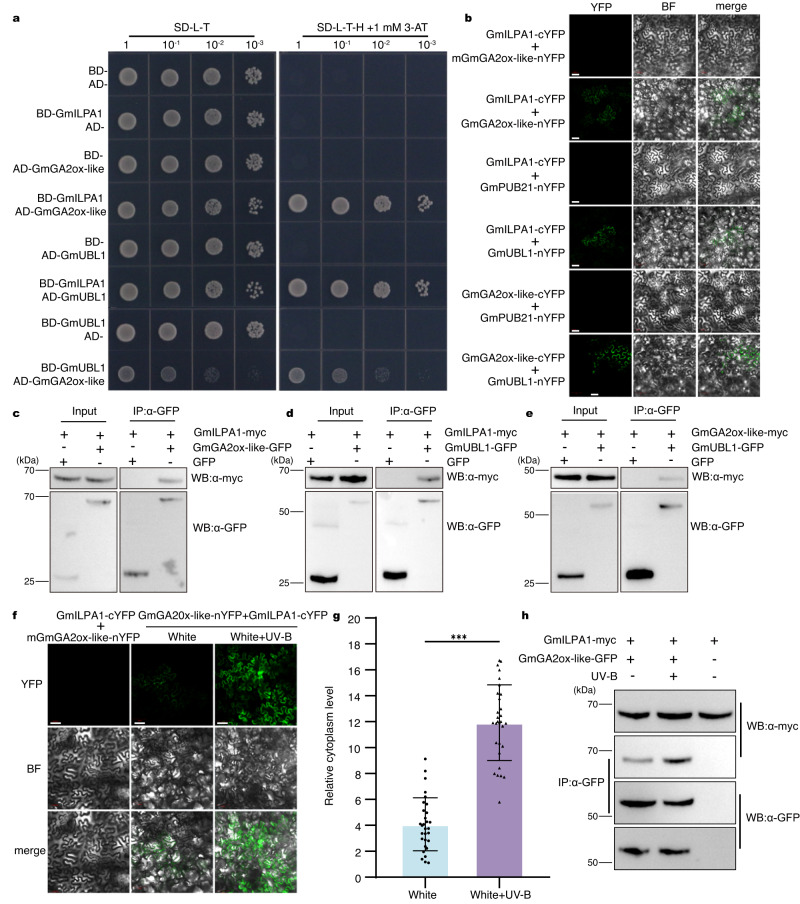
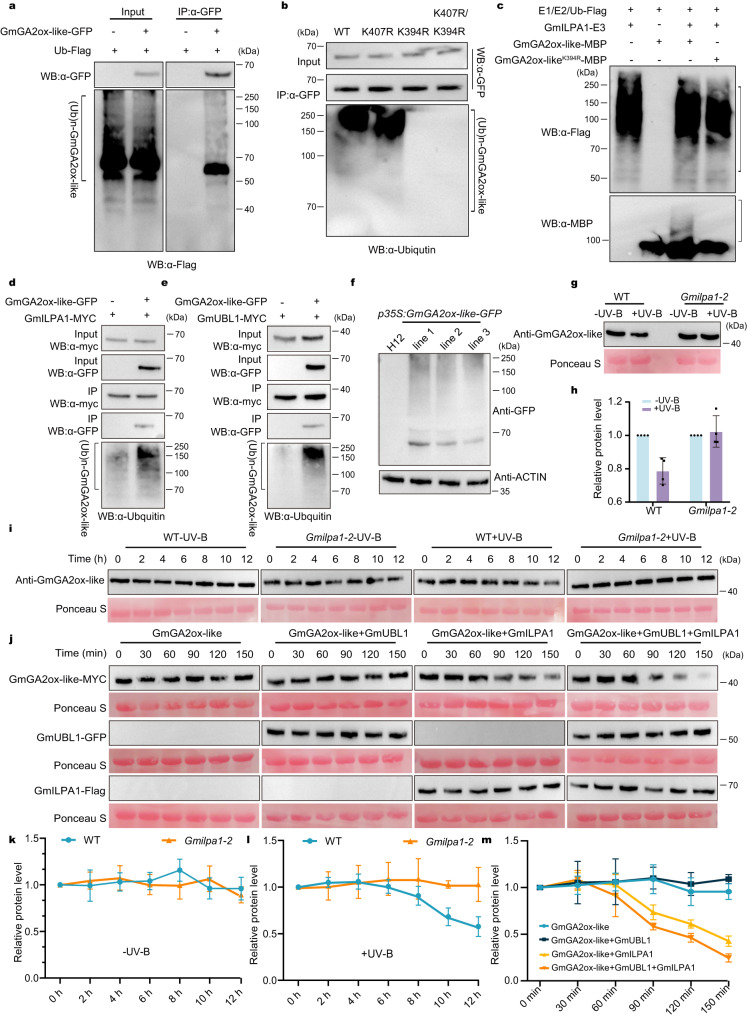
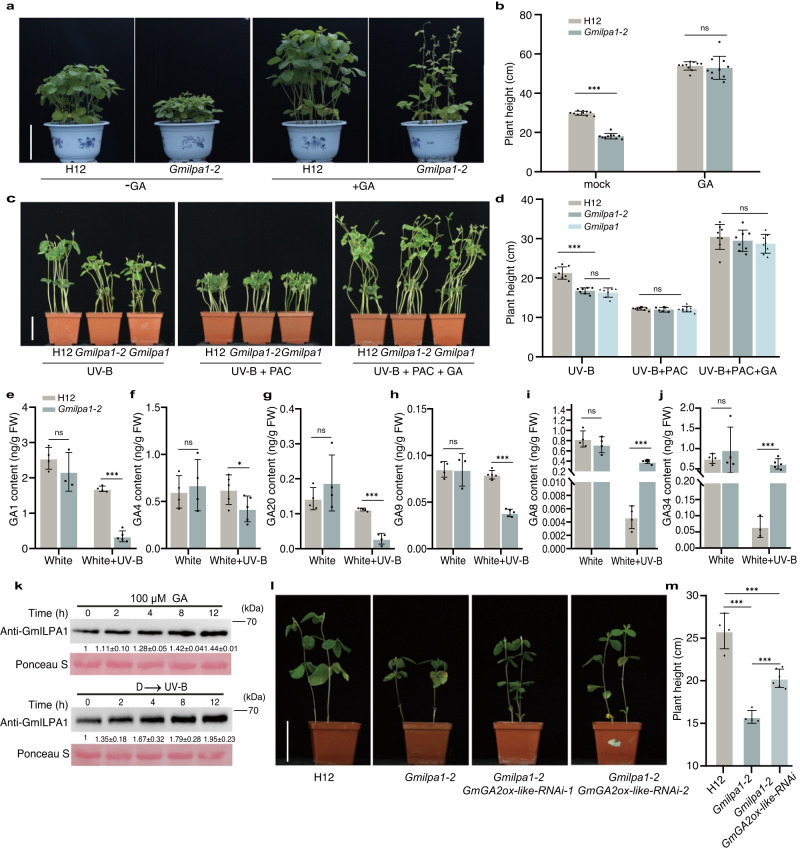
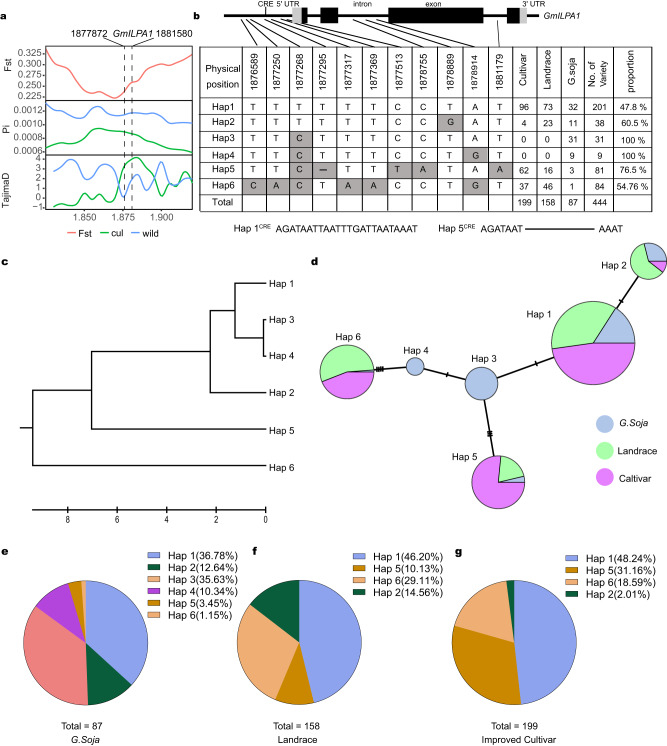
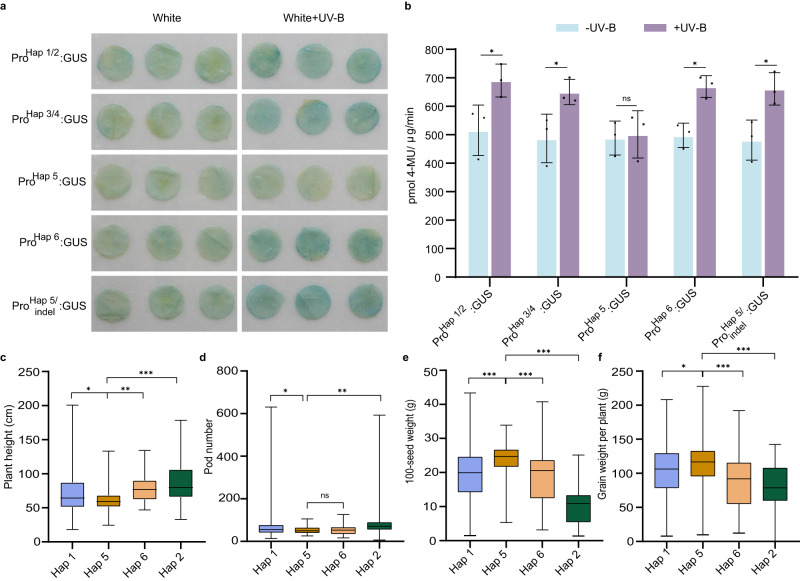
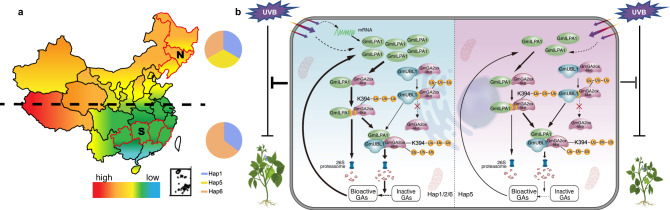
Plant height is a key agronomic trait that affects yield and is controlled by both phytohormone gibberellin (GA) and ultraviolet-B (UV-B) irradiation. However, whether and how plant height is modulated by UV-B-mediated changes in GA metabolism are not well understood. It has not been reported that the E3 ubiquitin ligase Anaphase Promoting Complex/Cyclosome (APC/C) is involved in the regulation of plant growth in response to environmental factors. We perform a forward genetic screen in soybean and find that a mutation in Glycine max Increased Leaf Petiole Angle1 (GmILPA1), encoding a subunit of the APC/C, lead to dwarfism under UV-B irradiation. UV-B promotes the accumulation of GmILPA1, which ubiquitinate the GA catabolic enzyme GA2 OXIDASE-like (GmGA2ox-like), resulting in its degradation in a UV-B-dependent manner. Another E3 ligase, GmUBL1, also ubiquitinate GmGA2ox-like and enhance the GmILPA1-mediated degradation of GmGA2ox-like, which suggest that GmILPA1-GmGA2ox-like module counteract the UV-B-mediated reduction of bioactive GAs. We also determine that GmILPA1 is a target of selection during soybean domestication and breeding. The deletion (Indel-665) in the promoter might facilitate the adaptation of soybean to high UV-B irradiation. This study indicates that an evolutionary GmILPA1 variant has the capability to develop ideal plant architecture with soybean cultivars.


Conflict of interest statement

The authors declare no competing interests.

Figures

Fig. 1
Fig. 1. Identification and characterization of the dwarf mutant Gmuid1.
a Representative image of plants from the wild-type (WT) Hedou 12 (H12) and the Gmuid1 mutant at the vegetative stage in the field. b Representative images of the WT and Gmuid1 at the R8 stage (full maturity). Scale bar, 10 cm. c Internode length of WT and Gmuid1 plants at the R8 stage. Data are means ± standard deviation (SD), n = 6 independent plants. d Summary of the positional cloning of the GmUID1 (also named GmILPA1) locus to chromosome 11. The insertion/deletion (InDel) markers Gm1005 and Gm0069 were used for initial mapping. GmUID1 (GmILPA1) was fine-mapped to a 68-kb region between the single sequence repeat (SSR) markers Gm1015 and Gm1016 on chromosome 11. n represents individual F2/F3 plants with the mutant phenotype. e Representative images of H12, Gmilpa1-2 (Gmuid1), Gmilpa1, Gmilpa1-2 × Gmilpa1 F1, and Gmilpa1-2 35S:GmILPA1 plants at the R1 stage (beginning of flowering). Scale bar, 10 cm. Source data are provided as a Source Data file.
Fig. 2
Fig. 2. UV-B is required for the Gmilpa1-2 phenotype.
a Representative image of the WT Hedou 12 (H12) and Gmilpa1-2 grown in a glasshouse at the V4 stage (four unrolled trifoliate leaves). Scale bar, 10 cm. b Height of the plants shown in (a), (n = 7 biologically independent samples; P = 0.1909), P-values were calculated by comparing to H12 plants using two-tailed Student’s t-test; ns not significant. c Representative images of the V2 stage of H12, Gmilpa1-2, and Gmilpa1 grown under white light (600 μmol m–2 s–1 white light, no UV-B, 25 °C, and a 12-h-light/12-h-dark photoperiod) and white light supplemented with UV-B (600 μmol m–2 s–1 white light, 1.5 μmol m−2 s−1 UV-B, 25 °C, and a 12-h-light/12-h-dark photoperiod). Scale bar, 10 cm. d Height of the seedlings shown in (c), (n > 6 biologically independent samples; P = 2.42 × 10⁻⁶ in H12 and Gmilpa1-2, P = 1.80 × 10⁻⁶ in H12 and Gmilpa1). Data are presented as mean values ± SD; P-value is calculated with a one-way ANOVA analysis–Tukey comparison, and the columns labeled without the same alphabet are significantly different (P < 0.05, two-sided). ***P < 0.001, ns not significant. Source data are provided as a Source Data file.
Fig. 3
Fig. 3. GmILPA1 interacts with GmGA2ox-like and GmUBL1.
a Yeast two-hybrid assays showing the interactions among GmILPA1, GmGA2ox-like, and GmUBL1. GmILPA1 and GmUBL1 were fused to GAL4-BD, and GmGA2ox-like was fused to GAL4-AD when encoded by the pGADT7 and pGBKT7 vectors. Serial dilutions of equivalent amounts of yeast were plated on synthetic defined (SD) medium without Leu (L), Trp (T) (SD-L-T), or without Leu (L), Trp (T), and His (H) (SD-L-T-H) containing 1 mM 3-amino-1,2,4-triazole (3-AT), with growth on triple dropout media indicating an interaction between the tested proteins. b A BiFC assay used to verify the interactions among GmILPA1, GmGA2ox-like, and GmUBL1 in vivo in N. benthamiana leaves. The non-interacting proteins, mGmGA2ox-like (mutated construct of D-Box motif) and GmPUB21 (a U-Box E3 Ubiquitin Ligases), were used as a negative control. Scale bars, 50 μm. ce Co-IP of GmILPA1, GmGA2ox-like, and GmUBL1. Immunoprecipitation was performed with anti-GFP-agarose beads using N. benthamiana leaves co-infiltrated with the constructs GmGA2ox-like-GFP and GmILPA1-MYC (c), GmUBL1-GFP and GmILPA1-MYC (d), or GmUBL1-GFP and GmGA2ox-like-MYC (e). f BiFC assays indicating that UV-B treatment promotes the interaction between GmILPA1 and GmGA2ox-like. N. benthamiana leaves were co-infiltrated with GmGA2ox-like–nYFP and GmILPA1–cYFP and exposed to 1 h of UV-B (21 μmol m−2 s−1) or kept in white light before imaging. Scale bars, 50 μm. g Relative YFP fluorescence intensity in the cytoplasm from the images in (f), (n = 30 cells, P = 1.30 × 10⁻⁵), the relative fluorescence intensities of cytoplasm and whole cells were quantified and the cytoplasm-to- background ratios are plotted. Data are presented as mean values ± SD, Student’s t-test was used for the significance test, ***P < 0.001. h Co-IP assays showed that UV-B increased the interaction between GmILPA1 and GmGA2ox-like. N. benthamiana were co-transformed with GmGA2ox-like-GFP and GmILPA1-MYC, and treated with or without 12 h UV-B. Then, they were used in the co-immunoprecipitation assay. Immunoprecipitation was performed using GFP-Trap agarose beads, and the immunoblots were probed using anti-myc and anti-GFP antibodies. Source data are provided as a Source Data file.
Fig. 4
Fig. 4. GmGA2ox-like is ubiquitinated and degraded by the proteasome.
a In vivo ubiquitination of GmGA2ox-like as detected by co-immunoprecipitation (Co-IP) assay. b Identification of the ubiquitination sites essential for GmGA2ox-like ubiquitination. c Ubiquitination of GmGA2ox-like by GmILPA1 in vitro. Brackets denote the ubiquitinated bands. d, e Ubiquitination of GmGA2ox-like by GmILPA1 in N. benthamiana leaves via Agrobacterium-mediated transient expression. f GmGA2ox-like is ubiquitinated in plants. Ubiquitinated proteins were enriched from the P62-agarose matrix that was incubated with total proteins isolated from three independent transgenic plants stably expressing GmGA2ox-like-GFP or from H12 plants. g Regulation of GmGA2ox-like stability by GmILPA1 in vivo. H12 and Gmilpa1-2 seedlings grown under white light and white light supplemented with UV-B to the V2 stage, and GmGA2ox-like was checked with an anti-GmGA2ox-like antibody. The band intensities in western blots were quantified (h), Data are presented as mean values ± SEM, n = 3 independent experiments. i Immunoblots showing GmGA2ox-like protein levels in V2 stage seedlings of H12 and Gmilpa1-2 grown in white light (600 μmol m−2 s−1, 12 h/12 h light/dark) and then transferred to white light supplemented with UV-B (1.5 μmol m−2 s−1, 12 h/12 h light/dark) for the indicated time periods. GmGA2ox-like abundance was detected with anti-GmGA2ox-like antibody and quantified (k, l). Data are presented as mean values ± SEM, n = 3 independent experiments. j GmGA2ox-like degradation in cell-free degradation assays in the presence of GmILPA1 and GmUBL1. GmGA2ox-like-MYC, GmUBL1-GFP, and GmILPA1-FLAG were individually infiltrated in N. benthamiana. GmGA2ox-like-MYC protein extracts were individually mixed with recombinant GmUBL1-GFP, GmILPA1-FLAG, GmUBL1-GFP, or GmILPA1-FLAG. Samples were collected at the indicated time points, and GmGA2ox-like abundance was probed by immunoblotting with anti-MYC antibody and quantified (m). Data are presented as mean values ± SEM, n = 3 independent experiments. Source data are provided as a Source Data file.
Fig. 5
Fig. 5. Exogenous gibberellin application can rescue the dwarf phenotype of Gmilpa1-2.
a Phenotypes of Hedou 12 (H12) and Gmilpa1-2 seedlings grown under sunlight treated with GA3 at the V1 stage (one unrolled trifoliate leaf), Scale bar, 20 cm. b Plant height of the seedlings at the V4 stage (three unrolled trifoliate leaves) in (a), (n = 10 biologically independent samples; P = 1.92 × 10⁻¹⁴ under mock condition). c Phenotypes of H12, Gmilpa1-2, and Gmilpa1 seedlings treated with PAC alone and PAC with GA3 treated with UV-B for 14 days, scale bar, 10 cm. d Plant height of the seedlings in (c), (n = 7 biologically independent samples; P = 1.12 × 10⁻⁵ under UV-B condition). ej Endogenous GAs levels in H12 and Gmilpa1-2. GA levels were measured using apical buds of V2-stage (two unrolled trifoliate leaves) seedlings grown under white light and white light with UV-B, (n ≥ 3 biologically independent samples; P = 6 × 10⁻⁴ in e P = 0.0134 in f P = 6.90 × 10⁻⁶ in g P = 3.71 × 10⁻⁷ in h P = 1.29 × 10⁻⁷ in i P = 4 × 10⁻⁴ in i). P-values were calculated compared to H12 seedlings by two-tailed Student’s t-tests; ***P < 0.001, *P < 0.05; ns not significant. k Immunoblots showing GmILPA1 abundance in seedlings of H12 at the V1 stage (unrolled one trifoliate leaf) treated with 100 μM GA3 and UV-B for the indicated times. l Phenotypes of H12, Gmilpa1-2, and T2 progeny lines of Gmilpa1-2/GmGA2ox-like RNAi grown under white light with UV-B (600 μmol m−2 s−1, 1.5 μmol m−2 s−1 UV-B, 12-h light/12-h dark). Scale bar, 10 cm. m Plant height of the seedlings, (n = 4 biologically independent samples for H12 and Gmilpa1-2, n = 6 biologically independent samples for Gmilpa1-2/GmGA2ox-like-RNAi, P = 1.01 × 10⁻⁴ in H12 and Gmilpa1-2, P = 5.21 × 10⁻⁴ in H12 and Gmilpa1-2/GmGA2ox-like-RNAi, P = 9.29 × 10⁻⁵ in Gmilpa1-2 and Gmilpa1-2/GmGA2ox-like-RNAi). In b, d, m, Data are presented as mean values ± SD, P-value is calculated with a one-way ANOVA analysis–Tukey comparison, and the columns labeled without the same alphabet are significantly different (P < 0.05, two-sided). ***P < 0.001, ns, not significant. Source data are provided as a Source Data file.
Fig. 6
Fig. 6. Haplotype analysis and origin of GmILPA1 in soybean accessions from different populations of China.
a FST, nucleotide diversity, and Tajima’s D values over the genomic region containing the GmILPA1 locus (~100 kb) between wild and cultivar soybean germplasms. b GmILPA1 haplotypes in natural populations. Top, schematic diagram of the GmILPA1 gene structure; gray, untranslated regions (UTRs); black, exons; black lines, promoter and introns. The CRE in the promoter region represents a light-responsive cis-regulatory element; –, 13-bp deletion. Bottom, GmILPA1 polymorphism across accessions relative to the Williams 82 reference genome (Hap1). The number of varieties for each haplotype (Hap1–6) is shown to the right. The cultivated soybean Hedou 12 belongs to Hap5. c Evolutionary relationship of the GmILPA1 six haplotypes. d Haplotype origins of GmILPA1 as shown by the median-joining method. Circle size is proportional to the number of accessions, while circle colors represent the different soybean groups: blue, wild soybean (S. soja); green, landraces; magenta, cultivars. eg Pie charts representing the distribution of each haplotype in wild soybeans, landraces, and improved cultivars.
Fig. 7
Fig. 7. Different Haplotypes of GmILPA1 confers variation of plant height in response to UV-B in cultivars.
a GUS activity detected by histochemical staining in Nicotiana benthamiana leaves transiently expressing the GUS reporter gene under the control of GmILPA1Hap1- GmILPA1Hap6 and the GmILPA1Hap5 promoter with indel. For UV-B treatment, N. benthamiana were treated with UV-B (1.5 μmol m−2 s−1) for 12 h before histochemical staining. b GUS activity from N. benthamiana leaves transiently expressing GUS under the control of GmILPA1Hap1- GmILPA1Hap6 and the GmILPA1Hap5 promoter, as measured by fluorometric assay and expressed as pmol 4-methylumbelliferone μg–1 protein min–1, (n = 3 independent experiments, P = 0.0457 in ProHap1/2: GUS, P = 0.0425 in ProHap3/4: GUS, P = 0.0413 in ProHap6: GUS and P = 0.0263 in ProHap5/indel: GUS). Data are presented as mean values ± SD, Student’s t-test was used for the significance test, ns, not significant, *P < 0.05. c–f Summary of major agronomic traits plants with the GmILPA1Hap1, GmILPA1Hap2, GmILPA1Hap5or GmILPA1Hap6 allele. (P = 0.0409 in Hap 1 and Hap 5, P = 0.0088 in Hap 6 and Hap 5, P = 0.0006 in Hap 2 and Hap 5) (c), (P = 0.0233 in Hap 1 and Hap 5, P = 0.0017 in Hap 2 and Hap 5) (d), (P = 2.61 × 10⁻⁶ in Hap 1 and Hap 5, P = 3.57 × 10⁻⁶ in Hap 6 and Hap 5, P = 8.95 × 10⁻²¹ in Hap 2 and Hap 5) (e), (P = 0.0143 in Hap 1 and Hap 5, P = 5.35 × 10⁻⁶ in Hap 6 and Hap 5, P = 1.33 × 10⁻⁶ in Hap 2 and Hap 5) (f). n = 179 for GmILPA1Hap1, n = 33 for GmILPA1Hap2, n = 76 for GmILPA1Hap5, n = 81 for GmILPA1Hap6. The box indicates the range from lower to upper quartiles, and the bar ranges the minimum to maximum observations; the significance of the difference is calculated by comparison with Hap 5 with a one-way ANOVA analysis–Tukey comparison and the columns labeled without the same alphabet are significantly different (P < 0.05, two-sided). *P < 0.05, **P < 0.01, ***P < 0.001; ns, not significant. Source data are provided as a Source Data file.
Fig. 8
Fig. 8. A working model of the regulation of plant height by the GmILPA1-GmUBL1-GmGA2ox-like module in soybean.
a Geographical distribution of Hap1, Hap5 and Hap6. N, north of China, S, south of China. The pie chart represents their frequency. b The working model of GmILPA1 regulating of plant height in Hap1/2/6 and Hap5. In Hap1/2/6, under the UV-B irradiation, GmILPA1 accumulation is induced at transcriptional and protein levels. GmGA2ox-like is ubiquitinated by GmILPA1 and GmUBL1, and GmILPA1 mediates the degradation of GmGA2ox-like, GmUBL1 enhanced the degradation of GmGA2ox-like. As a result, the increase of bioactive GAs content promoted the growth of soybean. In Hap5, under the UV-B irradiation, GmILPA1 accumulation is induced only at protein level, eventually leads to shorter plant height in Hap5. GA3 induces GmILPA1 protein accumulation both in Hap1/2/6 and Hap5.

Similar articles

Cited by

References

    1. Geng W, et al. Spraying ethephon effectively increased canopy light transmittance of densely planted summer maize, thus achieving synergistic improvement in stalk lodging resistance and grain yield. Plants. 2022;11:2219. - PMC - PubMed
    1. Yang M, et al. Fine mapping of the BnaC04.BIL1 gene controlling plant height in Brassica napus L. BMC Plant Biol. 2021;21:359. - PMC - PubMed
    1. Peng J, et al. Green revolution’ genes encode mutant gibberellin response modulators. Nature. 1999;400:256–261. - PubMed
    1. Khush GS. Green revolution: the way forward. Nat. Rev. Genet. 2001;2:815–822. - PubMed
    1. Wang Z, Tian Z. Genomics progress will facilitate molecular breeding in soybean. Sci. China Life Sci. 2015;588:13–815. - PubMed

Publication types

MeSH terms

Substances