. 2023 Oct 7;24(1):597.
doi: 10.1186/s12864-023-09692-9.

Transcription factor-binding k-mer analysis clarifies the cell type dependency of binding specificities and cis-regulatory SNPs in humans

Affiliations

Transcription factor-binding k-mer analysis clarifies the cell type dependency of binding specificities and cis-regulatory SNPs in humans

Saeko Tahara et al. BMC Genomics. .

Abstract

Background: Transcription factors (TFs) exhibit heterogeneous DNA-binding specificities in individual cells and whole organisms under natural conditions, and de novo motif discovery usually provides multiple motifs, even from a single chromatin immunoprecipitation-sequencing (ChIP-seq) sample. Despite the accumulation of ChIP-seq data and ChIP-seq-derived motifs, the diversity of DNA-binding specificities across different TFs and cell types remains largely unexplored.

Results: Here, we applied MOCCS2, our k-mer-based motif discovery method, to a collection of human TF ChIP-seq samples across diverse TFs and cell types, and systematically computed profiles of TF-binding specificity scores for all k-mers. After quality control, we compiled a set of TF-binding specificity score profiles for 2,976 high-quality ChIP-seq samples, comprising 473 TFs and 398 cell types. Using these high-quality samples, we confirmed that the k-mer-based TF-binding specificity profiles reflected TF- or TF-family dependent DNA-binding specificities. We then compared the binding specificity scores of ChIP-seq samples with the same TFs but with different cell type classes and found that half of the analyzed TFs exhibited differences in DNA-binding specificities across cell type classes. Additionally, we devised a method to detect differentially bound k-mers between two ChIP-seq samples and detected k-mers exhibiting statistically significant differences in binding specificity scores. Moreover, we demonstrated that differences in the binding specificity scores between k-mers on the reference and alternative alleles could be used to predict the effect of variants on TF binding, as validated by in vitro and in vivo assay datasets. Finally, we demonstrated that binding specificity score differences can be used to interpret disease-associated non-coding single-nucleotide polymorphisms (SNPs) as TF-affecting SNPs and provide candidates responsible for TFs and cell types.

Conclusions: Our study provides a basis for investigating the regulation of gene expression in a TF-, TF family-, or cell-type-dependent manner. Furthermore, our differential analysis of binding-specificity scores highlights noncoding disease-associated variants in humans.

Keywords: Cell type dependency; ChIP-seq; DNA-binding motif; Differential k-mer analysis; Functional genomics; GWAS-SNP; Regulatory SNP; Transcription factor; k-mer-based analysis.


Conflict of interest statement

The authors declare no competing interests.

Figures

Fig. 1
Fig. 1
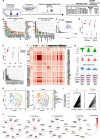
Overview of MOCCS profiles for human TF ChIP-seq samples across TFs and cell types. A and B Procedure for obtaining MOCCS profiles. Human TF ChIP-seq samples across diverse TFs and cell types were obtained from ChIP-Atlas. Subsequently, MOCCS2, a previously developed k-mer-based motif discovery method, was applied to the ChIP-seq dataset. Each ChIP-seq sample was represented as a profile of TF-binding specificity scores (MOCCS2scores) for each k-mer sequence, designated as a MOCCS profile. C Similarities in MOCCS profiles between ChIP-seq samples were marked by similarities in TFs (TF families), and interactions with other TFs. D Comparing the MOCCS profiles for the same TF in different cell type classes showed cell-type-dependent TF-binding specificities. Half of the analyzed TFs exhibited differences in DNA-binding specificity across cell types. For the TFs that we could not perform statistical tests on due to a lack of data, etc., they are marked as Not Applicable (N.A.). E Differential k-mer detection. Differential analysis of the MOCCS profiles revealed differentially bound k-mers between ChIP-seq samples of different cell types or TFs. F The ΔMOCCS2score for a single-nucleotide polymorphism (SNP) was defined as the difference in the MOCCS2score between k-mers on reference and alternative alleles (ref-k-mers and alt-k-mers) in a single ChIP-seq. The ΔMOCCS2score was used to predict the effects of the SNP on TF binding, which were validated with the results of in vitro and in vivo assay data. G: ΔMOCCS2score can be used to interpret how significant non-coding SNPs from GWAS studies affect the binding of TFs in specific cell types
Fig. 2
Fig. 2
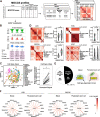
MOCCS profile reflected TF- or TF-family dependent DNA-binding specificities. A Overview of the ChIP-seq data processing. MOCCS2 was applied to human ChIP-seq samples from ChIP-Atlas, resulting in MOCCS profiles, k-mer-based TF-binding specificity profiles. Quality control metrics for ChIP-seq samples were calculated to filter samples (hard filter). B Number of ChIP-seq samples that passed through the hard filter. The colors indicate the cell type class (left) or TF (right). C Example of a MOCCS profile (GATA3, MDA-MB231). The highest MOCCS2score k-mer (AGATAA) was similar to that of the GATA3 PWM (HOCOMOCO database). D Detection performance (AUROC) of canonical motifs (top 10% PWM-supported k-mers) using the MOCCS2score for the original (red) and shuffled (gray) data of CTCF, SPI1, and FOXA1. *q < 0.05 (Wilcoxon signed-rank test). E Top: Detection performance (AUROC) of significant k-mers of MOCCS2 using the top 10% PWM-supported k-mers: original (red) and shuffled (gray) data from CTCF, SPI1, and FOXA1. *q < 0.05 (Wilcoxon signed-rank test). Bottom: Bar plot displaying -log10(q-value) from Wilcoxon signed-rank test for 20 TFs. F Heatmap of TF-dependent binding k-mer similarity (k-sim Jaccard) between the ChIP-seq samples. The color labels of rows and columns represent the TFs. G Violin plots of k-mer similarity indices, k-sim Pearson (green) and Jaccard (red), and the peak overlap index (blue) for different groups of ChIP-seq pairs. H UMAP visualization of MOCCS profiles. Point colors represent the ChIP-seq samples of the top 15 TFs (left) or TF families (right), with the largest sample size, or the rest (gray). I Ratios of neighboring pairs of the same TF (left) or TF family (right) for original and permuted data. * p < 6.26e-249 (permutation test; see Methods). J Star graphs displaying the TF similarity patterns between query TF (center) and the top 10 TFs with the highest k-sim Pearson (edge colors). Circles indicate TFs belonging to the same TF family as the query TF. Avairable PWMs (HOCOMOCO database) are shown
Fig. 3
Fig. 3
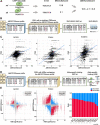
Comparison of MOCCS profiles reveal cell type-dependent TFs and TF similarity patterns. A Schematic overview of MOCCS profile comparisons between ChIP-seq samples with the same TF and different cell type classes. B Violin plots of k-mer similarity indices (k-sim), Pearson and Jaccard, and the peak overlap index for different groups of ChIP-seq pairs. C Left: UMAP visualization of MOCCS profiles. The point colors represent ChIP-seq samples from different cell type classes. Right: Ratios of neighboring pairs of the same cell type class for the original and permuted data. * p < 6.26e-249 (permutation test; see Methods). D Heat maps and violin plots of k-sim Jaccard values between ChIP-seq samples of the same TFs. The color labels of the heatmaps represent the cell type classes. Cell type classes with only a single ChIP-seq sample were excluded from the visualization. In the violin plots, the x-axis indicates ChIP-seq sample pairs with the same and different cell type classes, and the y-axis indicates k-sim Jaccard values. * p < 0.05 (Mann–Whitney U test). E Left: Pie chart showing the ratio of cell type-dependent to non-cell type-dependent TFs. The null group comprises TFs that could not be tested due to the small sample size. Right: Schematic illustration of the cell type-dependent TFs. For the TFs that we could not perform statistical tests on due to a lack of data, etc., they are marked as Not Applicable (N.A.). F Star graphs display cell type-dependent TF similarity patterns for JUN and GATA2. For each query TF (center), the k-sim Jaccard value (edge colors) of the query TF and the top 15 TFs with the highest differences in k-sim Jaccard values between the two cell type classes (Blood and Pluripotent stem cells) are shown
Fig. 4
Fig. 4
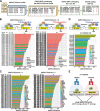
Differential analysis of MOCCS profiles between ChIP-seq sample pairs can detect differentially recognized k-mers. A Schematic overview of the simulation of differential k-mer detection. B Simulation results of differential k-mer detection. Scatter plot showing MOCCS2scores of all 6-mers in the two simulated ChIP-seq samples. The red and gray points represent the differential k-mers (q < 0.05) and other k-mers, respectively. C Bar plots showing the sensitivity, specificity, and false discovery rate (FDR) of differential k-mer detection under different simulation conditions (Fig. S8B). α is the percentage of input sequences (ChIP-seq peak regions) containing embedded “true significant k-mers,” N is the number of peaks in a ChIP-seq sample, and σ is the standard deviation of the embedded “true significant k-mers” from the center of the peak. D Scatter plots of MOCCS2scores showing differential k-mers between two ChIP-seq samples with the same (left) or different (right) cell types for the same TF (JUN). The red and blue points represent the differential k-mers (q < 0.05) and other k-mers, respectively. E Scatter plots of MOCCS2scores showing differential k-mers between ChIP-seq sample pairs of different TFs in the same cell types (K-562). The pair JUN and FOS (left) represents cofactor-effector pairs, whereas the pair JUN and CTCF (right) represents non-cofactor-effector pairs. The red and blue points represent differential k-mers (q < 0.05) and other k-mers, respectively. The PWM-supported differential k-mers and known PWM motifs (JASPAR) were compared between JUN and CTCF ChIP-seq samples
Fig. 5
Fig. 5
ΔMOCCS2score profiles are consistent with the in vitro SNP-SELEX data and in vivo allele-specific-binding data. A Schematic overview of the ΔMOCCS2score calculation for SNP-overlapping TF-binding k-mers. B Data processing procedures to calculate the ΔMOCCS2score in SNP-overlapping TF-binding k-mers for a set of SNPs that exhibited significant differential binding to at least one TF in the SNP-SELEX experiments [35]. C Comparison of preferential binding score (PBS) (SNP-SELEX) and ΔMOCCS2score. Each point represents a SNP corresponding to a k-mer pair (ref-k-mer or alt-k-mer). Spearman’s correlation coefficient between the PBS and ΔMOCCS2score and the corresponding p-values (one-sample t-test) were calculated for each TF. Note that we visualized multiple ΔMOCCS2score values for each SNP in each TF because we calculated ΔMOCCS2scores for multiple ChIP-seq samples of all cell types available for the focal TFs. D Data processing procedures to calculate the ΔMOCCS2score for k-mers overlapping SNPs with allele-specific-binding (ASB) events [36]. E Left and middle: Comparison between ASB significance and ΔMOCCS2score. Each point represents a SNP corresponding to a k-mer pair (ref-k-mer or alt-k-mer). Red points are concordant SNPs and blue points are discordant SNPs. Right: Bar plots displaying the ratios of concordant to discordant SNPs for each TF. Asterisks indicate a significant concordance ratio in the TFs (p-values were calculated from the empirical null distribution of the percentage of concordant SNPs and adjusted for multiple testing corrections, q < 0.05)
Fig. 6
Fig. 6
Prediction of effects of GWAS-SNPs on TF binding using ΔMOCCS2score profiles. A Schematic overview of the data processing procedures used to calculate the ΔMOCCS2score for k-mers overlapping GWAS-SNPs. B Combinations of SLE GWAS-SNPs and ChIP-seq samples with high ΔMOCCS2scores (ΔMOCCS2score > 75 (left) or ΔMOCCS2score < –100 (right), q < 0.05). Bar colors represent the cell type classes of the ChIP-seq samples. Combinations of CD GWAS-SNPs and ChIP-seq samples with high ΔMOCCS2scores (ΔMOCCS2score > 100 (left) or ΔMOCCS2score < –100 (right), q < 0.05). Bar colors represent the TFs of the ChIP-seq samples. D Prediction of the effect of a CD GWAS-SNP, rs17293632 (C > T), on TF binding using the ΔMOCCS2score profile. The ChIP-seq samples with large positive ΔMOCCS2scores are shown (ΔMOCCS2score > 100, q < 0.05). Bar colors represent TFs. The top three ChIP-seq samples with high absolute values of the ΔMOCCS2score were FOS. E GWAS-SNPs predicted to affect FOS binding using ΔMOCCS2score profiles in Crohn’s disease. The CD risk variant, rs17293632 (C > T), may strongly affect the binding of FOS, as shown in D

Similar articles

References

    1. Lambert SA, Jolma A, Campitelli LF, Das PK, Yin Y, Albu M, et al. The Human Transcription Factors. Cell. 2018;172:650–665. doi: 10.1016/j.cell.2018.01.029. - DOI - PubMed
    1. Cardon LR, Stormo GD. Expectation maximization algorithm for identifying protein-binding sites with variable lengths from unaligned DNA fragments. J Mol Biol. 1992;223:159–170. doi: 10.1016/0022-2836(92)90723-W. - DOI - PubMed
    1. Stormo GD. DNA binding sites: representation and discovery. Bioinformatics. 2000;16:16–23. doi: 10.1093/bioinformatics/16.1.16. - DOI - PubMed
    1. van Helden J, André B, Collado-Vides J. Extracting regulatory sites from the upstream region of yeast genes by computational analysis of oligonucleotide frequencies. J Mol Biol. 1998;281:827–842. doi: 10.1006/jmbi.1998.1947. - DOI - PubMed
    1. Liu B, Yang J, Li Y, McDermaid A, Ma Q. An algorithmic perspective of de novo cis-regulatory motif finding based on ChIP-seq data. Brief Bioinform. 2018;19:1069–1081. doi: 10.1093/bib/bbx026. - DOI - PubMed

LinkOut - more resources