. 2023;15(1):765-781.
doi: 10.1159/000533732. Epub 2023 Oct 5.

Mesenchymal Stromal Cells Facilitate Neutrophil-Trained Immunity by Reprogramming Hematopoietic Stem Cells

Affiliations

Mesenchymal Stromal Cells Facilitate Neutrophil-Trained Immunity by Reprogramming Hematopoietic Stem Cells

Julie Ng et al. J Innate Immun. 2023.

Abstract

Novel therapeutics are urgently needed to prevent opportunistic infections in immunocompromised individuals undergoing cancer treatments or other immune-suppressive therapies. Trained immunity is a promising strategy to reduce this burden of disease. We previously demonstrated that mesenchymal stromal cells (MSCs) preconditioned with a class A CpG oligodeoxynucleotide (CpG-ODN), a Toll-like receptor 9 (TLR9) agonist, can augment emergency granulopoiesis in a murine model of neutropenic sepsis. Here, we used a chimeric mouse model to demonstrate that MSCs secrete paracrine factors that act on lineage-negative c-kit+ hematopoietic stem cells (HSCs), leaving them "poised" to enhance emergency granulopoiesis months after transplantation. Chimeric mice developed from HSCs exposed to conditioned media from MSCs and CpG-ODN-preconditioned MSCs showed significantly higher bacterial clearance and increased neutrophil granulopoiesis following lung infection than control mice. By Cleavage Under Targets and Release Using Nuclease (CUT&RUN) chromatin sequencing, we identified that MSC-conditioned media leaves H3K4me3 histone marks in HSCs at genes involved in myelopoiesis and in signaling persistence by the mTOR pathway. Both soluble factors and extracellular vesicles from MSCs mediated these effects on HSCs and proteomic analysis by mass spectrometry revealed soluble calreticulin as a potential mediator. In summary, this study demonstrates that trained immunity can be mediated by paracrine factors from MSCs to induce neutrophil-trained immunity by reprogramming HSCs for long-lasting functional changes in neutrophil-mediated antimicrobial immunity.

Keywords: Epigenetics; Hematopoietic stem cells; Neutrophils; Toll-like receptor 9; Trained immunity.


Conflict of interest statement

The authors have no conflicts of interest to declare.

Figures
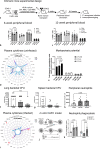
Fig. 1.
Fig. 1.
Chimeric mice repopulated with CpG-bone marrow have increased myelopoiesis and improved bacterial clearance after Pseudomonas aeruginosa pulmonary infection. a Schematic of experimental model. C-kit+ cells were harvested from CD45.1-expressing CByJ.SJL(B6)-Ptprca/J mice and cultured ex vivo for 48 h in StemSpan SFEM II and 30% of (1) alpha-MEM media control, (2) MSC-conditioned media (CdM), or (3) CpG-MSC-CdM. CD45.2-expressing wild-type BALB/cJ mice were lethally irradiated with 9 Gy in 2 divided doses, and 1.5–2 × 10⁵ c-kit+ cells from the above conditions in 150 µL PBS were injected retro-orbitally. Peripheral blood chimerism was determined 6 weeks after transplantation. Functional studies, including intranasal P. aeruginosa infection, was performed 12–14 weeks after transplantation. Peripheral blood chimerism 6 weeks (b) (n = 5 mice per group) and 12 weeks (c) (n = 5 mice per group) after bone marrow transplantation. There was an increase in the proportion of neutrophils in the peripheral blood of mice that received c-kit+ cells cultured with CpG-MSC-CdM (CpG-BM), compared to MSC-CdM (MSC-BM), and media control (Ctrl-BM) 6 weeks after transplantation. Data were analyzed by 2-way analysis of variance (ANOVA), interaction p = 0.003, and significant comparisons by Bonferroni’s multiple comparisons test are denoted on the graph (Ctrl-BM vs. CpG-BM neutrophils, p = 0.0349; MSC-BM vs. CpG-BM neutrophils, p = 0.0070; Ctrl-BM vs. CpG-BM B cells, p = 0.0146). At 12 weeks after transplantation, there was no significant difference in the peripheral blood cell populations. d Radar plot showing the mean value of plasma Luminex cytokines in uninfected chimeras (n = 5 in Ctrl-BM [●] and MSC-BM [●], n = 4 in CpG-BM [●]). e 1,000 c-kit+ cells isolated from the bone marrow chimeric mice (n = 6 per group) 12–16 weeks after transplantation were seeded into methylcellulose media. Cultures were grown for 9 days prior to blinded manual determination of CFU containing granulocyte macrophages (CFU-GM, black bars), granulocytes (CFU-G, white bars), or macrophages (CFU-M, gray bars). Data were assessed by two-way ANOVA, interaction p = 0.0009. Significant comparisons of CFU-GMs by Bonferroni’s multiple comparisons test are denoted on the graph (Ctrl-BM vs. CpG-BM, p < 0.0001; MSC-BM vs. CpG-BM, p = 0.0003). Sixteen weeks after bone marrow transplantation, chimeras were intranasally infected with 1–1.5 × 10⁷ CFU of Pseudomonas (P.) aeruginosa and sacrificed 24 h after infection. The whole left lung (f) and whole spleen (g) were removed from mice transplanted with CpG-BM (n = 13, ▲), MSC-BM (n = 12, ■), or Ctrl-BM (n = 12, ●), homogenized in 1 mL PBS and plated on onto LB agar overnight prior to quantification of organ bacterial colonies. Data were assessed by one-way ANOVA (lung bacterial organ CFU interaction p = 0.0347, spleen bacterial organ CFU interaction p = 0.3278). Significant comparisons of lung bacterial organ CFU by Bonferroni’s multiple comparisons test are denoted on the graph (Ctrl-BM vs. CpG-BM, p = 0.0322). h Peripheral blood neutrophils were assessed in infected chimeras by flow cytometry. Data were assessed by one-way ANOVA, interaction p = 0.0274. Significant comparisons by Bonferroni’s multiple comparisons test are denoted on the graph (Ctrl-BM vs. CpG-BM, p = 0.0388). i Radar plot showing the mean value of plasma Luminex cytokines in infected chimeras (n = 5 Ctrl-BM [●] and CpG-BM [●], n = 3, MSC-BM [●]). Data were analyzed by 2-way ANOVA, interaction p < 0.0001. Significant comparisons by Bonferroni’s multiple comparisons test are denoted on the graph (Ctrl-BM vs. CpG-BM [* p = 0.0027 for IL-17A, p < 0.0001 for IL-6], Ctrl-BM vs. MSC-BM [Ƭp < 0.001 for IL-17A, p = 0.0449 for IL-6], MSC-BM vs. CpG-BM [§p = 0.008 for MCP-1, p < 0.0001 for IL-17A, p < 0.001 for IL-6]). j Schematic of the in vitro cobblestone area-forming assay (CAFC) for assessing the influence of MSC- and CpG-MSC-CdM on neutrophil function. k Neutrophils derived from LSK cells stimulated by media control (○, white bar), MSC-conditioned media (CdM) (▲, gray bar), and CpG-MSC-CdM (□, striped bar) were co-cultured with P. aeruginosa expressing green fluorescent protein for 2 h, and phagocytosis was assessed by flow cytometry. Data were analyzed by 2-way ANOVA, interaction p = 0.0016. Significant comparisons by Bonferroni’s multiple comparisons test are denoted on the graph. LB, Luria Broth.
Fig. 2.
Fig. 2.
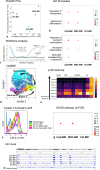
C-kit+ hematopoietic stem cells from CpG-BM transplanted chimeric mice have persistent mTOR signaling and increased genes associated with myelopoiesis, and neutrophil function marked by H3K4me3. a Principal component analysis (PCA) of CUT&RUN data associated with H3K4me3 in c-kit+ cells from uninfected chimeras with Ctrl-BM (purple circles), MSC-BM (pink circles), or CpG-BM (blue circles) 16 weeks after transplantation. b Dot plot of functionally enriched gene ontology processes associated with myelopoiesis and neutrophil function in c-kit+ cells from chimeras. The number of genes in each gene set is represented by the size of each dot. The color of each dot indicates the significance of the pathway (adjusted p value) for each group. c Wishbone trajectory analysis of cells from the CAFC assay demonstrating a common c-kit+ trunk (blue solid line) and two distinct branches: (1) F4/80+ macrophages (green dashes, branch 1), and (2) Ly6G+ neutrophils (red dots, branch 2). d OptSNE plot demonstrating distinct clusters along the neutrophil fate trajectory. e Heatmap of relative p-S6 signaling (mTOR) after 1, 10, or 20 min of stimulation with medial control, MSC-CdM, CpG-MSC-CdM, or LPS in clusters along the neutrophil developmental pathway. f Representative shift in phospho-S6 (p-S6) signaling in cluster 13 30 min after stimulation with lipopolysaccharide (LPS, green), MSC-CdM (orange), or CpG-MSC-CdM (pink) compared to unstimulated control (blue). g Mechanistic target of rapamycin (mTOR) KEGG pathway overrepresentation analysis of chromatin associated with H3K4me3 in c-kit+ cells from chimeras. h Integrative genomic viewer (IGV) tracks of H3K4me3 peaks mTOR.
Fig. 3.
Fig. 3.
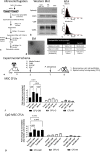
Both the EVFSF and EVs in CdM from CpG-MSCs augment emergency granulopoiesis. a Ultra-centrifugation protocol for the preparation of EV and the EVFSF from the same starting CdM. b The EV fraction from MSCs and CpG-MSCs were analyzed by Western blot for calnexin (negative control), CD81, CD9, and CD63, with whole cell protein as positive control. c Nanoparticle tracking analysis (NTA) of EV characteristics and size distribution of MSC EVs and CpG-MSC EVs. d Transmission electron microscopy image demonstrating CpG-MSC EV morphology. Scale bar represents 100 nm. e Schematic of experimental model. Mice received a sublethal dose of irradiation (5 Gy) on day 0. On day 3, mice were given 150 µL of either (1) alpha-MEM media control, (2) CdM from 5 × 10⁵ MSC or CpG-MSCs, (3) EV-free soluble fraction (EVFSF) from 5 × 10⁵ MSC or CpG-MSCs, or (4) EVs from 5 × 10⁵ MSCs or CpG-MSCs. On day 7, mice were infected intranasally with P. aeruginosa, and sacrificed 2 days after infection to isolate c-kit+ cells for a myeloid colon-forming assay. f Myeloid differentiation and proliferation potential of c-kit+ cells (n = 6 per group) from infected and irradiated mice given MSC-CdM, MSC EVSF, MSC EVs, or media control as measured by CFU-GM (black bar), CFU-G (white bar), and CFU-M (gray bar). Data were analyzed by 2-way ANOVA, interaction p = 0.0714, row factor p = 0.0002. g Myeloid differentiation and proliferation potential of c-kit+ cells (n = 6 per group) from infected and irradiated mice given CpG-MSC-CdM, CpG-MSC EVSF, CpG-MSC EVs, or media control. Data were analyzed by 2-way ANOVA, interaction p = 0.0214. f, g Significant comparisons by Bonferroni’s multiple comparisons test are denoted on the graphs.
Fig. 4.
Fig. 4.
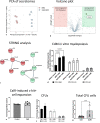
Proteomic analysis of CpG-MSC- and MSC-CdM identifies soluble calreticulin as a mediator of neutrophil-trained immunity. a Principal component analysis (PCA) of MSC (pink, n = 5) and CpG-MSC (blue, n = 5) protein secretomes. b Volcano plot demonstrating up-(green) and down-(red) regulated proteins from CpG-MSC-CdM compared to MSC-CdM (p < 0.01, fold change >2). The complete list of proteins identified as significant are listed in online supplementary Table 4. c STRING analysis of 9 of the top 15 upregulated proteins demonstrating two physical subnetworks, where the nodes indicate proteins and the edges indicate physical interactions that have been described by text mining of experiments or databases. The thickness of the edge indicates the strength of the data support. Protein-protein interaction (PPI) enrichment p value = 5.76e−06. CALR, calreticulin; HNRNPA1, heterogenous nuclear ribonucleoprotein A1; HNRNP2B1, heterogenous nuclear ribonucleoproteins A2/B1; PDIA3, protein disulfide-isomerase A3; PDIA6, protein disulfide-isomerase A6; PRKCSH, protein kinase c substrate 80kh; SFPQ, splicing factor, proline- and glutamine-rich; RBMX, heterogenous nuclear ribonucleoprotein g; VCP, transitional endoplasmic reticulum ATPase. d Myeloid differentiation and proliferation potential of lineage-negative c-kit+ HSCs cultured in StemSpan and 20% media control, MSC-CdM, or CpG-MSC-CdM for 48 h (n = 6 per group). Data were analyzed by 2-way ANOVA, interaction p = 0.0675, row factor p = 0.0003. Significant comparisons by Bonferroni’s multiple comparisons tests were performed and denoted on the graph. e The number of lineage-negative, c-kit+ hematopoietic stem cells in vitro after 48 h stimulation with media control or calreticulin. Data were analyzed by unpaired t test, p = 0.0848. f C-kit+ cells were cultured in methylcellulose and colonies were quantified. Data were analyzed by 2-way ANOVA, interaction p = 0.7046. g Total cells from the colony-forming assay plate were quantified by flow cytometry. Data were analyzed by unpaired t test, p = 0.0426.

Similar articles

Cited by

References

    1. GBD 2016 Lower Respiratory Infections Collaborators . Estimates of the global, regional, and national morbidity, mortality, and aetiologies of lower respiratory infections in 195 countries, 1990-2016: a systematic analysis for the Global Burden of Disease Study 2016. Lancet Infect Dis. 2018 Nov;18(11):1191–210. 10.1016/S1473-3099(18)30310-4. - DOI - PMC - PubMed
    1. Tong S, Amand C, Kieffer A, Kyaw MH. Trends in healthcare utilization and costs associated with pneumonia in the United States during 2008-2014. BMC Health Serv Res. 2018 Sep 14;18(1):715. 10.1186/s12913-018-3529-4. - DOI - PMC - PubMed
    1. Storms AD, Chen J, Jackson LA, Nordin JD, Naleway AL, Glanz JM, et al. . Rates and risk factors associated with hospitalization for pneumonia with ICU admission among adults. BMC Pulm Med. 2017 Dec 16;17(1):208. 10.1186/s12890-017-0552-x. - DOI - PMC - PubMed
    1. Brenner H, Gondos A, Arndt V. Recent major progress in long-term cancer patient survival disclosed by modeled period analysis. J Clin Oncol. 2007 Aug 1;25(22):3274–80. 10.1200/JCO.2007.11.3431. - DOI - PubMed
    1. Gohil A, Khazeni N. Diagnostic strategy for hematology and oncology patients with acute respiratory failure. Am J Respir Crit Care Med. 2011 Jan 15;183(2):279; author reply 279-80. 10.1164/ajrccm.183.2.279a. - DOI - PubMed

Substances