. 2023 Oct 10;120(41):e2304036120.
doi: 10.1073/pnas.2304036120. Epub 2023 Oct 5.

Driving forces of the complex formation between highly charged disordered proteins

Affiliations

Driving forces of the complex formation between highly charged disordered proteins

Aritra Chowdhury et al. Proc Natl Acad Sci U S A. .

Abstract

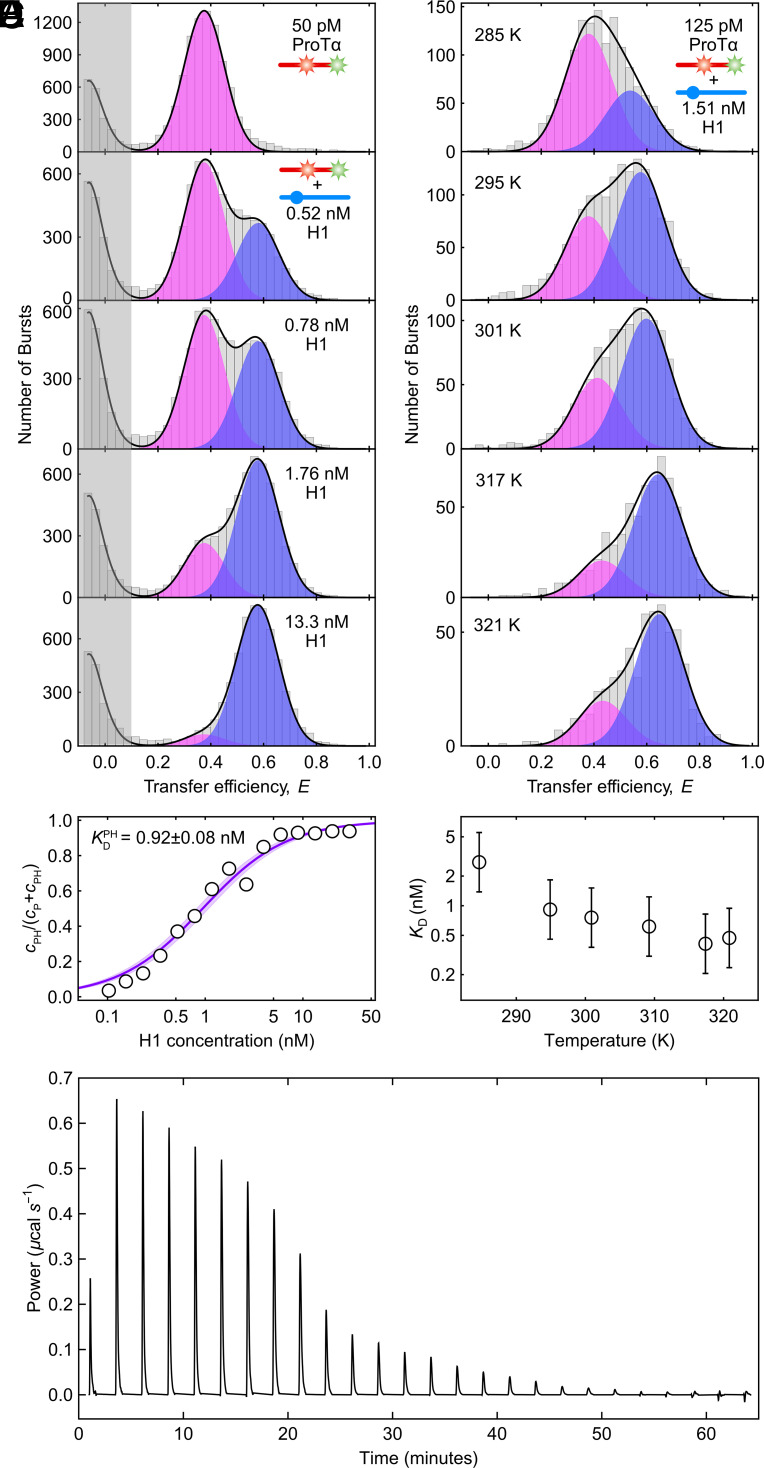
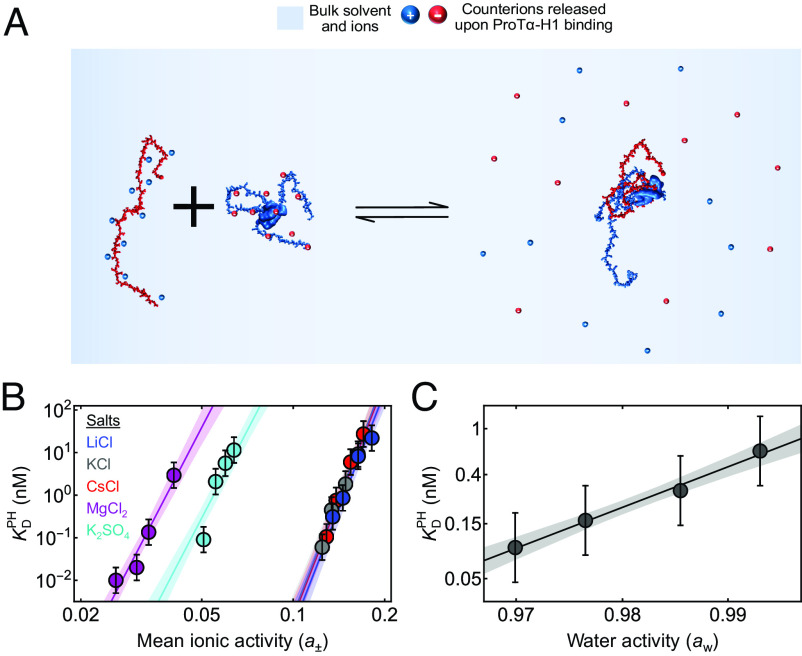
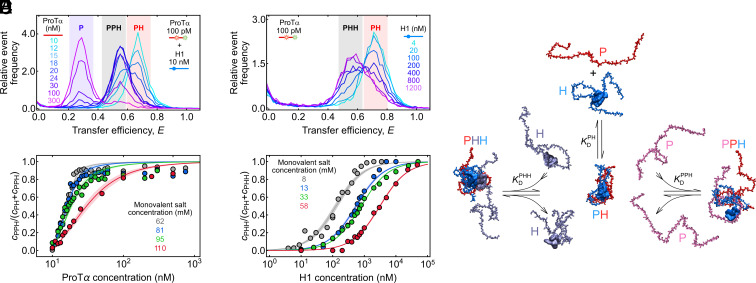
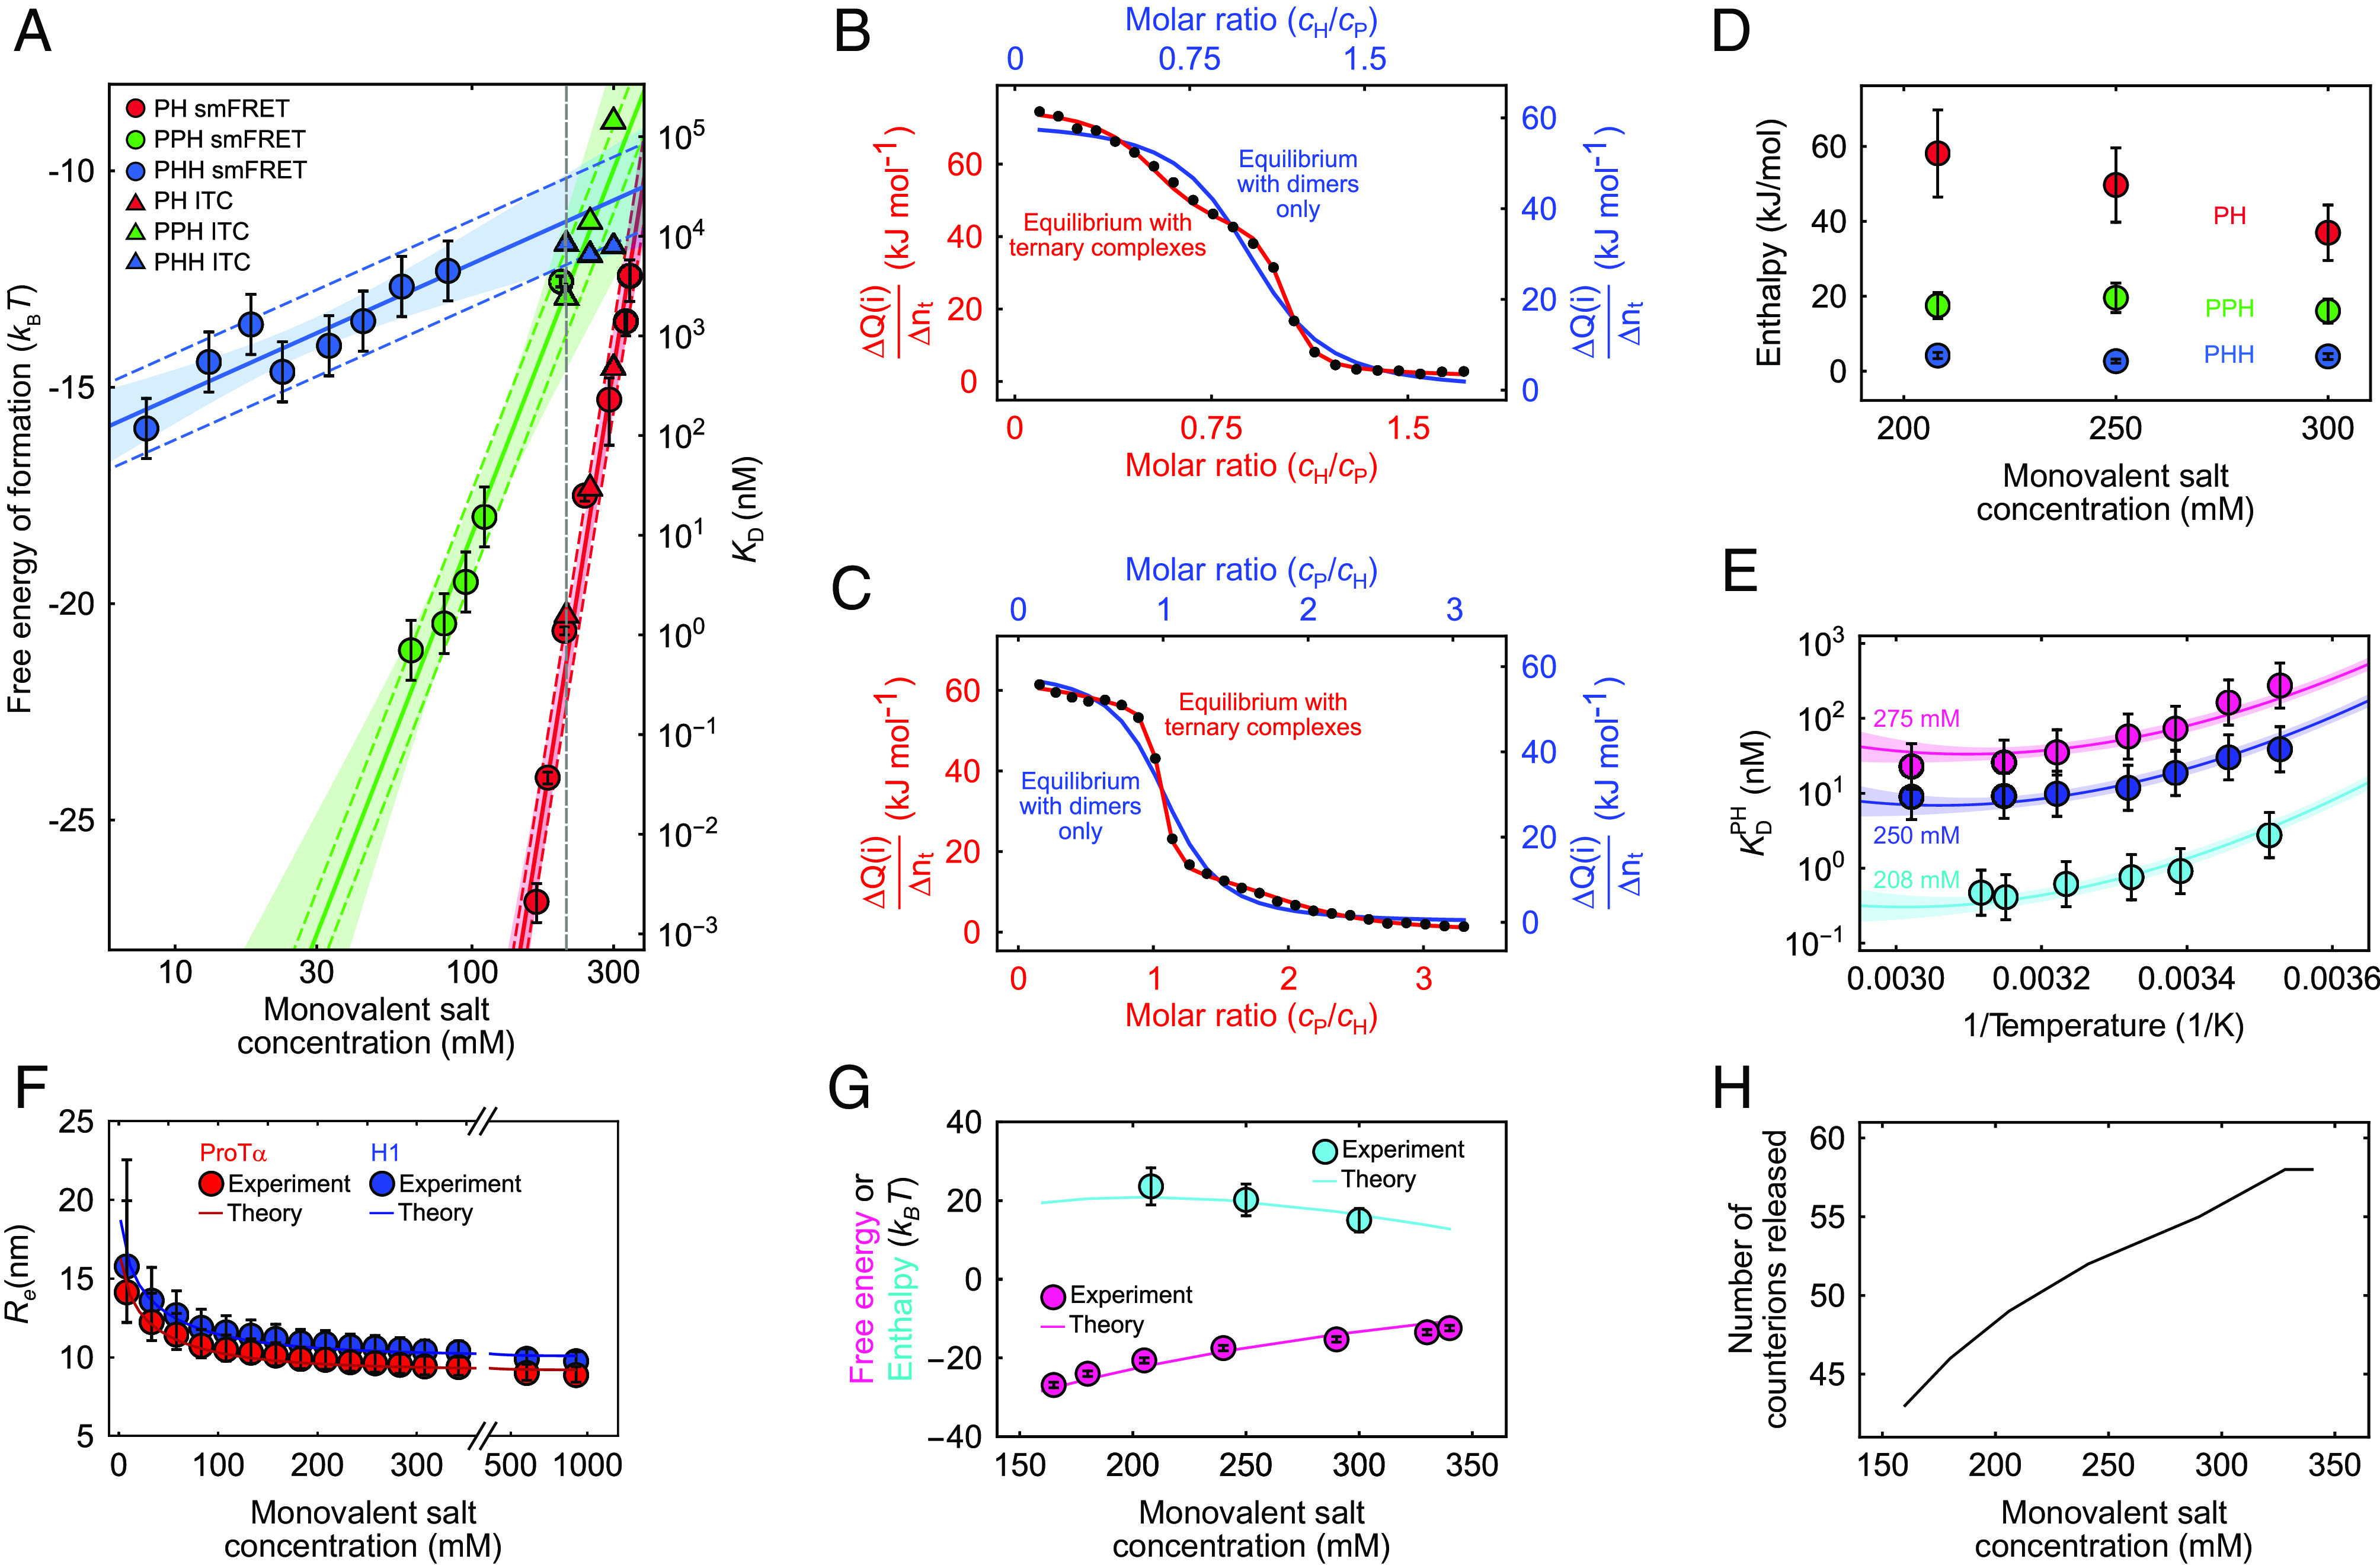
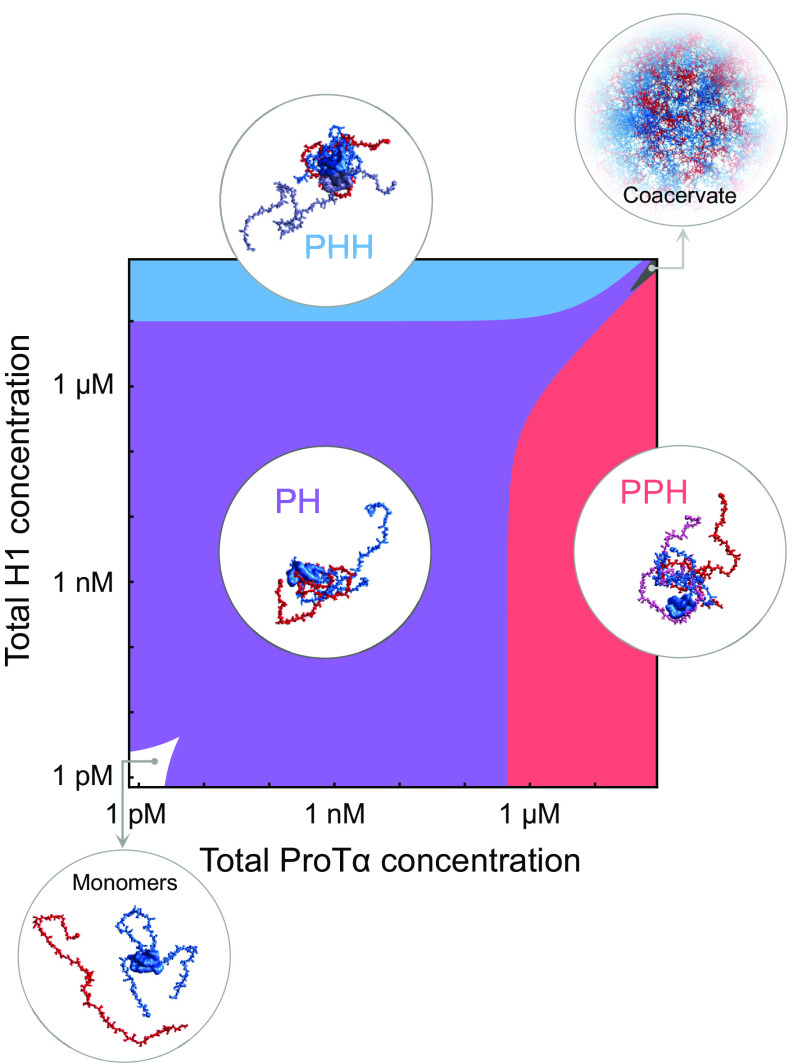
Highly disordered complexes between oppositely charged intrinsically disordered proteins present a new paradigm of biomolecular interactions. Here, we investigate the driving forces of such interactions for the example of the highly positively charged linker histone H1 and its highly negatively charged chaperone, prothymosin α (ProTα). Temperature-dependent single-molecule Förster resonance energy transfer (FRET) experiments and isothermal titration calorimetry reveal ProTα-H1 binding to be enthalpically unfavorable, and salt-dependent affinity measurements suggest counterion release entropy to be an important thermodynamic driving force. Using single-molecule FRET, we also identify ternary complexes between ProTα and H1 in addition to the heterodimer at equilibrium and show how they contribute to the thermodynamics observed in ensemble experiments. Finally, we explain the observed thermodynamics quantitatively with a mean-field polyelectrolyte theory that treats counterion release explicitly. ProTα-H1 complex formation resembles the interactions between synthetic polyelectrolytes, and the underlying principles are likely to be of broad relevance for interactions between charged biomolecules in general.

Keywords: intrinsically disordered proteins; polyelectrolyte complexation; protein binding; single-molecule spectroscopy.


Conflict of interest statement

The authors declare no competing interest.

Figures

Fig. 1.
Fig. 1.
The high-affinity binding between H1 and ProTα is endothermic. (A) Transfer efficiency histograms of 50 pM ProTα E56C/D110C labeled with Alexa Fluors 488 and 594 in the presence of increasing concentrations of unlabeled H1 (see the legend) at 208 mM monovalent salt concentration, globally fit with two Gaussian peak functions for the unbound (magenta) and bound (blue) ProTα populations, respectively (sum: black lines). (B) Representative example showing the bound fraction of labeled ProTα as a function of the H1 concentration fitted with a binding isotherm (solid line), in this case yielding an equilibrium dissociation constant of KD = 0.92 ± 0.08 nM (shaded band: 90% CI). (C) Transfer efficiency histograms of 125 pM ProTα E56C/D110C labeled with Alexa Fluor 488/594 in the presence of 1.51 nM unlabeled H1 at 208 mM monovalent salt concentration, measured at different temperatures and fitted with two Gaussian peak functions for the unbound (magenta) and bound (blue) ProTα populations, respectively (sum: black lines). (D) The resulting temperature-dependent KD shows rising affinity with increasing temperature, thus endothermic binding. Error bars represent a conservative systematic error of a factor of 2 on KD (SI Appendix). (E) ITC thermogram, showing differential power as a function of time upon titrating ProTα into H1 at 208 mM monovalent salt concentration, which confirms endothermic binding.
Fig. 2.
Fig. 2.
Effects of ion and water activities on ProTα-H1 binding. (A) Schematic of ProTα binding to H1 associated with counterion release. (B) Equilibrium dissociation constant for ProTα-H1 binding, KDPH, at different mean ionic activities (a±) of various salts (see the legend for color code). The data are fitted globally to obtain the number of monovalent and/or divalent ions released upon ProTα-H1 complex formation (see SI Appendix for details). The solid lines represent the fit, and the shaded regions represent 90% CIs. (C) KDPH at 208 mM monovalent salt concentration as a function of water activity (aw), varied by changing the concentration of the osmolyte triethylene glycol (SI Appendix). The solid line represents a fit with Eq. 4 for estimating the apparent number of water molecules released upon ProTα-H1 complex formation (shaded band: 90% CI). All error bars represent a conservative systematic error of a factor of 2 on KD (SI Appendix).
Fig. 3.
Fig. 3.
Resolving ternary complexes with single-molecule spectroscopy at equilibrium. (A) Overlay of transfer efficiency histograms of 100 pM ProTα E56C/D110C labeled with Alexa Fluors 488/594 at 62 mM monovalent salt concentration in the presence of 10 nM unlabeled H1, with increasing concentrations of unlabeled ProTα (see legend), showing the formation of the PPH ternary complex as a separate peak. The red-, gray-, and purple-shaded regions indicate the peaks corresponding to PH, PPH, and unbound P, respectively. (B) Overlay of transfer efficiency histograms of 100 pM ProTα E56C/D110C labeled with Alexa Fluors 488/594 at 8 mM monovalent salt concentration, with increasing concentrations of unlabeled H1 (see legend), showing the formation of the PHH ternary complex as a separate peak. The red- and gray-shaded regions indicate the peaks corresponding to PH and PHH, respectively. (C and D) Fraction of ternary complexes, PPH (C) or PHH (D), as a function of unlabeled ProTα (C) or H1 concentration (D) at different monovalent salt concentrations (see legend) from the type of titrations shown in A and B. Solid lines represent fits with binding isotherms (SI Appendix); shaded regions indicate 90% CIs. (E) Schematic of ProTα (red, pink) and H1 (blue, purple) forming the PH dimer and PHH and PPH ternary complexes, using snapshots from coarse-grained simulations (59).
Fig. 4.
Fig. 4.
Thermodynamics of ProTα-H1 binding including ternary complex formation. (A) Free energies and dissociation constants of forming PH dimers (red) and the ternary complexes PPH (green) and PHH (blue) from single-molecule FRET (circles; including previously published data (13, 59)) and ITC (triangles; see SI Appendix, Fig. S2, for titrations) as a function of monovalent salt concentration and fits with Eq. 3 (or analogous for PPH and PHH, solid lines; shaded bands: 90% CIs). Error bars on single-molecule data for PH are from Borgia et al. (13); for PHH and PPH, error bars represent a conservative systematic error of a factor of 2 on KD (SI Appendix). Colored dashed lines represent ±1 kBT from the fit lines, the upper bound estimated for the perturbation from dye labeling (59). The vertical dashed gray line indicates a monovalent salt concentration of 208 mM. (B and C) Integrated power from ITC per molar amount of injected titrant (ΔQnt; black points for each injection i) as a function of the molar ratio of both proteins, upon titrating H1 into ProTα (B) and ProTα into H1 (C) at 208 mM monovalent salt concentration. The data in (B) and (C) are globally fitted either with a 1:1 binding model (blue line and blue axis labels) or with a model including PHH and PPH ternary complexes (red line and axis labels) (see SI Appendix for details; note that the molar ratio is a fit parameter and thus slightly different for the two analyses). (D) Enthalpies of forming PH (red), PPH (green), and PHH (blue) from the ITC analysis (B and C and SI Appendix, Fig. S2) as a function of monovalent salt concentration. Error bars of ±20% are from the constraints on the protein concentrations used in fitting (SI Appendix, Table S2). (E) Temperature dependence of ProTα-H1 dissociation constants from single-molecule FRET measurements, shown as Van ‘t Hoff plots, at 208 mM (cyan), 250 mM (blue), and 275 mM (magenta) monovalent salt concentration. Error bars represent a conservative systematic error of a factor of 2 on KD (SI Appendix). All three datasets are fitted globally with the integral form of the Van ‘t Hoff equation (solid lines; SI Appendix), with the heat capacity change upon binding as a shared fit parameter (SI Appendix; shaded bands: 90% CIs). (F) Salt dependence of the average end-to-end distance, Re, for ProTα (red circles) and H1 (blue circles). Re for ProTα was measured using single-molecule FRET; for H1, it is approximated using the scaling exponents for ProTα (see SI Appendix for details). Error bars are estimated from a conservative systematic error of ±0.03 on transfer efficiencies. The blue and red lines show Re for ProTα and H1, respectively, using the theory for single isolated polyelectrolyte chains (see SI Appendix for details). (G) Comparison of the experimental free energy (magenta circles) and enthalpy (cyan circles) of ProTα-H1 complex formation as a function of monovalent salt concentration with those estimated from the theory of polyelectrolyte complexation (magenta and cyan lines for enthalpy and free energy, respectively; see SI Appendix for details). Error bars on experimental free energy and enthalpy as in (A) and (D). (H) The number of counterions released upon PH formation from the theory of polyelectrolyte complexation (see SI Appendix for details).
Fig. 5.
Fig. 5.
Diagram of assembly states formed by H1 and ProTα as a function of protein concentrations at 165 mM monovalent salt. The colored regions indicate the predominant oligomeric species. If both protein concentrations are in the low picomolar range or below (white area), ProTα and H1 are predominantly monomeric. In the purple, blue, and red regions, ProTα-H1 (PH), ProTα-H12 (PHH), and ProTα2-H1 (PPH) are the predominant oligomeric species, respectively. The dark gray region at high concentrations of both proteins indicates conditions where phase separation by complex coacervation occurs (57). Note that the re-entrant boundaries for complex coacervation are approximate. The other regions are calculated based on the equilibrium dissociation constants KDPH, KDPPH, and KDPHH at 165 mM salt (SI Appendix, Eqs. S1S3). Snapshots of complexes and the dense phase are based on simulations (13, 59).

Similar articles

Cited by

References

    1. Csizmok V., Follis A. V., Kriwacki R. W., Forman-Kay J. D., Dynamic protein interaction networks and new structural paradigms in signaling. Chem. Rev. 116, 6424–6462 (2016). - PMC - PubMed
    1. Berlow R. B., Dyson H. J., Wright P. E., Functional advantages of dynamic protein disorder. FEBS Lett. 589, 2433–2440 (2015). - PMC - PubMed
    1. Dunker A. K., Cortese M. S., Romero P., Iakoucheva L. M., Uversky V. N., Flexible nets. The roles of intrinsic disorder in protein interaction networks. FEBS J. 272, 5129–5148 (2005). - PubMed
    1. Wright P. E., Dyson H. J., Linking folding and binding. Curr. Opin. Struct. Biol. 19, 31–38 (2009). - PMC - PubMed
    1. Tompa P., Fuxreiter M., Fuzzy complexes: Polymorphism and structural disorder in protein-protein interactions. Trends Biochem. Sci. 33, 2–8 (2008). - PubMed

Publication types

Substances

LinkOut - more resources