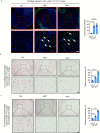
. 2023 Oct;622(7984):834-841.
doi: 10.1038/s41586-023-06611-6. Epub 2023 Oct 4.

An extra-erythrocyte role of haemoglobin body in chondrocyte hypoxia adaption

Affiliations

An extra-erythrocyte role of haemoglobin body in chondrocyte hypoxia adaption

Feng Zhang et al. Nature. 2023 Oct.

Erratum in

Abstract

Although haemoglobin is a known carrier of oxygen in erythrocytes that functions to transport oxygen over a long range, its physiological roles outside erythrocytes are largely elusive1,2. Here we found that chondrocytes produced massive amounts of haemoglobin to form eosin-positive bodies in their cytoplasm. The haemoglobin body (Hedy) is a membraneless condensate characterized by phase separation. Production of haemoglobin in chondrocytes is controlled by hypoxia and is dependent on KLF1 rather than the HIF1/2α pathway. Deletion of haemoglobin in chondrocytes leads to Hedy loss along with severe hypoxia, enhanced glycolysis and extensive cell death in the centre of cartilaginous tissue, which is attributed to the loss of the Hedy-controlled oxygen supply under hypoxic conditions. These results demonstrate an extra-erythrocyte role of haemoglobin in chondrocytes, and uncover a heretofore unrecognized mechanism in which chondrocytes survive a hypoxic environment through Hedy.


Conflict of interest statement

The authors declare no competing interests.

Figures
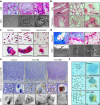
Fig. 1
Fig. 1. Eosin-positive structures consisting of haemoglobin in the cartilaginous tissues.
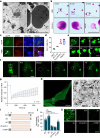
a, Haematoxylin and eosin (H&E) staining indicate eosin-positive structures (black arrows) in the hypertrophic chondrocytes of the cartilaginous growth plate of P7 mice (zoomed-in images of the middle and right top panels), which were confirmed by scanning electron microscopy (SEM) (white arrows; bottom panels). The blue arrows indicate RBCs in the bone marrow. Scale bars, 10 μm. b, The eosin-positive structures (black arrows) in hypertrophic chondrocytes of ribs (top panels) and calcaneus (bottom panels) of E15.5 mice. Scale bars, 10 μm. c, The presence of eosinophilic structures (black arrows) in chondrocytes of the resting, proliferative and hypertrophic zones of growth plates from E18.5 mice by Masson trichrome staining. The blue arrows indicate nuclei. Scale bars, 10 μm. d, The presence of eosinophilic structures (black arrows) in the non-hypertrophic zone of femoral articular cartilage from a man 16 years of age (zoomed-in images of the middle and right top panels), which were confirmed by SEM (white arrows; bottom panels). The blue arrows indicate RBCs in the bone marrow. Scale bars, 10 μm. e, Immunohistochemistry (top panels) and immunoelectron microscope staining (iTEM; bottom panels) of HBA and HBB in mouse humeral cartilage from P3 mice. Scale bars, 50 μm (top and middle row panels) and 5 μm (iTEM). f, The expression of HBA and HBB in chondrocytes isolated from P7 mouse humeral cartilage as detected by immunohistochemistry staining. The black arrows indicate haemoglobin. Scale bar, 50 μm.
Fig. 2
Fig. 2. Phase separation promotes Hedy formation.
a, Transmission electron microscopy showed the condensate structures (black arrow) in the cytoplasm of hypertrophic chondrocytes from the growth plates of E14.5 mice. Scale bar, 5 μm. b, Hyposmotic rupture by ddH2O incubation led to the release of the eosin-positive structures (black arrows) from the humeral cartilage chondrocytes of P7 mice. Scale bar, 10 μm. c, Representative images of eGFP and HBB–eGFP expressed in 293T cells. CAAX in red indicates the cell membrane. Hoechst in blue indicates cell nuclei. The arrow indicates foci formed by HBB–eGFP. Scale bars, 20 μm. d, Quantification of foci formation in different cell lines. Data are mean ± s.d. of 3 or more fields with more than 300 cells analysed each. e, Image sequence shows an example of fusion of two HBB–eGFP foci. Scale bars, 10 μm (original view) and 2 μm (zoomed-in views). f, Image sequence shows an example of the fluorescence recovery after photobleaching experiment of HBB–eGFP foci. Scale bars, 10 μm (original view) and 5 μm (zoomed-in views). g, Quantification of fluorescence recovery after photobleaching data (mean ± s.e.m.; n = 10 experiments) for HBB–eGFP foci. ROI, region of interest. h, Fluorescence (left) and electron transmission microscopic (right) images of HBB–eGFP condensate by correlative light and electron microscopy. Scale bars, 10 μm (left) and 500 nm (right). i, Schematic demonstration of Hbb mutants with truncations in single or combined disorder motifs (grey boxes) (∆N, ΔC, and ΔN and ΔC), or with a point mutation of A139P (red bar). j,k, Quantification (j) and representative images (k) of foci formation of the indicated HBB–eGFP mutants in 293T cells. n > 200 cells over 3 biologically independent experiments. Error bars represent s.e.m. P values were calculated using two-tailed Student’s t-test (j). *P < 0.05, **P < 0.01 and ****P < 0.0001. Scale bar, 200 μm. Source data
Fig. 3
Fig. 3. Globin switching and expression regulation of haemoglobin in chondrocytes.
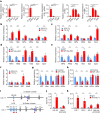
a, Expression of haemoglobin in cartilages from mice at different developmental stages by RT–qPCR. *P = 0.0104 (Hba) and 0.0179 (Hbb), and ****P < 0.0001. b,c, Expression level of the indicated genes in 4-day in vitro cultured cartilaginous tissues (b) and primary chondrocytes culture for 12 h (c). For panel b, ***P = 0.0003 (Hba), ***P = 0.0007 (Hbb), **P = 0.0029 (Hif1a), P = 0.5285 (Hif2a), **P = 0.0042 (Epo) and **P = 0.0030 (Epor). For panel c, ***P = 0.0007 (Hba), ***P = 0.0008 (Hbb), **P = 0.0016 (Hif1a), P = 0.8062 (Hif2a), **P = 0.0031 (Epo) and ***P = 0.0002 (Epor). d,e, Expression of the indicated genes in primary cultured chondrocytes upon conditional knockout (cKO) of both Hif1a and Hif2a (Hif1/2a) in either 20% (d) or 1% (e) O2 for 6 h. For panel d, **P = 0.0017 (Hif1a), ***P = 0.0009 (Hif2a), **P = 0.0027 (Hba), **P = 0.0067 (Hbb), ***P = 0.0001 (Epo) and P = 0.1996 (Epor). For panel e, **P = 0.0065 (Hif1a), **P = 0.0018 (Hif2a), *P = 0.0236 (Hba), *P = 0.0198 (Hbb), *P = 0.0270 (Epo) and P = 0.0671 (Epor). f, Expression of the indicated genes in the primary chondrocyte culture in 20% or 1% O2 for 6 h. **P = 0.0098 (Klf1). g,h, Expression of the indicated genes in primary cultured chondrocytes upon cKO of Klf1 in either 20% (g) or 1% (h) O2 for 6 h. For panel g, **P = 0.0030 (Klf1), **P = 0.0030 (Hba), **P = 0.0031 (Hbb), P = 0.5240 (Hif1a) and P = 0.0919 (Hif2a). For panel h, **P = 0.0014 (Klf1), **P = 0.0031 (Hba), **P = 0.0031 (Hbb), P = 0.1152 (Hif1a) and P = 0.5463 (Hif2a). i, Schematic loci of mouse globin. βmaj, βmajor; βmin, βminor; Chr., chromosome; HS, DNase I hypersensitive site; LCR, locus control region; pro., promotor. The red triangles indicate KLF1-binding sites. j,k, ChIP–qPCR results for KLF1 binding to the LCR and promoters of α-globin (j) and β-globin (k) loci in chondrocytes. P = 0.0014 (HS26), 0.0052 (Hba1-pro), 0.0027 (HS-1), 0.0087 (HS-2), 0.0078 (HS-3), 0.0023 (Hbb-bs-Pro). n = 3 biologically independent experiments (ch,j,k) or samples (a,b). All error bars represent s.e.m. P values were calculated using one-way ANOVA test (a) or two-tailed Student’s t-test (bh,j,k); adjustment was not made for multiple comparisons. Source data
Fig. 4
Fig. 4. Haemoglobin is essential for chondrocyte hypoxia adaption and survival of the fetal cartilage.
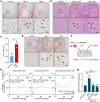
a, Histological examination of proximal humeral cartilages from P5 mice of different genotypes. The arrows indicate dead chondrocytes. Scale bar, 50 μm. n = 6 biologically independent samples. b, Histological images of proximal humerus from newborn mice upon cKO of the Hbb gene. Control: Hbb+/+/Col2a1-CreERT2 mice, Hbb-H-cKO: HbbF/+/Col2a1-CreERT2 mice (heterozygous deletion), and Hbb-cKO: HbbF/F/Col2a1-CreERT2 mice. The arrows indicate dead chondrocytes. Scale bar, 50 μm. n = 6 biologically independent samples. c, Quantification of EF5-positive cells in cartilages from WT and Hbb-cKO mice. n = 3 biologically independent samples for each. Error bars represent s.e.m. **P = 0.0080. d, Histological examination of cartilages of E18.5 mice cultured in vitro under hypoxia (1% O2) for 3 days. Black arrows indicate the dead chondrocytes. Scale bar, 50 μm. e, Oxygen dissociation curves of RBCs, WT and Hbb-cKO chondrocytes. The chondrocytes of Hbb-cKO displayed poor oxygen-binding capability as indicated by the fluctuated curve. Counts indicate the measurement time (in seconds), the horizontal grey lines indicate oxygen partial pressures in the environment of chondrocytes. f, Schematic diagram of the nest co-culture experiment, in which the hypoxia-responsive cells were cultured in the inner dish, whereas the RBCs or the haemoglobin condensates were placed in the outer dish that was sealed for 24 h to create hypoxic conditions. g, Expression of Hif1a under the indicated conditions of nest co-culture as examined by qPCR. The data are mean ± s.e.m. of triplicate experiments; two-sided Student’s t-test was used for the data analysis, and adjustment was not made for multiple comparisons. **P = 0.0019 (phosphate-buffered saline), P = 0.6454 (HBA/HBB) and P = 0.4890 (RBC). NS, not significant. Source data
Extended Data Fig. 1
Extended Data Fig. 1. Identification of hemoglobin in chondrocytes.
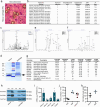
a, Images for cartilages of P6 (6 days postnatal) mice before (insert) and post laser-based microdissection. Black arrows indicated eosin-positive structures. Scale bar: 10 μm. b, List of top proteins in the eosin-positive structures identified by mass spectrometry analysis. For whole data, see Supplementary Table 1. c, Mass spectrometry analysis of samples from laser capture microdissection. The samples dissected from about 200 chondrocytes were pooled into the cap of a 0.5-mL microcentrifuge tube and dissolved in tissue extraction buffer for mass spectrometry. d, SDS-PAGE of protein extracts from chondrocytes and blood. Black arrow and rectangles indicated the position of hemoglobin. e, f, Mass spectrometry analysis of proteins from red blood cells (e) and cartilages (f) on SDS-PAGE gel. g, h, Mass spectrometry (g) and Western blot (h) confirmed the presence of hemoglobin beta subunit (Hbb), and alpha subunit (Hba) in cartilages. For whole data, see Supplementary Table 2. For gel source data, see Supplementary Fig. 1a. i-k, RNA-seq (i) and quantitative proteomic analysis (j, k) to quantify the expression of Hba and Hbb in cartilaginous tissues. Data are presented as mean ± SEM, Error bars represent SEM. (n = 3 biologically independent samples).
Extended Data Fig. 2
Extended Data Fig. 2. Spatial localization of lipid, RNA and Hedy.
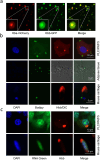
a, Representative images of hemoglobin bodies formed with Hba-mCherry and Hbb-EGFP in HEK293T cells. b, Representative images for lipid and hemoglobin staining in PLC/PR/F5 cells, adipose tissue, cartilage tissue. Nuclei are in blue, Hbb in red, lipid droplets in green. Scale bars are indicated. c, Representative images for RNA and hemoglobin staining in PLC/PR/F5 cells and cartilage tissue. Nuclei are in blue, Hbb in red, RNA in green. Scale bars are indicated.
Extended Data Fig. 3
Extended Data Fig. 3. Liquid phase separation of the purified untagged Hbb in vitro.
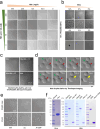
a, Droplet formation of the purified untagged Hbb in different conditions, buffer (PBS: KH2PO4/K2HPO4, pH 7.35, PEG2000 10% (w/v)). Scale bar: 20 μm. b, Droplet formation of the purified untagged Hbb at different PEG concentrations in phase separation buffer (150 Mm KH2PO4/K2HPO4, pH 7.35, PEG2000 variable (w/v)). Scale bar: 20 μm. c, Droplet formation of the purified untagged Hba, Hbb and the mixture of them at the same protein concentration in phase separation buffer (150 mM KH2PO4/K2HPO4, pH 7.35, PEG2000 10% (w/v)). Scale bar: 30 μm. d, Timelapse imaging of the purified untagged Hbb droplet fusion. Scale bar: 5 μm. e, Droplet formation of the purified Hbb and its IDR mutants in phase separation buffer (150 mM KH2PO4/K2HPO4, pH 7.35, PEG2000 10% (w/v)). Scale bar: 25 μm, 10 μm. f, Coomassie brilliant blue stained gels of the purified Hba, Hbb and Hbb mutants.
Extended Data Fig. 4
Extended Data Fig. 4. Identification of Hbb condensates by correlative light and electron microscopy and immune electron transmission microscopy.
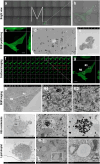
a, Large field view of cells plated on grid glass bottom dish in merged bright and fluorescent channels. M marks the grid with cells of interest. b, zoom-in view of cells within the boxed region in (a). c, composite Z-stack view of cells expressing Hbb-EGFP in (b) by confocal microscopy. Scale bar: 10 μm. d, ultra-thin section image of cells within the field of (a) by scanning electron microscopy. e, zoom-in view of cells within the boxed region in (d). Scale bar: 50 μm. f, split confocal images for the cells of interest in (c) from a row of bottom-up with a Z-step of 0.15 μm. the images within red box are corresponding to the view in (e). g, zoom-in view of image within the boxed region in (f). Hbb-EGFP condensates are indicated as R1 and R2. Scale bar: 10 μm. h, scanning electron microscopy image (left) corresponding to the confocal image (g). Scale bar: 10 μm. R1 and R2 regions are displayed in the right in zoomed view. Scale bar: 500 nm. i, Hbb condensate identified by immune electron transmission microscopy. Boxed regions are zoomed in the right. Scale bars are indicated. j, Lipid droplets detected by electron transmission microscopy. Boxed regions are zoomed in the right. Scale bars are indicated.
Extended Data Fig. 5
Extended Data Fig. 5. Expression of hemoglobin in chondrocytes with Hif-1α and/or Hif-2α deletion.
a, Detection of DNA recombinatrion by Hif-1α-LoxP qPCR of genomic DNA extracted from Hif-1αF/F (Ctrl), Hif-1αF/+/Col2a1-CreERT2 (heterozygous deletion, Hif-1α-H-cKO) or Hif-1αF/F/Col2a1-CreERT2 (Hif-1α-cKO) growth plates of P5 mice, which were treated by tamoxifen (100 mg/kg) for 4 days. Data were normalized to β2-microglobulin (n = 3 biologically independent samples). b, Western blot analysis of Hif-1α protein level in primary cultured chondrocytes in either 20% or 1% O2 for 6 h. For gel source data, see Supplementary Fig. 1c. c, Quantification of all biological replicates for Extended Data Fig. 6b. Data were normalized to α-tubulin (n = 3 biologically independent samples). d, Conditional knockout of Hif-1a resulted in massive cell death in the center of cartilaginous growth plate. Scale bar: 50 μm. n = 6 biologically independent samples. e, Hif-2α-LoxP qPCR of genomic DNA extracted from Hif-2αF/F (Ctrl) or Hif-2αF/F/Col2a1-CreERT2 (Hif-2α-cKO) growth plates of P5 mice, which were treated by tamoxifen (100 mg/kg) for 4 days. Data were normalized to β2-microglobulin (n = 3 biologically independent samples). f, Quantification of Hif-2α protein by Western blot analysis of total protein lysate extracted from Ctrl (Hif-2αF/F), Hif-2α-H-cKO (heterozygous deletion, Hif-2αF/+/Col2a1-CreERT2) or Hif-2α-cKO (Hif-2αF/F/Col2a1-CreERT2) primary cultured chondrocytes in either 20% or 1% O2 for 6 h. A representative Western blot is shown on the left, and quantification of all biological replicates is provided on the right. Data were normalized to α-tubulin (n = 3). For gel source data, see Supplementary Fig. 1d. g, Conditional knockout of Hif-2a resulted in no massive cell death in the center of P5 Hif-2α-cKO cartilaginous growth plate. Scale bar: 50 μm. n = 6 biologically independent samples. h, Expression of the indicated genes in chondrocytes of mouse fetal growth plates upon conditional knockout of Hif-1α. n = 3 biologically independent samples. i, Expression of the indicated genes in primary cultured chondrocytes of mouse fetal growth plates upon conditional knockout of Hif-1α in 1% O2 for 6 h. n = 3 biologically independent samples. j, k, Expression of the indicated genes in primary cultured chondrocytes of mouse fetal growth plates upon conditional knockout of Hif-2α in either 20% (j) or 1% O2 (k) for 6 h. n = 3 biologically independent samples. l, Hif-1α and Hif-2α (Hif-1/2α) LoxP qPCR of genomic DNA extracted from Hif-1αF/F/Hif-2αF/F (Ctrl) or Hif-1αF/F/Hif-2αF/F/Col2a1-CreERT2 (Hif-1/2α-cKO) growth plates of P5 mice, which were treated by tamoxifen (100 mg/kg) for 4 days. Data were normalized to β2-microglobulin (n = 3 biologically independent samples). m, Quantification of Hif-1α and Hif-2α protein by Western blot analysis of total protein lysate extracted from Ctrl or Hif-1/2α-cKO primary cultured chondrocytes in either 20% or 1% O2 for 6 h. A representative Western blot is shown on the left, and quantification of all biological replicates is provided on the right. Data were normalized to α-tubulin (n = 3 biologically independent samples). For gel source data, see Supplementary Fig. 1e. Error bars represent SEM. P values were calculated using one-way ANOVA tests (a, c, f, h, i) or two-tailed Student’s t-test (e, j, k, m, l). The exact P-values of comparison are presented in the figures, respectively. Source data
Extended Data Fig. 6
Extended Data Fig. 6. Effects of compounds regulating Hifs activity on hemoglobin expression.
a-e, Expression of Hba, Hbb and Epo mRNA of primary cultured chondrocytes in 20% O2 with increased dose of compounds targeting either Hif-1α or Hif-2α for 6 h. The inhibitor of Hif-1α: GN44028. The inhibitors of Hif-2α: PT2385 or PT2399. The activator of Hif-1α and Hif-2α: IOX2 or Roxadustat. n = 3 biologically independent experiments. f, g, Expression of Hba, Hbb and Epo mRNA of primary cultured chondrocytes in either 20% or 1% O2 with compounds targeting either Hif-1α or Hif-2α for 6 h. n = 3 biologically independent experiments. h, i, Quantification of Hif-1α or Hif-2α protein by Western blot analysis of total protein lysate extracted from primary cultured chondrocytes in either 20% or 1% O2 with compounds targeting either Hif-1α or Hif-2α for 6 h. A representative Western blot is shown on the left. Quantification of all biological replicates is provided on the right. Data for Hif-1α or Hif-2α were normalized to α-tubulin (n = 3 biologically independent experiments). For gel source data, see Supplementary Fig. 1f,g. j, k, Expression of Hba, Hbb and Epo mRNA of primary cultured chondrocytes in either 20% (j) or 1% (k) O2 with compound DMOG (50 μM), the activator of Hif-1α and Hif-2α for 6 h. n = 3 biologically independent experiments. l, Quantification of Hif-1α or Hif-2α protein by Western blot analysis of total protein lysate extracted from primary cultured chondrocytes in either 20% or 1% O2 with compound DMOG for 6 h. A representative Western blot is the left. Quantification of all biological replicates is provided on the right. Data for Hif-1α or Hif-2α were normalized to α-tubulin (n = 3 biologically independent experiments). For gel source data, see Supplementary Fig. 1h. Error bars represent SEM. P values were calculated using one-way ANOVA tests (a-i, l) or two-tailed Student’s t-test (j, k). The exact P-values of comparison are presented in the figures, respectively. Source data
Extended Data Fig. 7
Extended Data Fig. 7. Regulation of hemoglobin expression by Klf1.
a, Klf1-LoxP qPCR of genomic DNA extracted from Klf1F/F(Ctrl) or Klf1F/F/Col2a1-CreERT2 (Klf1-cKO) growth plates of P5 mice, which were treated by tamoxifen (100 mg/kg) for 4 days. Data were normalized to β2-microglobulin (n = 3 biologically independent samples). b, Quantification of Klf1 protein by Western blot analysis of total protein lysate extracted from Ctrl or Klf1-cKO primary cultured chondrocytes. A representative Western blot is shown on the left, and quantification of all biological replicates is provided on the right. Data were normalized to α-tubulin (n = 3 biologically independent samples). For gel source data, see Supplementary Fig. 1i.c, d Expression of Klf1, Hba, Hbb, Hif-1α and Hif-2α in the primary chondrocytes upon Klf1 depletion by RNA interference in either 20% (c) or 1% (d) O2. n = 3 biologically independent experinmets. e, Quantification of Klf1 protein by Western blot analysis of total protein lysate extracted from Ctrl or Klf1 depletion by RNA interference primary cultured chondrocytes in either 20% or 1% O2. A representative Western blot is shown on the left, and quantification of all biological replicates is provided on the right. Data were normalized to α-tubulin (n = 3 biologically independent experinmets). For gel source data, see Supplementary Fig. 1j. f, Expression of Hba, Hbb, Hif-1α and Hif-2α in ATDC5 chondrocyte cell lines upon Klf1 knockdown as examined by quantitative PCR. The data are mean with SEM of triplicate experiments. Error bars represent SEM. P values were calculated using one-way ANOVA tests (a-f). The exact P-values of comparison are presented in the figures, respectively. Source data
Extended Data Fig. 8
Extended Data Fig. 8. H3K4me3 demethylase Kdm5a rather than Kdm5b modulates Klf1 expression.
a, b, Expression of the indicated genes in primary cultured chondrocytes of mouse fetal growth plates upon conditional knockout of Hif-1α in either 20% O2 (a) or 1% O2 for 6 h (b). n = 3 biologically independent samples. c, d, Expression of the indicated genes in primary cultured chondrocytes of mouse fetal growth plates upon conditional knockout of Hif-2α in either 20% O2 (c) or 1% O2 for 6 h (d). n = 3 biologically independent samples. e, f, Expression of the indicated genes in primary cultured chondrocytes of mouse fetal growth plates upon conditional knockout of both Hif-1α and Hif-2α (Hif-1/2α) in either 20% O2 (e) or 1% O2 for 6 h (f). n = 3 biologically independent samples. g, Quantification of Kdm5a protein by Western blot analysis of total protein lysate extracted from Ctrl or si-Kdm5a primary cultured chondrocytes. A representative Western blot is shown on the left, and quantification of all biological replicates is provided on the right. Data were normalized to α-tubulin (n = 3 biologically independent experiments). For gel source data, see Supplementary Fig. 1k. h, Quantification of Kdm5b protein by Western blot analysis of total protein lysate extracted from Ctrl or si-Kdm5b primary cultured chondrocytes. A representative Western blot is shown on the left, and quantification of all biological replicates is provided on the right. Data were normalized to α-tubulin (n = 3 biologically independent experiments). For gel source data, see Supplementary Fig. 1l. i, j, Expression of the indicated genes in primary cultured chondrocytes upon knockdown of Kdm5a or Kdm5b in either 20% (i) or 1% O2 (j) for 6 h. n = 3 biologically independent experiments. k, l, ChIP-qPCR analysis results of H3K4me3 for the indicated genes in primary cultured chondrocytes siRNA depleted of Kdm5a in either 20% (k) or 1% O2 (l). The data are mean with SEM of triplicate experiments. P values were calculated using two-tailed Student’s t-test (a-f) or one-way ANOVA tests (g-l). The exact P-values of comparison are presented in the figures, respectively. Source data
Extended Data Fig. 9
Extended Data Fig. 9. Phenotypes of mice with Hbb conditional knockout by Col2a1-Cre.
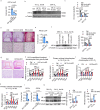
a, Hbb-LoxP qPCR of genomic DNA extracted from HbbF/F (Ctrl), HbbF/+/Col2a1-CreERT2 (heterozygous deletion, Hbb-H-cKO) or HbbF/F/Col2a1-CreERT2 (Hbb-cKO) growth plates of P5 mice, which were treated by tamoxifen (100 mg/kg) for 4 days. Data were normalized to β2-microglobulin (n = 3 biologically independent samples). b, Quantification of Hbb mRNA by qRT-PCR of total RNA extracted from P5 HbbF/F (Ctrl), Hbb-H-cKO or Hbb-cKO growth plates. Data were normalized to Gapdh (n = 3 biologically independent samples). c, Quantification of Hbb protein by Western blot analysis of total protein lysate extracted from P5 HbbF/F (Ctrl), Hbb-H-cKO or Hbb-cKO growth plates. A representative Western blot is shown on the left, and quantification of all biological replicates is provided on the right. Data were normalized to α-tubulin (n = 3 biologically independent samples). For gel source data, see Supplementary Fig. 1q. d, For the Hbb-cKO mice, two of six newborn mice were dead fetus (left panel, black arrows). One more newborn died with purplish skin (right figure, black arrow) 8 hours after birth. The other three living newborn mice died in 1-7 days after birth with purplish skin (Supplementary Video 1). Scale bars: 3 mm. e, Histology examination (two upper panels) or TUNEL assay (two bottom panels) of proximal humeral cartilages of E16.5 HbbF/F (Ctrl), Hbb-H-cKO or Hbb-cKO mice. Scale bars, 50 μm. n = 3 biologically independent samples. f, g Histology examination (two upper panels) or TUNEL assay (two bottom panels) of proximal humeral cartilages of P1 HbbF/F (Ctrl), Hbb-H-cKO or Hbb-cKO mice. Quantification of all biological replicates is provided (g). Arrows indicated dead chondrocytes. Green fluorescence marked the dead cells. Scale bars, 50 μm. n = 3 biologically independent samples. h, i, Histological images of distal humerus from P5 Hbb-cKO mice showed massive chondrocytes death in the center of cartilaginous tissues upon conditional knockout of Hbb gene. Quantification of all biological replicates is provided (i). Arrows indicated dead chondrocytes. Scale bars, 50 μm. n = 3 biologically independent samples. j, k TUNEL assay of HbbF/F (Ctrl), Hbb-H-cKO, and Hbb-cKO proximal humeral cartilages of P5 mice. Arrows indicated dead chondrocytes. Green fluorescence marked the dead cells. Quantification of all biological replicates is provided (k). Scale bars, 50 μm. n = 3 biologically independent samples. Error bars represent SEM. P values were calculated using one-way ANOVA tests (a-c, g, i, k). The exact P-values of comparison are presented in the figures, respectively. Source data
Extended Data Fig. 10
Extended Data Fig. 10. Phenotypes of the growth plate from mice with Hbb conditional knockout by Col2a1-Cre.
a, Hbb-LoxP qPCR of genomic DNA extracted from HbbF/F (Ctrl) or HbbF/F/Col2a1-CreERT2 (Hbb-cKO) growth plates of P3, P4 or P5 mice, which were treated by tamoxifen (100 mg/kg) for once at P2. Data were normalized to β2-microglobulin (n = 3 biologically independent samples). b, Quantification of Hbb protein by Western blot analysis of total protein lysate extracted from HbbF/F (Ctrl) or HbbF/F/Col2a1-CreERT2 (Hbb-cKO) growth plates of P3, P4 or P5 mice, which were treated by tamoxifen (100 mg/kg) for once at P2. A representative Western blot is shown on the left, and quantification of all biological replicates is provided on the right. Data were normalized to α-tubulin (n = 3 biologically independent samples). For gel source data, see Supplementary Fig. 1r. c, Histology examination (two upper panels) or TUNEL assay (two bottom panels) of proximal humeral cartilages of HbbF/F (Ctrl) or HbbF/F/Col2a1-CreERT2 (Hbb-cKO) growth plates of P3, P4 or P5 mice, which were treated by tamoxifen (100 mg/kg) for once at P2. Quantification of all biological replicates is provided on the right. Arrows indicated dead chondrocytes. Green fluorescence marked the dead cells. Scale bars, 50 μm. n = 3 biologically independent samples. Error bars represent SEM. P values were calculated using two-tailed Student’s t-test (a-c). The exact P-values of comparison are presented in the figures, respectively. Source data
Extended Data Fig. 11
Extended Data Fig. 11. Impacts of Hbb conditional knockout on Hedy, hypoxia response and metabolism in chondrocytes of growth plate.
a, Compromised formation of hemoglobin body in chondrocytes upon conditional Hbb knockout (Hbb-cKO) as indicated by TEM. Scale bar, 5 μm. b, Hbb-LoxP qPCR of genomic DNA extracted from HbbF/F (Ctrl) or HbbF/F/Col2a1-CreERT2 (Hbb-cKO) growth plates of P3 mice, which were treated by tamoxifen (50 mg/kg) at E18.5. Data were normalized to β2-microglobulin (n = 3 biologically independent samples). c, Quantification of Hbb mRNA by qRT-PCR of total RNA extracted from HbbF/F (Ctrl) or HbbF/F/Col2a1-CreERT2 (Hbb-cKO) growth plates of P3 mice, which were treated by tamoxifen (50 mg/kg) at E18.5. Data were normalized to Gapdh (n = 3 biologically independent samples). d, Quantification of Hbb protein by Western blot analysis of total protein lysate extracted from HbbF/F (Ctrl) or HbbF/F/Col2a1-CreERT2 (Hbb-cKO) growth plates of P3 mice, which were treated by tamoxifen (50 mg/kg) at E18.5. A representative Western blot is shown on the left, and quantification of all biological replicates is provided on the right. Data were normalized to α-tubulin (n = 3 biologically independent samples). For gel source data, see Supplementary Fig. 1s. e, Impaired Hedy formation in Hbb-cKO cartilage of P3 mice, which were treated by tamoxifen (50 mg/kg) at E18.5. Black arrows indicated Hedies. Scale bars: 10 μm. n = 6 biologically independent samples. f, Representative images for EF5 (in red, up panel) and Hif-1α (in green, bottom panel) staining of cartilages from WT and Hbb-cKO mice. DAPI in blue for nuclei. Scale bars: 50 μm. g, Representative images for EF5 staining of newborn growth plates with the indicated genotypes, which were centrifuge at 0 or 100 g for 30 minutes at room temperature. Quantification of all biological replicates is provided on the right. Scale bars: 50 μm. The data are mean with SEM of triplicate experiments. h, Representative images for Hif-1α staining of cartilages with the indicated genotypes, which were centrifuge at 0 or 100 g for 30 minutes at room temperature. Quantification of all biological replicates is provided on the right. Scale bars: 50 μm. The data are mean with SEM of triplicate experiments. i, Quantification of Hif-1α protein by Western blot analysis of total protein lysate extracted from newborn growth plates, which were centrifuge at 0, 10 or 100 g for 30 minutes at room temperature. A representative Western blot is shown on the left, and quantification of all biological replicates is provided on the right. Data were normalized to α-tubulin (n = 3 biologically independent experiments). For gel source data, see Supplementary Fig. 1t. j, Expression of Hif-1α and Hif-2α in cartilages from HbbF/F (Ctrl) and Hbb-cKO mice. n = 3 biologically independent experiments. k-m, The metabolomic assay by mass spectrometry showed that the Hbb-cKO cartilages contained higher level of intracellular lactate (k) and lower level of intracellular glucose (l), leading to a significantly increased ratio of lactate over glucose (m). n = 3 biologically independent experiments. Error bars represent SEM. P values were calculated using two-tailed Student’s t-test (b-d, j-m) or one-way ANOVA tests (g-i). The exact P-values of comparison are presented in the figures, respectively. Source data
Extended Data Fig. 12
Extended Data Fig. 12. Hypoxia tolerance of cartilage with hemoglobin depletion.
a, TUNEL assay of cartilages of E18.5 mice cultured in vitro under hypoxia for 3 days. Quantification of all biological replicates is provided on the right. Scale bars: 50 μm. The data are mean with SEM of triplicate experiments. b, c, The humeral cartilage growth plates of E14.5 mice of the indicated genotypes were cultured in hypoxic environment (1% oxygen concentration) for 6 days, significantly more chondrocytes death occurred in the growth plates of Hba (b) or Hbb (c) homozygous knockout cartilages. The dead cell areas were marked with solid black lines. Scale bar: 50 μm. n = 3 biologically independent experiments. Error bars represent SEM. P values were calculated using one-way ANOVA tests. The exact P-values of comparison are presented in the figures, respectively. Source data

Similar articles

Cited by

References

    1. Pillai, A. S. et al. Origin of complexity in haemoglobin evolution. Nature581, 480–485 (2020). - PMC - PubMed
    1. Schechter, A. N. Hemoglobin research and the origins of molecular medicine. Blood112, 3927–3938 (2008). - PMC - PubMed
    1. Semenza, G. L. Targeting HIF-1 for cancer therapy. Nat. Rev. Cancer3, 721–732 (2003). - PubMed
    1. Losman, J.-A., Koivunen, P. & Kaelin, W. G. 2-Oxoglutarate-dependent dioxygenases in cancer. Nat. Rev. Cancer20, 710–726 (2020). - PubMed
    1. Gandara, L. & Wappner, P. Metabo-Devo: a metabolic perspective of development. Mech. Dev.154, 12–23 (2018). - PubMed