. 2023 Oct 6;9(40):eadi1556.
doi: 10.1126/sciadv.adi1556. Epub 2023 Oct 4.

Simultaneous subset tracing and miRNA profiling of tumor-derived exosomes via dual-surface-protein orthogonal barcoding

Affiliations

Simultaneous subset tracing and miRNA profiling of tumor-derived exosomes via dual-surface-protein orthogonal barcoding

Yanmei Lei et al. Sci Adv. .

Abstract

The clinical potential of miRNA-based liquid biopsy has been largely limited by the heterogeneous sources in plasma and tedious assay processes. Here, we develop a precise and robust one-pot assay called dual-surface-protein-guided orthogonal recognition of tumor-derived exosomes and in situ profiling of microRNAs (SORTER) to detect tumor-derived exosomal miRNAs and enhance the diagnostic accuracy of prostate cancer (PCa). The SORTER uses two allosteric aptamers against exosomal marker CD63 and tumor marker EpCAM to create an orthogonal labeling barcode and achieve selective sorting of tumor-specific exosome subtypes. Furthermore, the labeled barcode on tumor-derived exosomes initiated targeted membrane fusion with liposome probes to import miRNA detection reagents, enabling in situ sensitive profiling of tumor-derived exosomal miRNAs. With a signature of six miRNAs, SORTER differentiated PCa and benign prostatic hyperplasia with an accuracy of 100%. Notably, the diagnostic accuracy reached 90.6% in the classification of metastatic and nonmetastatic PCa. We envision that the SORTER will promote the clinical adaptability of miRNA-based liquid biopsy.


Figures

Fig. 1.
Fig. 1.. Schematic illustration of SORTER assay for miRNA profiling of tumor-derived exosomes.
(A) The assay workflow consists of three parts. (I) Clinical plasma samples (0.2 μl, 100-fold dilution) were collected from age-matched PCa patients and BPH controls. Exosomes, ectosomes, and free molecules produced by tumor and normal cells coexist in plasma samples and exhibit overlapping compositional features. (II) SORTER assessment of miRNA profiles in tumor-derived exosomes. The SORTER assay is designed to achieve specific recognition and sorting of tumor-derived exosome subtypes and in situ sensitive probing of tumor-derived exosomal miRNA profiles. (III) Data processing and bioinformatic analysis for cancer diagnosis. The linear discriminant analysis (LDA) algorithm is used to identify the best combinations of miRNAs to classify patients with PCa from BPH controls, and the LDA model then evaluates the predicted results. (B) SORTER incorporates multiple parallel processes, including exosome recognition, importing probes, and miRNA profiling, permitting a sensitive and robust one-pot tumor-derived exosomal miRNA assay. (I) Dual-surface-protein-guided orthogonal recognition barcode for the selective labeling of tumor-derived exosomes. (II) Importation of miRNA detection probes into tumor-derived exosomes. (III) In situ sensitive profiling of miRNAs inside tumor-derived exosomes.
Fig. 2.
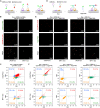
Fig. 2.. Validation of dual-surface-protein orthogonal labeling on tumor-derived exosomes.
(A) Schematics of CD63-S-L– and EpCAM-S-L–mediated orthogonal labeling on a single exosome surface. (B and C) TIRFM images (B) and NanoFCM analysis (C) show the allosteric aptamer probes of CD63-S-L and EpCAM-S-L to selectively label target proteins on LNCaP Exo and BPH-1 Exo. Experimental group: Exo + CD63-S-L (3′-labeled FAM) + EpCAM-S-L (5′-labeled Cy5). (D) Schematics of the zipper-like hybridization of the orthogonal barcode-anchored exosome (Orth-Exo) and complementary DNA tags (Tags). (E and F) TIRFM images (E) and NanoFCM analysis (F) of the zipper-like hybridization of the orthogonal barcode and Tags against LNCaP Exo and BPH-1 Exo. Control group: Exo + CD63-S-L + rEpCAM-S-L (5′-labeled Cy5, only the aptamer domain is replaced by a random sequence) + Tags (5′-labeled FAM) or Exo + rCD63-S-L + EpCAM-S-L (5′-labeled Cy5) + Tags (5′-labeled FAM); experimental group: Exo + CD63-S-L + EpCAM-S-L (5′-labeled Cy5) + Tags (5′-labeled FAM).
Fig. 3.
Fig. 3.. Dynamic monitoring of dual-surface-protein–guided liposome probe fusion.
(A) Schematic illustration of the FRET-based lipid membrane mixing for investigating the orthogonal fusion between Orth-Exo and Tags-Lipo-DiO-DiI. The fusion event was measured by the decreased FRET efficiency between the donor (DiO, 501 nm) and acceptor (DiI, 565 nm). (B) Fluorescence spectra analysis of the orthogonal fusion between Tags-Lipo-DiO-DiI and 1× and 10× molar ratios Orth-Exo. Negative control for the stochastic fusion of Lipo-DiO-DiI and Exo. (C) Fluorescence kinetic analysis of the target fusion between Tags-Lipo-DiO-DiI and Orth-Exo. Negative control for the stochastic fusion between Lipo-DiO-DiI and Exo. (D) Fusion mixing analysis of Tags-Lipo-DiO-DiI and Orth-Exo at different temperatures. Control experiment for the stochastic fusion between Lipo-DiO-DiI and Exo. The data represent the mean ± SD (n = 3). (E) TIRFM images showing the orthogonal fusion between the Tags-Lipo-DiI and Orth-Exo-DiO and the stochastic fusion between Lipo-DiI and Exo-DiO. (F) Diameters of the fusion products are determined by the DLS method at different time intervals. The data represent the mean ± SD (n = 3). (G) TEM images of Orth-Exo only, Tags-Lipo@Au NFs only, and the fusion vesicles of Tags-Lipo@Au NFs and Orth-Exo.
Fig. 4.
Fig. 4.. SORTER for tumor-derived exosomal miRNA analysis.
(A) Schematic illustration of the SORTER approach for tumor-derived exosomal miRNA analysis. (B to D) Fluorescence intensity (B), NanoFCM (C), TIRFM (D) analysis of miR-21 expression in orthogonal barcode-based BPH-1 Exo or LNCaP Exo after incubation with Tags-Lipo@Au NFs and Lipo@Au NFs, respectively. The P value was determined by a two-sided, parametric t test. The data represent the mean ± SD (n = 3). (E) Calibration curves for quantifying LNCaP-derived exosomal miR-21 spiked in PBS and EV-depleted plasma (diluted by 100-folds in 1× PBS). The data represent the mean ± SD (n = 3). (F) The Radar plot shows six miRNA markers from the four cell lines-derived exosomes, including three PCa cells (PC-3, LNCaP, and DU145) and one BPH cell (BPH-1). (G) SORTER approach for miR-21 analysis in the fused vesicles after incubating with Tags-Lipo@Au NFs and Lipo@Au NFs in healthy and cancer plasma samples. The P value was determined by a two-sided, parametric t test. The data represent mean ± SD (n = 3).
Fig. 5.
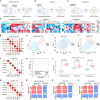
Fig. 5.. Clinical evaluation of SORTER for tumor-derived exosomal miRNA profiling.
(A to C) Schematic illustration of the miRNA analysis in the CD63+ (A), EpCAM+ (B), and CD63+EpCAM+ (C) EV subpopulations. The identification of the CD63+ or EpCAM+ EV subpopulation was performed by single-target recognition of CD63 or EpCAM protein on a single-particle membrane, and their miRNA analysis was achieved by guided fusion of Lipo@Au NFs and CD63+ or EpCAM+ EV subpopulation. (D) Heatmap of unsupervised hierarchical clustering (Pearson correlation, average linkage) of six miRNAs expression levels in CD63+, EpCAM+, and CD63+EpCAM+ EVs for distinguishing patients with PCa (n = 20) from BPH controls (n = 10). The signal intensities were averaged over triplicate measurements of each sample and normalized by min-max normalization after the background subtraction. (E to G) Correlation matrix of the expression profiles for the six miRNAs in CD63+ (E), EpCAM+ (F), and CD63+EpCAM+ EVs (G). (H to J) t-Distributed stochastic neighbor embedding (t-SNE) discriminated between patients with PCa and BPH controls using the six markers as the input in CD63+(H), EpCAM+(I), and CD63+EpCAM+ EVs (J). (K) ROC curves for the PCa signature (weighted sum of six markers by LDA) in CD63+, EpCAM+, and CD63+EpCAM+ EVs to differentiate between patients with PCa and BPH controls. (L) LDA score of the PCa signature in CD63+, EpCAM+, and CD63+EpCAM+ EVs for distinguishing patients with PCa from BPH controls. The LDA score for the binary classification was generated using a linear combination of chosen markers weighted by the respective coefficients. The P value was determined by a nonparametric, two-tailed Mann-Whitney U test. (M to O) Confusion matrix of the PCa signature in CD63+ (M), EpCAM+ (N), and CD63+EpCAM+ EVs (O). All statistical analyses were performed at 95% CIs.
Fig. 6.
Fig. 6.. SORTER for differentiation of nPCa, mPCa, and BPH in a training cohort.
(A) Heatmap showing the abundance of the six miRNAs in a training set involving age-matched patients with BPH (n = 18), mPCa (n = 11), and nPCa (n = 13). The signal intensities were averaged over triplicate measurements of each sample and normalized by min-max normalization after the background subtraction. (B and C) ROC curves of the individual markers (B) and PCa signature (C) for PCa diagnosis. (D) Correlation of the PCa signature with serum PSA to differentiate nPCa/mPCa patients and BPH controls in a training cohort. The dashed line represents the threshold values for positivity (serum PSA, 4 ng ml−1; PCa signature, 0.505). (E and F) Levels of the individual miRNA marker (E) and PCa signature (F) by SORTER approach at progressing disease stages. The overall and group pair P values were determined using Kruskal-Wallis one-way ANOVA with post hoc Dunn’s test for pairwise multiple comparisons. (G) LDA plot using six miRNAs across nPCa, mPCa, and BPH patients. (H) Confusion matrix showed that the PCa signature had an accuracy of 100% across nPCa, mPCa, and BPH patients. All statistical analyses were performed at 95% CIs.
Fig. 7.
Fig. 7.. Validation of the SORTER approach for PCa diagnosis.
(A) Heatmap showing the abundance of the indicated miRNAs in a validation set involving age-matched patients with 14 nPCa, 9 mPCa, and 9 BPH. The data processing was similar to the training cohort (Fig. 6A). (B and C) ROC curves for the individual markers or marker combinations to differentiate between patients with PCa and BPH controls in a validation cohort. (D) Correlation of the PCa signature with serum PSA to differentiate PCa and BPH. The threshold values were similar to those of the training cohort (Fig. 6D). (E and F) Levels of the individual miRNA marker (E) and PCa signature (F) by SORTER approach at progressing disease stages. The overall and group pair P values were calculated similarly to the training cohort (Fig. 6, E and F). (G) LDA plot of the first two canonical variables derived from the discriminant analysis of the training cohort. (H) Confusion matrix showed that the PCa signature had an overall accuracy of 90.6% across nPCa, mPCa, and BPH patients. All statistical analyses were performed at 95% CIs.

Similar articles

Cited by

References

    1. N. Mahtal, O. Lenoir, C. Tinel, D. Anglicheau, P. L. Tharaux, MicroRNAs in kidney injury and disease. Nat. Rev. Nephrol. 18, 643–662 (2022). - PubMed
    1. D. Santovito, C. Weber, Non-canonical features of microRNAs: Paradigms emerging from cardiovascular disease. Nat. Rev. Cardiol. 19, 620–638 (2022). - PubMed
    1. N. Jafari, P. Llevenes, G. V. Denis, Exosomes as novel biomarkers in metabolic disease and obesity-related cancers. Nat. Rev. Endocrinol. 18, 327–328 (2022). - PMC - PubMed
    1. K. A. Preethi, S. C. Selvakumar, K. Ross, S. Jayaraman, D. Tusubira, D. Sekar, Liquid biopsy: Exosomal microRNAs as novel diagnostic and prognostic biomarkers in cancer. Mol. Cancer 21, 54 (2022). - PMC - PubMed
    1. E. I. Buzas, The roles of extracellular vesicles in the immune system. Nat. Rev. Immunol. 23, 236–250 (2023). - PMC - PubMed