. 2023 Nov 10;51(20):10992-11009.
doi: 10.1093/nar/gkad803.

Compartmentalization of androgen receptors at endogenous genes in living cells

Affiliations

Compartmentalization of androgen receptors at endogenous genes in living cells

Selçuk Yavuz et al. Nucleic Acids Res. .

Abstract

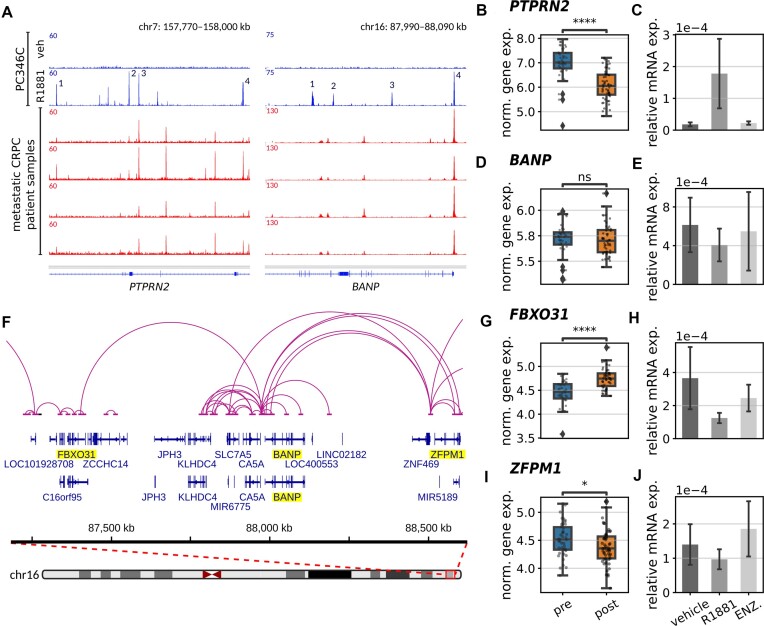
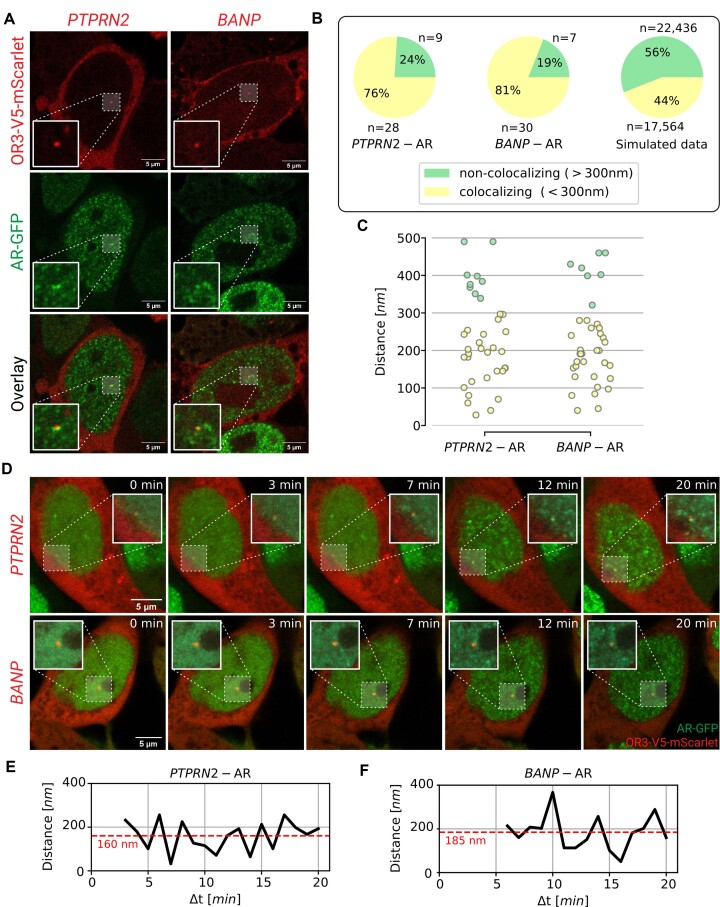
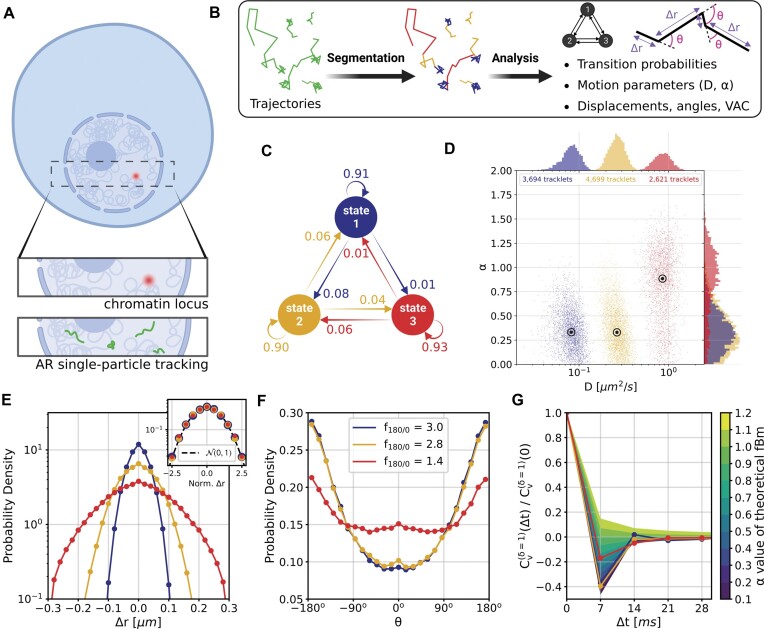
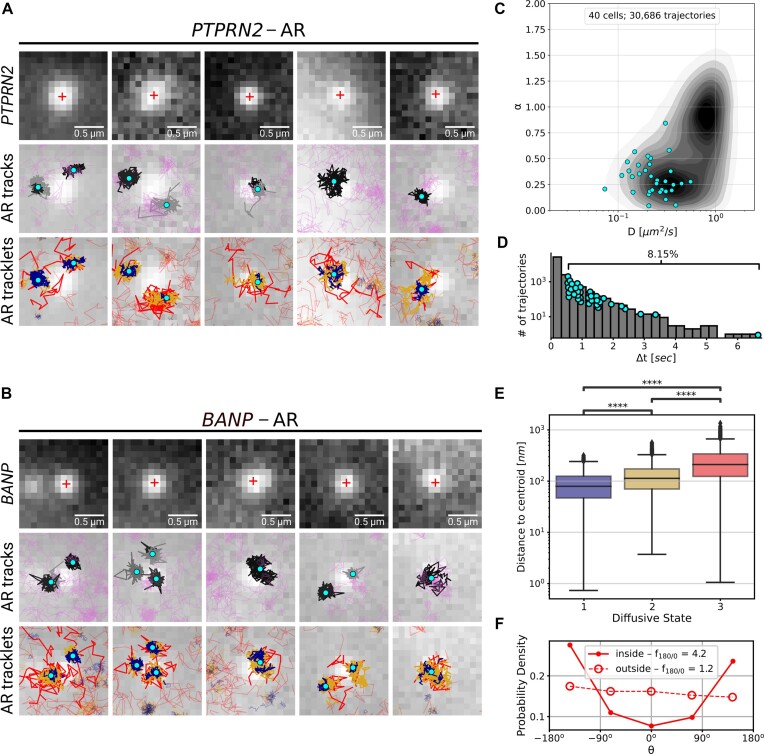
A wide range of nuclear proteins are involved in the spatio-temporal organization of the genome through diverse biological processes such as gene transcription and DNA replication. Upon stimulation by testosterone and translocation to the nucleus, multiple androgen receptors (ARs) accumulate in microscopically discernable foci which are irregularly distributed in the nucleus. Here, we investigated the formation and physical nature of these foci, by combining novel fluorescent labeling techniques to visualize a defined chromatin locus of AR-regulated genes-PTPRN2 or BANP-simultaneously with either AR foci or individual AR molecules. Quantitative colocalization analysis showed evidence of AR foci formation induced by R1881 at both PTPRN2 and BANP loci. Furthermore, single-particle tracking (SPT) revealed three distinct subdiffusive fractional Brownian motion (fBm) states: immobilized ARs were observed near the labeled genes likely as a consequence of DNA-binding, while the intermediate confined state showed a similar spatial behavior but with larger displacements, suggesting compartmentalization by liquid-liquid phase separation (LLPS), while freely mobile ARs were diffusing in the nuclear environment. All together, we show for the first time in living cells the presence of AR-regulated genes in AR foci.


Figures

Graphical Abstract
Graphical Abstract
Figure 1.
Figure 1.
AR regulation of PTPRN2 and BANP gene bodies determined by NGS data. (A) AR ChIP-sequencing results of PC346C cells treated with DMSO or R1881 (top) and AR ChIP-sequencing results of four metastatic castration resistant prostate cancer samples (bottom). Numbering indicating the peaks with the highest intensity, used for a genomics search. (B-D-G-I) Normalized gene expression pre- and post-enzalutamide treatment for PTPRN2 (B), BANP (D), FBXO31 (G) and ZFPM1 (I). Statistical significance was determined using a two-sided Mann–Whitney–Wilcoxon test with Bonferroni correction (****P-value ≤ 10−4; *10−2 < P-value ≤ 0.05; ns: 0.05 < P-value ≤ 1). (F) Gene interaction map of the BANP locus including proximal genes at ±500 kb distance, based on H3K27Ac HiChIP. (C-E-H-J) real-time quantitative PCR analysis of PTPRN2 (C), BANP (E), FBXO31 (H) and ZFPM1 (J) for unstimulated (vehicle), R1881-stimulated (R1881) and enzalutamide-treated (ENZ.) cells.
Figure 2.
Figure 2.
Colocalization of AR foci and labeled gene loci (PTPRN2 or BANP) in fixed and living cells. (A) Images of R1881-stimulated PC346C cells; PTPRN2 and BANP genes were labeled with the ANCHOR3 system (red), AR foci were labeled with EGFP (green). (B) Pie charts showing percentage of AR foci colocalizing with PTPRN2 loci, BANP loci and in silico simulated loci. (C) Distances between the locus and the closest AR focus. (D) Confocal time-lapse images of PC346C cells. PTPRN2 and BANP genes were labeled with the ANCHOR3 system (red), AR foci were labeled with EGFP (green). The cells were pre-treated overnight with hydroxyflutamide. At formula image, R1881 was added to induce AR foci formation. (E, F) Measured distance over time between the closest AR focus and either PTPRN2 (E) or BANP (F). The red dashed lines represent the average distance.
Figure 3.
Figure 3.
AR foci are mostly located in euchromatin. (A) Confocal image of a cell nucleus labeled with AR-GFP to visualize AR foci (green), propidium iodide to segment the nucleolus regions (red), and Hoechst to visualize the chromatin areas (blue). Hoechst normalized intensities were categorized in five classes. (B) Spatial distribution of the detected AR foci at each chromatin intensity class. (C) Bottom: fraction of AR foci in each chromatin intensity class (83 cells). Error bars represent the standard deviation. Top: pie chart showing percentage of foci in low-density chromatin (0.0–0.2), euchromatin (0.2–0.8) and heterochromatin (0.8–1.0) areas, respectively.
Figure 4.
Figure 4.
Single particle tracking data reveals three subdiffusive states. (A) Design of the experiment combining a labeled chromatin locus with single-particle tracking (SPT) of androgen receptors (AR). (B) Analysis pipeline of SPT data: trajectory segmentation using deep learning followed by various geometric computations. (C–G) Results of the AR SPT data analysis per tracklet state combining trajectories from 40 cells. (C) Transition probability diagram of the three states. (D) Anomalous exponent formula image plotted against the diffusion constant formula image of the tracklets; black circles indicate barycenter of the joint formula image and formula image distributions for each state, estimated using the median. (E) Distributions of combined formula image and formula image displacements for the time interval formula image. Inset: Z-score normalization of the distributions, following a Gaussian formula image. (F) Angular distributions and fold anisotropy metric formula image. (G) Velocity Autocorrelation (VAC) functions compared with theoretical fBm curves for various formula image.
Figure 5.
Figure 5.
Behavior of AR trajectories at labeled chromatin loci characterized by a confinement and a spatial organization. (A, B) For each gene (PTPRN2 and BANP), overlays of the labeled locus with AR trajectories (in gray and pink) or tracklets (colored by tracklet state). The trajectories colored in gray are longer than 70 frames and have at least one third of their track points at 4.5 pixels or less from the center of the labeled spot (indicated by a red ‘+’). The points in cyan are the centroid of each gray trajectory (the centroids have been averaged if multiple trajectories spread in the same region). The tracklets in opaque have at least one point within 2 pixels from each trajectory centroid. (C–F) Statistical analysis based on 10 loci per gene. (C) Kernel density plot of the joint formula image and formula image distributions using entire AR trajectories. Estimations were done using the formula image. Points in cyan represent the formula image estimations on the gray trajectories (subfigures A and B). (D) Distribution of trajectory length (translated in time) of AR trajectories. Points in cyan are the length of the gray trajectories. (E) Distance of each tracklet point to the trajectory centroid. Statistical significance was determined using a Mann–Whitney–Wilcoxon test two-sided with Bonferroni correction (****P-value ≤ 10−4). (F) Angular distributions and fold anisotropy metric formula image of tracklets in state 3. Tracklet points ‘inside’ are located within the 2-pixel radius threshold.
Figure 6.
Figure 6.
Similar diffusion pattern observed over the entire imaged nuclear region. (A–C) Overlay of the ANCHOR3 channel of a single cell with AR trajectory detections (A) or tracklet detections (B). The trajectories colored in gray are longer than 70 frames and having less than 20% of the track points labeled as state 3 (to discard the diffusive tracks); the detections in pink represent all the remaining tracks. The points in cyan are the centroid of each selected gray trajectory. The cropped (1–4) are zoomed-in regions of tracklets illustrated in (C). (D–I) Statistical analysis based on six cells. (D) Distribution of trajectory length (translated in time) of trajectories extracted. (E) Multi-distance spatial pattern analysis (Ripley's formula image-function) for different radii formula image using the SPT data (using centroid locations) and the AR-GFP expressed confocal images from 6 other cells (using the locations of the maximum pixel intensities). The curves were compared to a Poisson distribution as a CSR pattern. (F) Distance of each tracklet point (having at least one point at 2 pixels or less from the closest centroid) to the corresponding centroid. Statistical significance was determined using a Mann–Whitney–Wilcoxon test two-sided with Bonferroni correction (****P-value ≤ 10−4). (G) Fraction of tracklet points for each tracklet state located inside or outside the 2-pixel radius threshold. (H) Angular distributions and fold anisotropy metric formula image for each tracklet state inside or outside the radius threshold. (I) Distributions of combined formula image and formula image displacements for the time interval formula image for each tracklet state inside or outside the radius threshold.
Figure 7.
Figure 7.
Model of AR foci dynamics in a 3D-genome space.

Similar articles

Cited by

References

    1. van Royen M.E., van Cappellen W.A., de Vos C., Houtsmuller A.B., Trapman J.. Stepwise androgen receptor dimerization. J. Cell Sci. 2012; 125:1970–1979. - PubMed
    1. Nash C., Boufaied N., Badescu D., Wang Y.C., Paliouras M., Trifiro M., Ragoussis I., Thomson A.A.. Genome-wide analysis of androgen receptor binding and transcriptomic analysis in mesenchymal subsets during prostate development. Dis. Model Mech. 2019; 12:dmm039297. - PMC - PubMed
    1. Coulon A., Chow C.C., Singer R.H., Larson D.R.. Eukaryotic transcriptional dynamics: from single molecules to cell populations. Nat. Rev. Genet. 2013; 14:572–584. - PMC - PubMed
    1. Hyman A.A., Weber C.A., Jülicher F.. Liquid-liquid phase separation in biology. Annu. Rev. Cell Dev. Biol. 2014; 30:39–58. - PubMed
    1. Erdel F., Rippe K.. Formation of chromatin subcompartments by phase separation. Biophys. J. 2018; 114:2262–2270. - PMC - PubMed

Publication types