

cIAPs control RIPK1 kinase activity-dependent and -independent cell death and tissue inflammation
- PMID: 37789765
- PMCID: PMC10646551
- DOI: 10.15252/embj.2023113614
cIAPs control RIPK1 kinase activity-dependent and -independent cell death and tissue inflammation
Abstract
Cellular inhibitor of apoptosis proteins (cIAPs) are RING-containing E3 ubiquitin ligases that ubiquitylate receptor-interacting protein kinase 1 (RIPK1) to regulate TNF signalling. Here, we established mice simultaneously expressing enzymatically inactive cIAP1/2 variants, bearing mutations in the RING domains of cIAP1/2 (cIAP1/2 mutant RING, cIAP1/2MutR ). cIap1/2MutR/MutR mice died during embryonic development due to RIPK1-mediated apoptosis. While expression of kinase-inactive RIPK1D138N rescued embryonic development, Ripk1D138N/D138N /cIap1/2MutR/MutR mice developed systemic inflammation and died postweaning. Cells expressing cIAP1/2MutR and RIPK1D138N were still susceptible to TNF-induced apoptosis and necroptosis, implying additional kinase-independent RIPK1 activities in regulating TNF signalling. Although further ablation of Ripk3 did not lead to any phenotypic improvement, Tnfr1 gene knock-out prevented early onset of systemic inflammation and premature mortality, indicating that cIAPs control TNFR1-mediated toxicity independent of RIPK1 and RIPK3. Beyond providing novel molecular insights into TNF-signalling, the mouse model established in this study can serve as a useful tool to further evaluate ongoing therapeutic protocols using inhibitors of TNF, cIAPs and RIPK1.
Keywords: RIPK1; TNF; cIAP1; cIAP2; ubiquitin.
© 2023 The Authors. Published under the terms of the CC BY NC ND 4.0 license.
Conflict of interest statement
The authors declare that they have no conflict of interest.
Figures
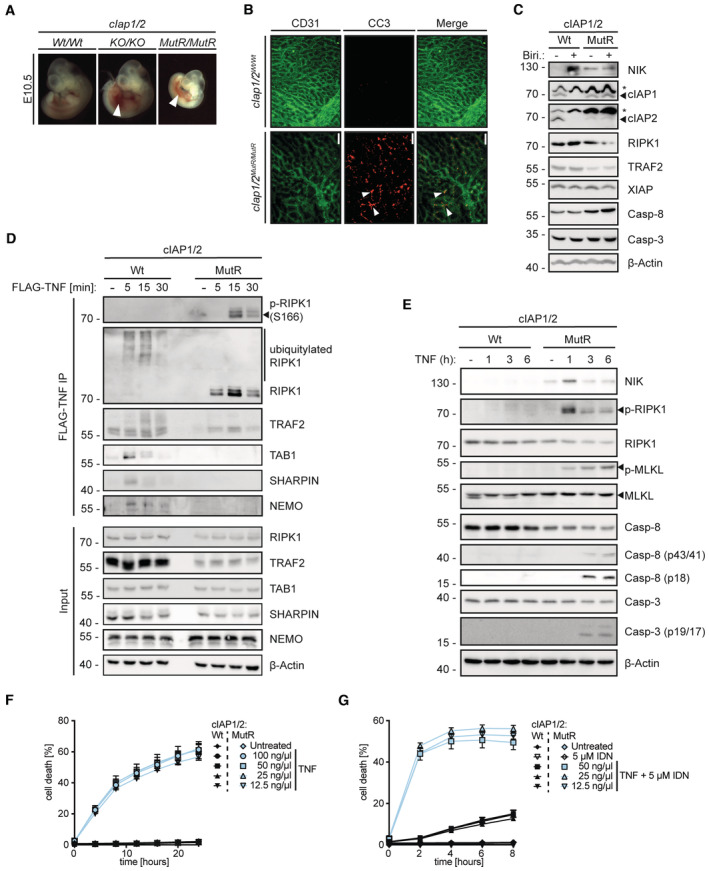
- A
Representative images of cIAP1/2 Wt/Wt (n = 5), cIAP1/2 KO/KO (n = 6), and cIAP1/2 MutR/MutR (n = 6) embryos isolated at E10.5. Arrowheads indicate haemorrhages.
- B
Whole‐mount yolk sacs isolated at E10.5 from cIAP1/2 Wt/Wt (n = 4), and cIAP1/2 MutR/MutR (n = 3) embryos, stained for CD31 (green) and cleaved caspase‐3 (CC3) (red). White arrowheads indicate apoptotic endothelial cells. Scale bar: 100 μm.
- C
Western blotting (WB) of cIAP1/2Wt and cIAP1/2MutR MEFs. Cells were pretreated for 3 h with either DMSO or 20 μM birinapant (Biri.). Cell lysates were analysed for the expression of the indicated proteins (* indicates unspecific bands).
- D
MEFs were treated with FLAG‐TNF (1 μg/ml) for the indicated times. TNFR1 protein complex was purified and analysed by WB.
- E
MEFs were treated with TNF (100 ng/ml) for the indicated times. Cell lysates were analysed by WB.
- F
IncuCyte analysis to determine % cell death in MEFs after treatment with increasing concentrations of TNF at indicated time points.
- G
IncuCyte analysis to determine % cell death in MEFs after co‐treatment with 5 μM IDN‐6556 (IDN) and increasing concentrations of TNF at indicated time points.
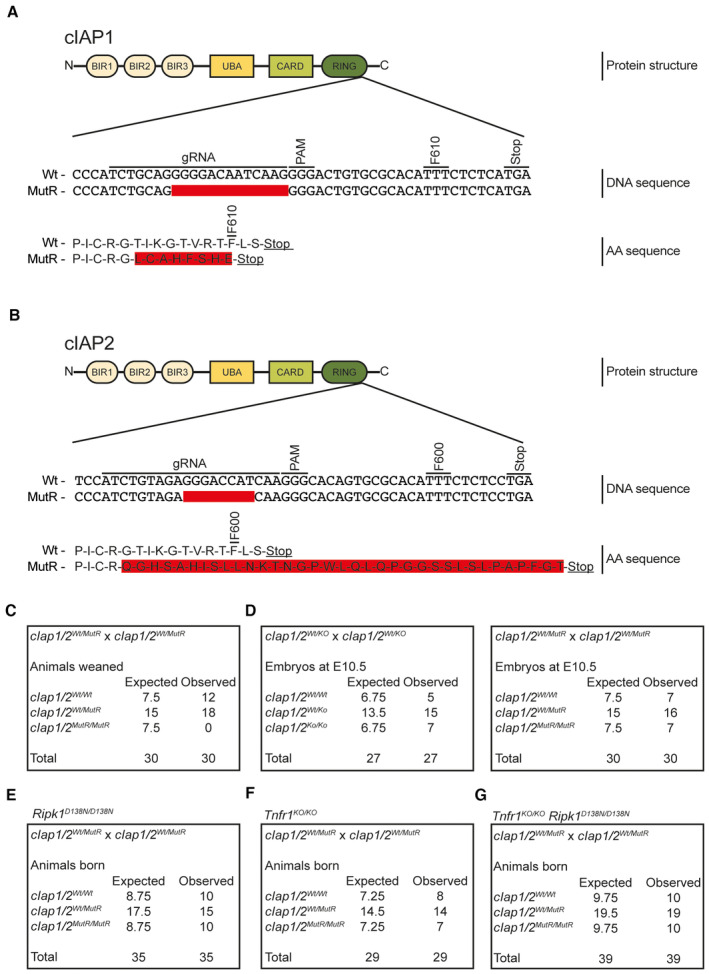
- A
Schematic depiction of the cIAP1 protein structure. Upper DNA sequence displays the binding site of the sgRNA targeting the cIap1 locus and its location upstream of the phenylalanine (F) at position 610. Lower DNA sequence shows the 13 bp deletion (red area) introduced by the CRISPR/Cas9 system. The respective amino acid sequence presents a comparison between the wild‐type (Wt) (upper sequence) and the mutated sequence (lower sequence, red area).
- B
Schematic illustration of the cIAP2 protein structure. Upper DNA sequence displays the binding site of the sgRNA targeting the cIap2 locus and its location upstream of the phenylalanine (F) at position 600. Lower DNA sequence shows the 8 bp deletion (red area) introduced by the CRISPR/Cas9 system. The respective amino acid sequence presents a comparison between the Wt (upper sequence) and prolonged sequence of the mutant protein (lower sequence, red area).
- C
Expected and observed animal numbers at weaning age per genotype derived from the indicated crosses (expected numbers are based on Mendelian ratios).
- D
Expected and observed embryo numbers at E10.5 per genotype derived from the indicated crosses (expected numbers are based on Mendelian ratios).
- E–G
Expected and observed animal numbers at weaning age per genotype derived from the indicated crosses (expected numbers are based on Mendelian ratios).
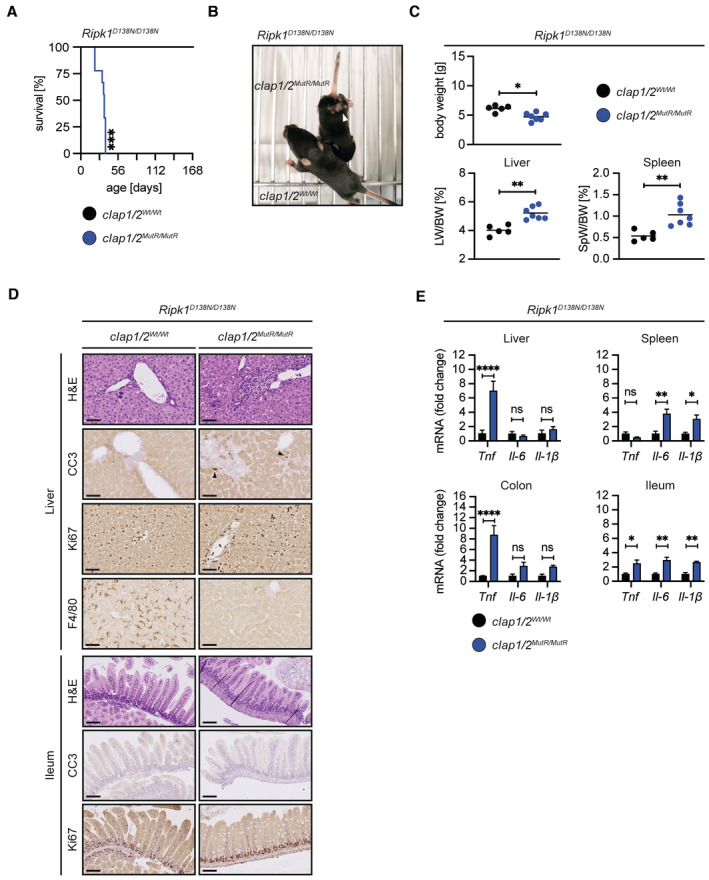
- A
Kaplan–Meier survival curves of Ripk1 D138N/D138N /cIap1/2 Wt/Wt (n = 7) and Ripk1 D138N/D138N /cIap1 MutR/MutR /cIap2 MutR/MutR (n = 9) mice. P‐values were calculated with a log‐rank (Mantel–Cox) test.
- B
Representative pictures of Ripk1 D138N/D138N /cIap1/2 Wt/Wt and Ripk1 D138N/D138N /cIap1 MutR/MutR /cIap2 MutR/MutR mice at 2 weeks of age (white arrowhead indicates skin inflammation).
- C
Body weight, liver weight/body weight ratios (LW/BW), spleen weight/body weight ratios (SpW/BW) from age‐matched mice of the indicated genotypes.
- D
Representative images of liver (upper panel) and ileum (lower panel) sections from mice at 2 weeks of age. Black arrowheads indicate apoptotic cells. Scale bars: 50 μm. Sections were stained with haematoxylin and eosin (H&E), cleaved caspase‐3 (CC3), Ki67, or F4/80.
- E
Relative mRNA expression of the indicated genes from liver, spleen, colon, and ileum derived from Ripk1 D138N/D138N /cIap1/2 Wt/Wt (n = 3) and Ripk1 D138N/D138N /cIap1 MutR/MutR /cIap2 MutR/MutR (n = 4) mice at 2 weeks of age measured by qPCR.
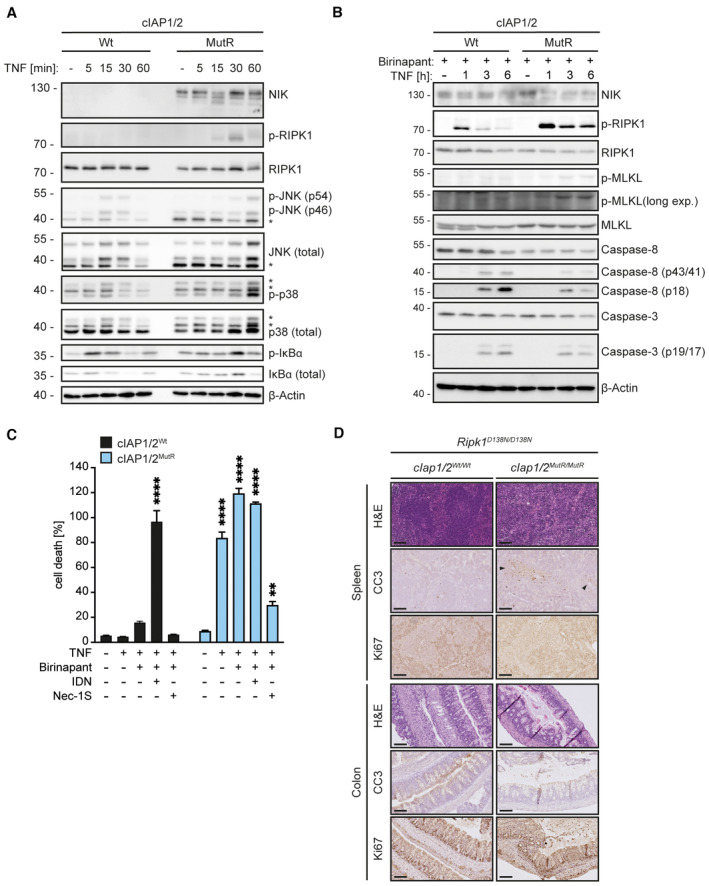
MEFs were treated with TNF for the indicated times. Cell lysates were analysed by WB (*indicates non‐specific bands). WB of cIAP1Wt/Wt MEFs treated with TNF for the indicated time points.
Cells were pre‐treated with 20 μM birinapant 3 h prior to TNF stimulation as indicated. Cell lysates were analysed by WB.
IncuCyte analysis to determine % cell death in MEFs after 6‐h treatment as indicated. Bars represent mean ± SEM. P‐values were calculated using one‐way ANOVA followed by Bonferroni post analysis. **P < 0.01 and ****P < 0.0001. MEFs were treated with combinations of TNF (100 ng/ml), IDN (5 μM), Nec‐1S (20 μM) and birinapant (20 μM) for 6 h; n = 3; technical replicate shown.
Representative images of spleen and colon sections from mice at 2 weeks of age. Black arrowheads indicate areas of apoptotic cells. Scale bars: 100 μm. Sections were stained with haematoxylin and eosin (H&E), cleaved caspase‐3 (CC3), or Ki67.
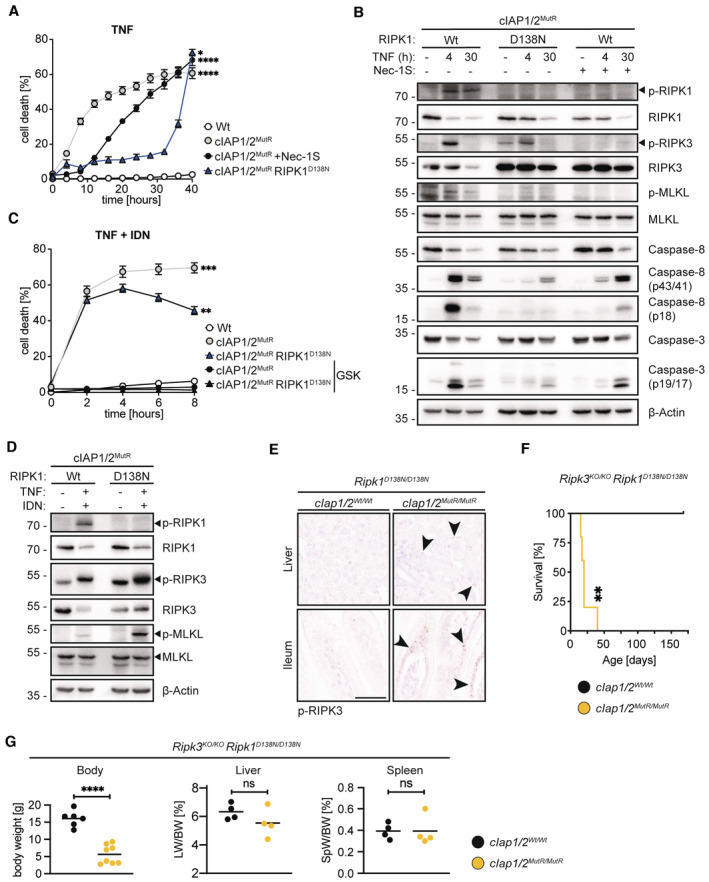
IncuCyte analysis to determine % cell death in MEFs treated with TNF (100 ng/ml) and TNF + Nec‐1S (20 μM) at indicated time points.
MEFs were treated with TNF (100 ng/ml) and Nec‐1S (20 μM) for the indicated times. Cell lysates were analysed by WB.
IncuCyte analysis to determine % cell death of MEFs treated with TNF (100 ng/ml) and IDN‐6556 (IDN) (5 μM) and TNF, IDN and GSK‐872 (GSK) (5 μM), at indicated time points.
MEFs were treated with TNF/IDN for 4 h. Cell lysates were analysed by WB.
Representative images of liver and ileum sections from mice at 2 weeks of age. Black arrowheads indicate cells expressing phosphorylated RIPK3. Scale bars: 50 μm.
Kaplan–Meier survival curves of Ripk3 KO/KO /Ripk1 D138N/D138N /cIAP1/2 Wt/Wt (n = 4) and Ripk3 KO/KO /Ripk1 D138N/D138N /cIap1 MutR/MutR /cIap2 MutR/MutR (n = 5) mice. P‐values were calculated with a log‐rank (Mantel–Cox) test.
Body weight, liver weight/body weight ratios (LW/BW), spleen weight/body weight ratios (SpW/BW) from age‐matched mice of the indicated genotypes.
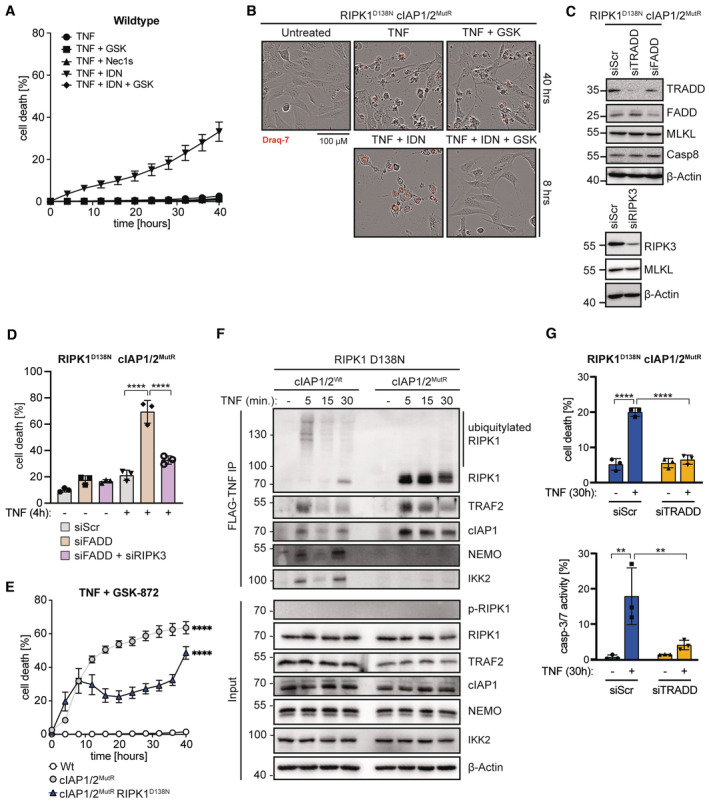
IncuCyte analysis to determine % cell death in Wt MEFs treated with TNF (100 ng/ml), TNF + GSK (5 μM), TNF + Nec‐1S (20 μM), TNF + IDN (5 μM), or TNF + GSK + IDN at indicated time points.
Representative IncuCyte images of dying MEFs (DRAQ‐7‐positive red cells) in Figs 3A and C, and EV3E after treatment with TNF, TNF + GSK, TNF + IDN, or TNF + IDN + GSK after indicated time points.
Cell lysates from MEFs transfected with the respective siRNA for 24 h were analysed by WB.
IncuCyte analysis to determine % cell death in cIAP1/2MutR/RIPK1D138N MEFs transfected with the respective siRNA and treated with TNF (100 ng/ml) for 30 h.
IncuCyte analysis to determine % cell death in MEFs treated with TNF (100 ng/ml) and GSK (5 μM) at indicated time points.
MEFs were treated with FLAG‐TNF (1 μg/ml) for the indicated times. TNFR1 protein complex was purified and analysed by WB.
IncuCyte analysis to determine % cell death in cIAP1/2MutR/RIPK1D138N MEFs transfected with the respective siRNA and treated with TNF (100 ng/ml) for 30 h. Caspase‐3/7 (Casp‐3/7) activity was measured by IncuCyte analysis. Fluorescence signal of CellEvent Casp‐3/7‐positive cells was quantified and normalised to cell number.
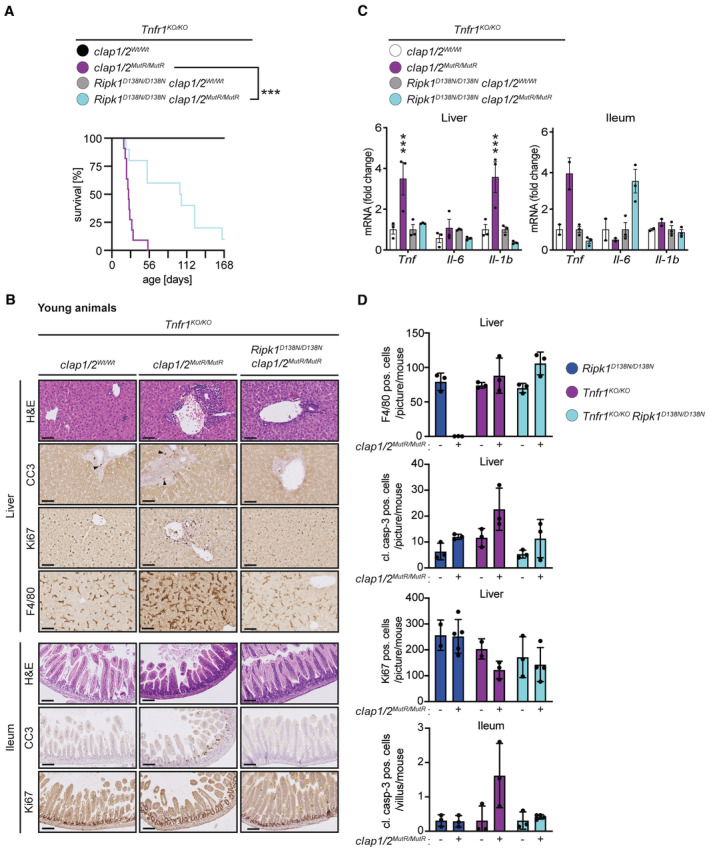
Kaplan–Meier survival curves of Tnfr1 KO/KO /cIAP1/2 Wt/Wt (n = 7), Tnfr1 KO/KO /cIap1/2 MutR/MutR (n = 11), Tnfr1 KO/KO /Ripk1 D138N/D138N /cIAP1/2 Wt/Wt (n = 10) and Tnfr1 KO/KO /Ripk1 D138N/D138N /cIap1/2 MutR/MutR (n = 10) mice. P‐values were calculated with a log‐rank (Mantel‐Cox) test.
Representative images of liver and ileum sections from mice at 2 weeks of age. Scale bars: 50 μm. Sections were stained with Hematoxylin and Eosin (H&E), cleaved caspase‐3 (CC3), Ki67, or F4/80. Arrowheads indicate CC3‐positive staining.
Relative mRNA expression of the indicated genes from liver and ileum measured by qPCR. For ileal tissue samples 2 mice per genotype from Tnfr1 KO/KO /cIAP1/2 Wt/Wt and Tnfr1 KO/KO /cIap1/2 MutR/MutR and 3 mice per genotype from Tnfr1 KO/KO /Ripk1 D138N/D138N /cIAP1/2 Wt/Wt and Tnfr1 KO/KO /Ripk1 D138N/D138N /cIap1/2 MutR/MutR were measured.
Quantification of cells positive for cleaved caspase‐3 (CC3), Ki67, or F4/80 staining in liver and ileum sections of mice.
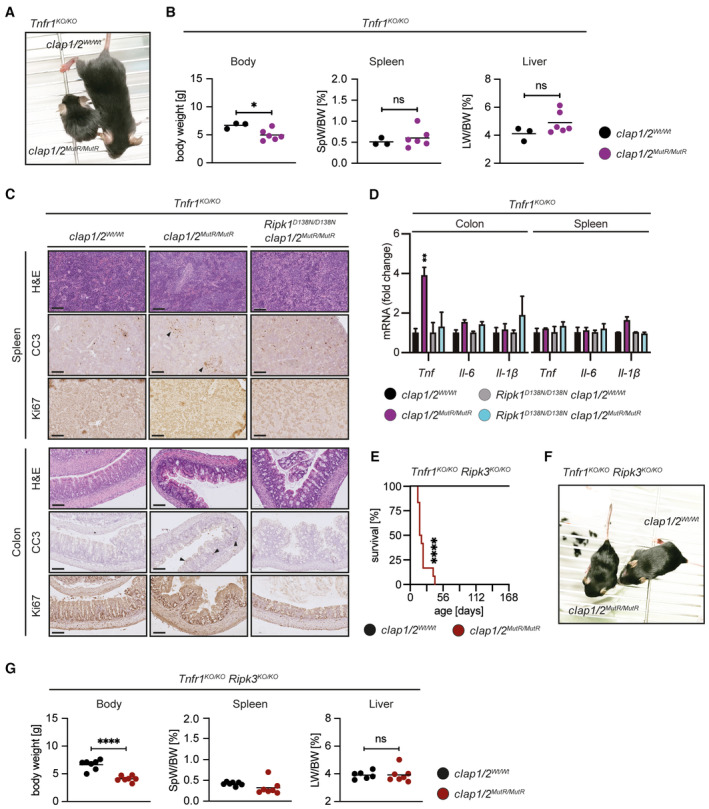
Representative pictures of Tnfr1 KO/KO /cIAP1/2 Wt/Wt and Tnfr1 KO/KO /cIap1/2 MutR/MutR mice at 2 weeks of age.
Body weight, liver weight/body weight ratios (LW/BW), spleen weight/body weight ratios (SpW/BW) from age‐matched mice of the indicated genotypes.
Representative images of spleen and colon sections from mice at 2 weeks of age. Scale bars: 50 μm. Sections were stained with Hematoxylin and Eosin (H&E), cleaved caspase‐3 (CC3), or Ki67. Black arrowheads indicate areas of apoptotic cells.
Relative mRNA expression of the indicated genes from colon and spleen measured by qPCR.
Kaplan–Meier survival curves of Tnfr1 KO/KO /Ripk3 KO/KO /cIAP1/2 Wt/Wt (n = 8) and Tnfr1 KO/KO /Ripk3 KO/KO /cIap1/2 MutR/MutR (n = 12) mice. P‐values were calculated with a log‐rank (Mantel‐Cox) test.
Representative pictures of Tnfr1 KO/KO /Ripk3 KO/KO /cIAP1/2 Wt/Wt and Tnfr1 KO/KO /Ripk3 KO/KO /cIap1/2 MutR/MutR mice at 2 weeks of age.
Body weight, liver weight/body weight ratios (LW/BW), spleen weight/body weight ratios (SpW/BW) from age‐matched mice of the indicated genotypes.
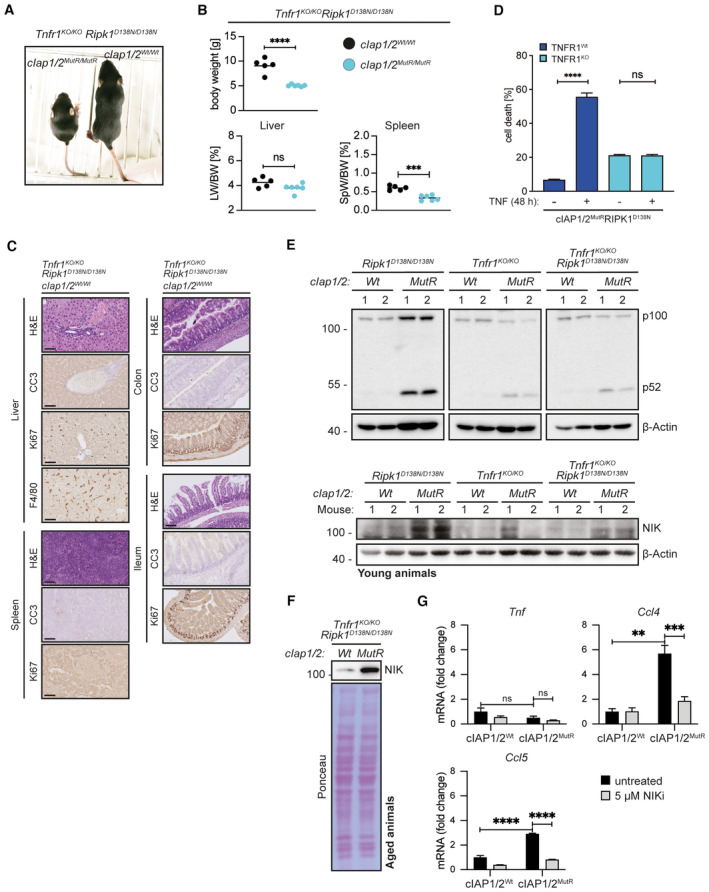
Representative pictures of Tnfr1 KO/KO /Ripk1 D138N/D138N /cIAP1/2 Wt/Wt and Tnfr1 KO/KO /Ripk1 D138N/D138N /cIap1/2 MutR/MutR mice at 2 weeks of age.
Body weight, liver weight/body weight ratios (LW/BW), spleen weight/body weight ratios (SpW/BW) from age‐matched mice of the indicated genotypes.
Representative images of liver, spleen, colon and ileum sections from Tnfr1 KO/KO /Ripk1 D138N/D138N /cIAP1/2 Wt/Wt mice at 2 weeks of age. Scale bars: 50 μm. Sections were stained with Hematoxylin and Eosin (H&E), cleaved caspase‐3 (CC3), Ki67, or F4/80.
IncuCyte analysis to determine cell death in MEFs after 48 h of TNF treatment (100 ng/ml).
WB of liver lysates from young mice with the indicated genotypes (2 mice per genotype).
WB of liver lysates from aged mice with the indicated genotypes (1 mouse per genotype).
Gene expression analysis of MEFs treated with NIK inhibitor (5 μM) for 24 h, relative mRNA expression of indicated genes was measured by qPCR.
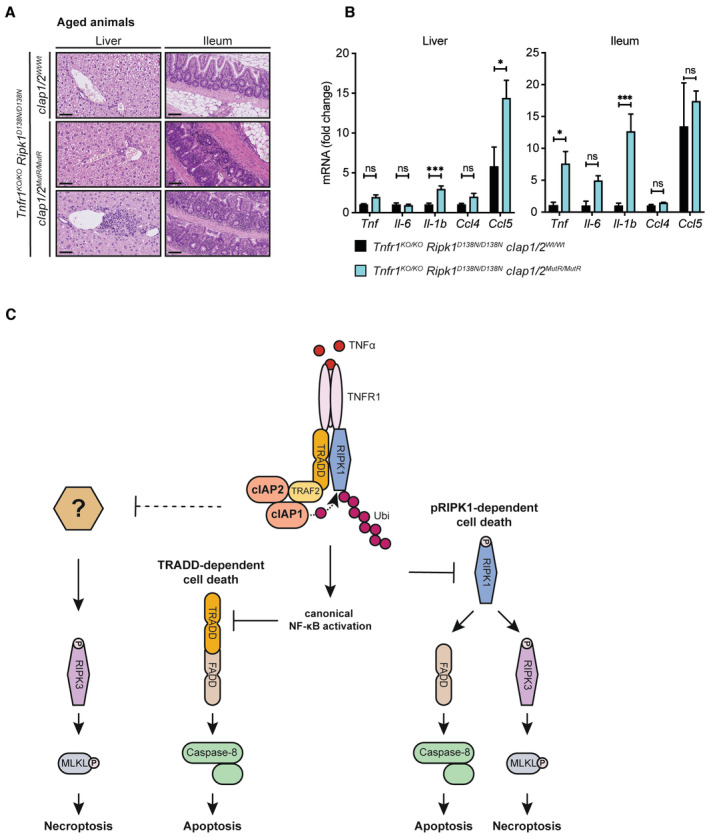
Representative images of liver and ileum sections from mice with the indicated genotypes at 24 weeks of age. Scale bars: 50 μm (liver) and 100 μm (ileum).
Relative mRNA expression of the indicated genes from liver and ileum isolated from mice measured by qPCR. Bars represent mean of three mice per genotype ± SEM. P‐values were calculated using two‐way ANOVA followed by Bonferroni postanalysis. *P < 0.05; ***P < 0.001 and ns, not significant.
Schematic illustration of cIAP‐mediated control of TNFR1‐induced cell death. The ubiquitin ligase activity of cIAP1/2 controls TNF‐induced RIPK1‐mediated apoptosis/necroptosis and provides the molecular platform for the activation of NFκB in response to TNF. Activation of NFκB survival signalling inhibits TNF‐induced TRADD‐mediated apoptosis. cIAP‐mediated ubiquitylation further controls TNF‐induced RIPK3‐dependent and RIPK1‐independent necroptosis. The underlying molecular mechanism remains undetermined.
Similar articles
-
RIPK3 contributes to TNFR1-mediated RIPK1 kinase-dependent apoptosis in conditions of cIAP1/2 depletion or TAK1 kinase inhibition.Cell Death Differ. 2013 Oct;20(10):1381-92. doi: 10.1038/cdd.2013.94. Epub 2013 Jul 26. Cell Death Differ. 2013. PMID: 23892367 Free PMC article.
-
Cutting edge: RIPK1 Kinase inactive mice are viable and protected from TNF-induced necroptosis in vivo.J Immunol. 2014 Aug 15;193(4):1539-1543. doi: 10.4049/jimmunol.1400590. Epub 2014 Jul 11. J Immunol. 2014. PMID: 25015821 Free PMC article.
-
IAPs limit activation of RIP kinases by TNF receptor 1 during development.EMBO J. 2012 Apr 4;31(7):1679-91. doi: 10.1038/emboj.2012.18. Epub 2012 Feb 10. EMBO J. 2012. PMID: 22327219 Free PMC article.
-
Holding RIPK1 on the Ubiquitin Leash in TNFR1 Signaling.Trends Cell Biol. 2016 Jun;26(6):445-461. doi: 10.1016/j.tcb.2016.01.006. Epub 2016 Feb 11. Trends Cell Biol. 2016. PMID: 26877205 Review.
-
Fn14 and TNFR2 as regulators of cytotoxic TNFR1 signaling.Front Cell Dev Biol. 2023 Nov 6;11:1267837. doi: 10.3389/fcell.2023.1267837. eCollection 2023. Front Cell Dev Biol. 2023. PMID: 38020877 Free PMC article. Review.
Cited by
-
Deubiquitinase USP5 regulates RIPK1 driven pyroptosis in response to myocardial ischemic reperfusion injury.Cell Commun Signal. 2024 Sep 30;22(1):466. doi: 10.1186/s12964-024-01853-x. Cell Commun Signal. 2024. PMID: 39350285 Free PMC article.
-
Research Progress on Micro(nano)plastic-Induced Programmed Cell Death Associated with Disease Risks.Toxics. 2024 Jul 5;12(7):493. doi: 10.3390/toxics12070493. Toxics. 2024. PMID: 39058145 Free PMC article. Review.
-
Targeting necroptosis: a promising avenue for respiratory disease treatment.Cell Commun Signal. 2024 Aug 28;22(1):418. doi: 10.1186/s12964-024-01804-6. Cell Commun Signal. 2024. PMID: 39192326 Free PMC article. Review.
References
-
- Bertrand MJ, Milutinovic S, Dickson KM, Ho WC, Boudreault A, Durkin J, Gillard JW, Jaquith JB, Morris SJ, Barker PA (2008) cIAP1 and cIAP2 facilitate cancer cell survival by functioning as E3 ligases that promote RIP1 ubiquitination. Mol Cell 30: 689–700 - PubMed
MeSH terms
Substances
Grants and funding
LinkOut - more resources
Full Text Sources
Molecular Biology Databases
Miscellaneous
