. 2023 Oct 2;14(1):6145.
doi: 10.1038/s41467-023-41521-1.

Estimating the contribution of CD4 T cell subset proliferation and differentiation to HIV persistence

Affiliations

Estimating the contribution of CD4 T cell subset proliferation and differentiation to HIV persistence

Daniel B Reeves et al. Nat Commun. .

Abstract

Persistence of HIV in people living with HIV (PWH) on suppressive antiretroviral therapy (ART) has been linked to physiological mechanisms of CD4+ T cells. Here, in the same 37 male PWH on ART we measure longitudinal kinetics of HIV DNA and cell turnover rates in five CD4 cell subsets: naïve (TN), stem-cell- (TSCM), central- (TCM), transitional- (TTM), and effector-memory (TEM). HIV decreases in TTM and TEM but not in less-differentiated subsets. Cell turnover is ~10 times faster than HIV clearance in memory subsets, implying that cellular proliferation consistently creates HIV DNA. The optimal mathematical model for these integrated data sets posits HIV DNA also passages between CD4 cell subsets via cellular differentiation. Estimates are heterogeneous, but in an average participant's year ~10 (in TN and TSCM) and ~104 (in TCM, TTM, TEM) proviruses are generated by proliferation while ~103 proviruses passage via cell differentiation (per million CD4). In simulations, therapies blocking proliferation and/or enhancing differentiation could reduce HIV DNA by 1-2 logs over 3 years. In summary, HIV exploits cellular proliferation and differentiation to persist during ART but clears faster in more proliferative/differentiated CD4 cell subsets and the same physiological mechanisms sustaining HIV might be temporarily modified to reduce it.


Conflict of interest statement

The authors declare no competing interests.

Figures

Fig. 1
Fig. 1. Definitions and representation of study data.
From 37 PWH in the HOPE cohort, samples were taken at 1–3 time points over a 3-year period. Resting CD4+ T cells were sorted into five phenotypic subsets including naïve (TN), stem-cell memory (TSCM), central memory (TCM), transitional memory (TTM), and effector memory cells (TEM). Three measurements were observed or calculated (panel headings): (A) subset frequency—the proportion of cells in each subset relative to total resting CD4 cells (“other” represents resting cells not among the five sorted subsets), (B) subset infection frequency—integrated HIV DNA in each subset per million subset cells, and (C) subset HIV DNA—the number of HIV DNA copies in a given subset per million CD4 cells. Colored dots indicate values from all participant  time points and black diamonds represent means across all dots.
Fig. 2
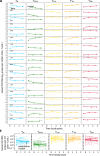
Fig. 2. The kinetics of subset HIV frequency vary by subset and are generally slower than cellular turnover.
A Longitudinal kinetics of HIV subset infection frequency in each cell subset: thin lines and dots are individual trajectories and thick solid lines represent the estimated average slopes from a log-linear mixed effects model. B Box plots of participants’ decay rates—note that some are positive, meaning that HIV frequency increased. P-values indicate one-sided t-test against null hypothesis of no clearance. For scale, the decay rate equivalent to the QVOA reservoir benchmark 44 month half-life is denoted with the dashed gray line. C Cellular turnover rates derived from deuterated water labeling in 24 of these 37 individuals. P values indicated paired two-sided t-tests with non-equal variance. Magnitudes of cellular turnover rates (in non-TN subsets) are much higher than HIV decay rates—note difference in y-axis scales in (C) versus (B). D The % of cellular turnover that is accompanied by HIV turnover (Methods). Values close to 100% indicate that HIV is typically repopulated when cells turn over. In (BD) box plots indicate median (center line), interquartile range (box), 1.5x interquartile range (whiskers), and outliers (gray diamonds). Each dot (N = 24) represents an individual. E Cartoon example for TEM: in a year, there is frequent cellular turnover, which is infrequently (~5% of events) accompanied by elimination of HIV-infected cells, resulting in the observed slight decay of HIV DNA.
Fig. 3
Fig. 3. Modeling subset HIV DNA dynamics via physiological mechanisms of T cells including proliferation, differentiation, and death.
Model schematic (A) and definitions (B) of model rates for a single subset. Net effect rates Θ describes the total kinetic rate summing all modeled mechanisms governing HIV DNA so can be positive or negative for each subset. The turnover rate represents the positive contribution to cellular turnover, estimated via the labeling study. Our mathematical model estimates the repopulation (θ) and differentiation (φ) rates in and out of each subset. Therefore, we can calculate the proliferation (α) and death (δ) rates for each subset from turnover and differentiation. C The most parsimonious model of all combined subset HIV DNA levels included infected cell proliferation (dots flashing), death (dots falling and fading), and differentiation between certain subsets (dots moving). This image is a screenshot of the Supplementary Movie 1 which visualizes the system over time. The differentiation pattern that was most parsimonious included a general flow from least to most mature subsets, but also some “skip” patterns, i.e., TN-to-TCM and TCM-to-TEM. With no further measured subset past TEM, death and differentiation out could not be distinguished for TEM so we combined the two phenomena (see *).
Fig. 4
Fig. 4. Modeling including proliferation and differentiation recapitulates individual subset HIV DNA kinetics.
A Model fits (solid lines) of subset HIV DNA levels (dots/dashed lines) for all participants having 3 longitudinal measurements (N = 18). B Population model (solid lines) estimates of subset HIV DNA (copies per million CD4 T cells) to all longitudinal participant data (dots with thin lines).
Fig. 5
Fig. 5. Absolute and relative contribution to HIV reservoirs by cell proliferation, death, and differentiation.
AD Absolute contributions to HIV subset DNA by differentiation in, proliferation, differentiation out, and death of each subset. E Relative contribution of each mechanism to each subset. Positive (persistence) and negative (clearance) contributions are treated separately for % calculations. Differentiation out and death of TEM are grouped together because the lack of terminally differentiated cells in this analysis precluded identification of both rates. In AE, estimate for each individual (N = 24) are shown as colored dots and black diamonds indicate means across individuals. F The absolute contribution of each mechanism averaged across all individuals.
Fig. 6
Fig. 6. Simulations of modulated HIV persistence mechanisms.
Projections of subset HIV DNA levels in all resting CD4+ T cell subsets during three theoretical therapeutic interventions: A ART alone, (B) ART and anti-proliferative therapy: 2-fold reduction in cell proliferation in all subsets, and (C) ART and enhanced differentiation therapy: 2-fold increase in cell differentiation in and out of all subsets. Box plots indicate median (center line), interquartile range (box), 1.5x interquartile range (whiskers), and outliers (open circles). Each line (N = 24) represents a simulation using parameters from each individual.

Similar articles

Cited by

References

    1. Chun TW, et al. Presence of an inducible HIV-1 latent reservoir during highly active antiretroviral therapy. Proc. Natl Acad. Sci. USA. 1997;94:13193–13197. doi: 10.1073/pnas.94.24.13193. - DOI - PMC - PubMed
    1. Finzi D, et al. Identification of a reservoir for HIV-1 in patients on highly active antiretroviral therapy. Science. 1997;278:1295–1300. doi: 10.1126/science.278.5341.1295. - DOI - PubMed
    1. Murray AJ, Kwon KJ, Farber DL, Siliciano RF. The latent reservoir for HIV-1: how immunologic memory and clonal expansion contribute to HIV-1 persistence. J. Immunol. 2016;197:407–417. doi: 10.4049/jimmunol.1600343. - DOI - PMC - PubMed
    1. Cohn LB, Chomont N, Deeks SG. Review the biology of the HIV-1 latent reservoir and implications for cure strategies. Cell Host Microbe. 2020;27:519–530. doi: 10.1016/j.chom.2020.03.014. - DOI - PMC - PubMed
    1. Reeves, D. B. et al. A majority of HIV persistence during antiretroviral therapy is due to infected cell proliferation. Nat. Commun.9, 4811 (2018). - PMC - PubMed

Publication types