. 2023 Sep 30;23(1):223.
doi: 10.1186/s12935-023-03061-y.

Integrative evaluation and experimental validation of the immune-modulating potential of dysregulated extracellular matrix genes in high-grade serous ovarian cancer prognosis

Affiliations

Integrative evaluation and experimental validation of the immune-modulating potential of dysregulated extracellular matrix genes in high-grade serous ovarian cancer prognosis

Qihui Wu et al. Cancer Cell Int. .

Abstract

Background: High-grade serous ovarian cancer (HGSOC) is a challenging malignancy characterized by complex interactions between tumor cells and the surrounding microenvironment. Understanding the immune landscape of HGSOC, particularly the role of the extracellular matrix (ECM), is crucial for improving prognosis and guiding therapeutic interventions.

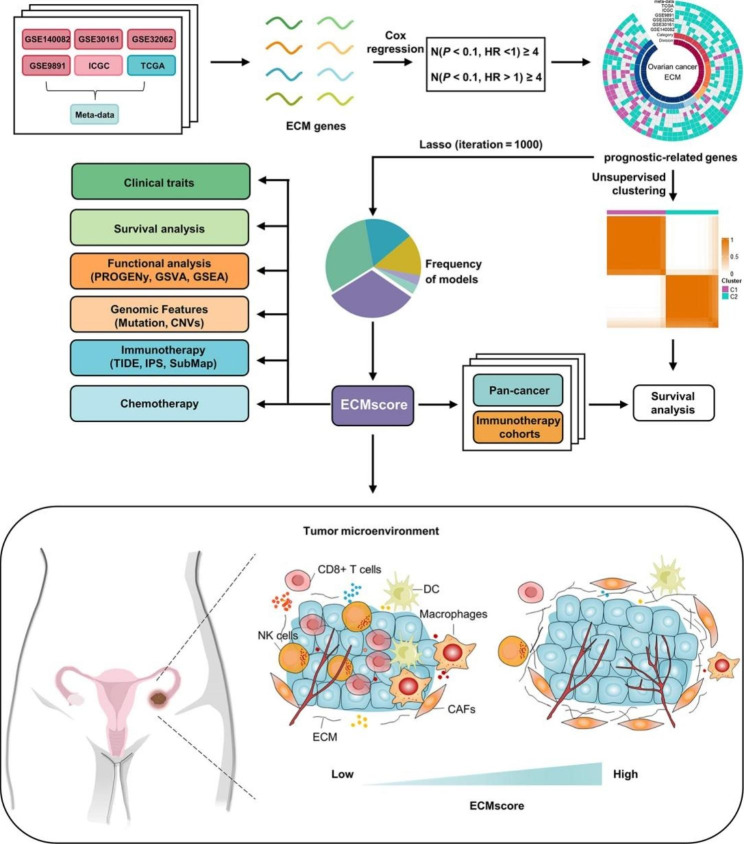
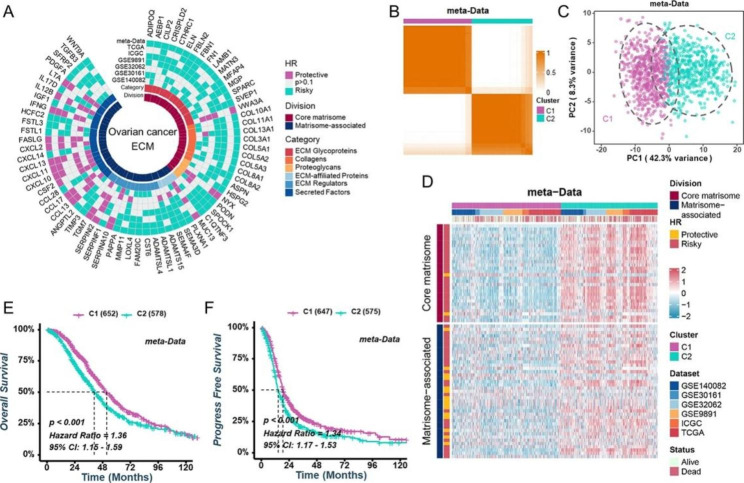
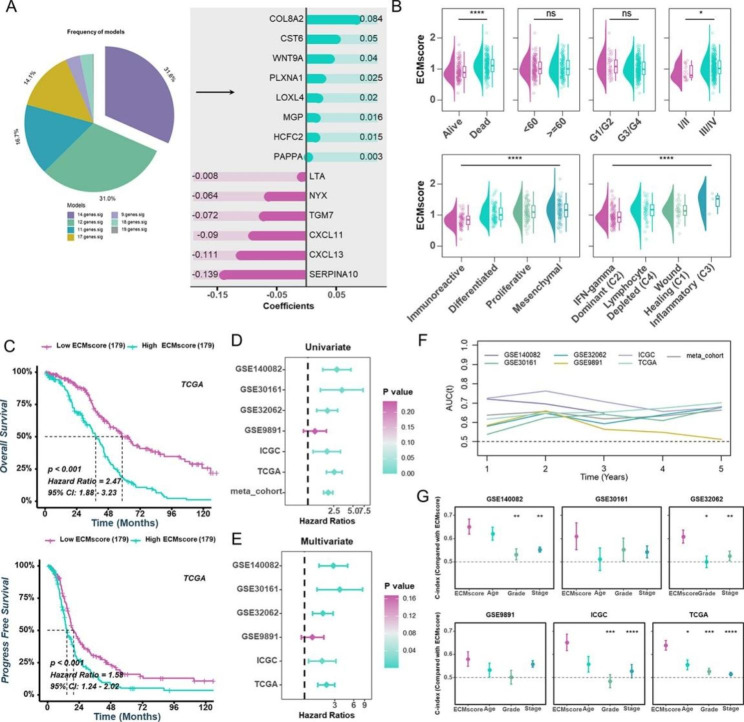
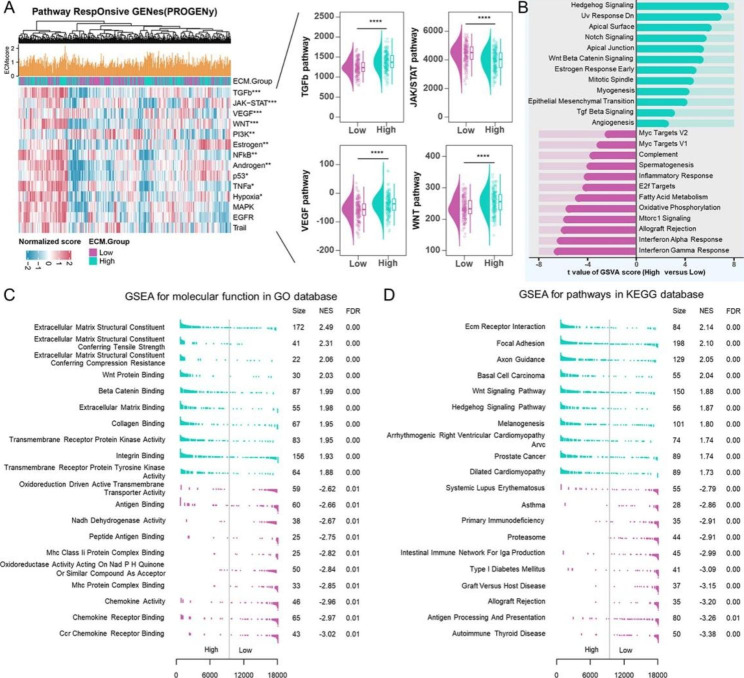
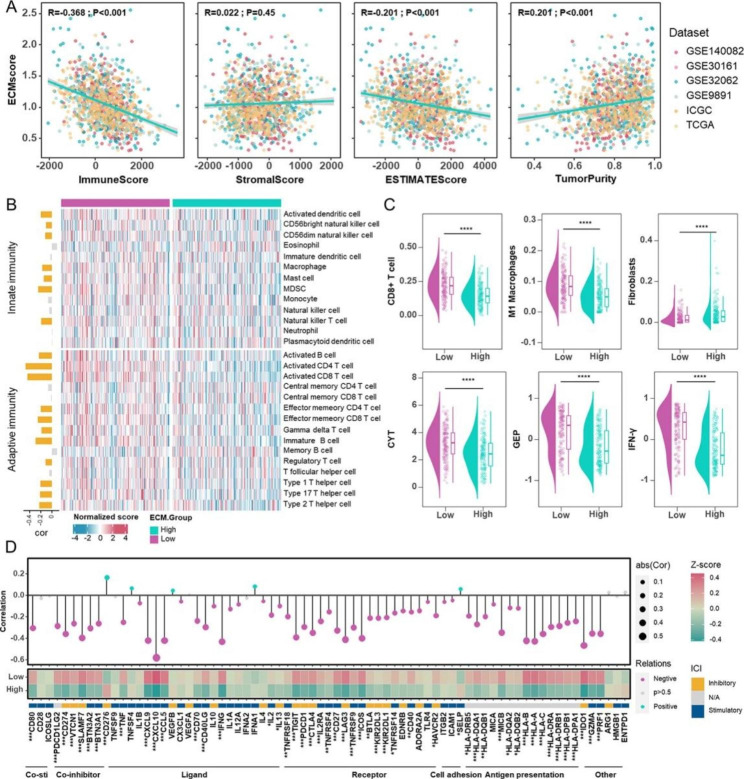
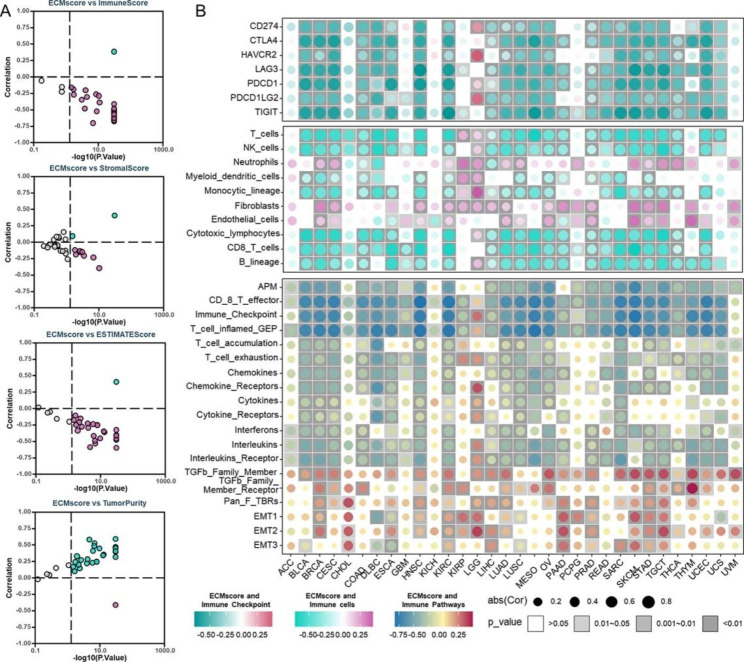
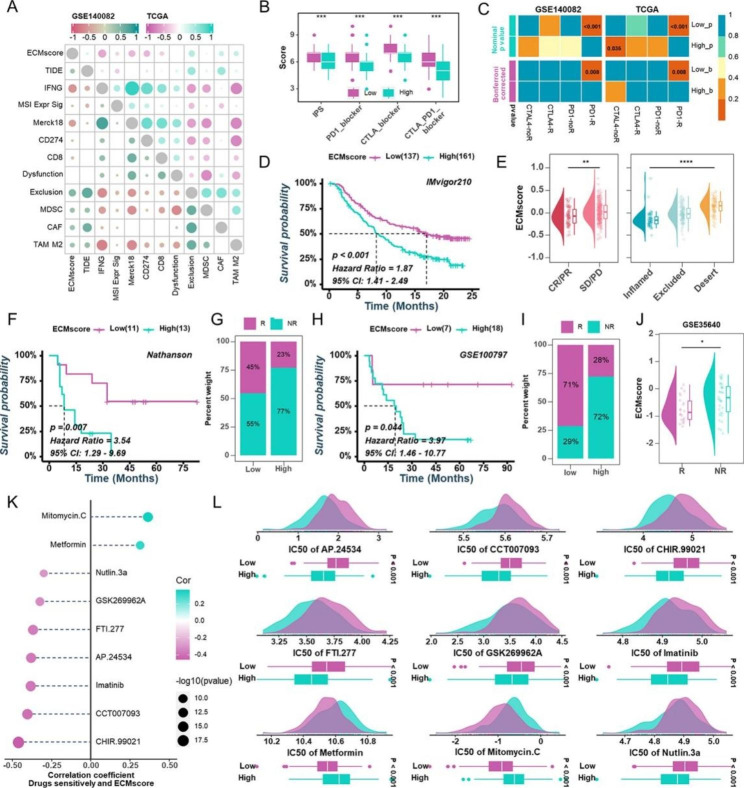
Methods and results: Using univariate Cox regression analysis, we identified 71 ECM genes associated with prognosis in seven HGSOC populations. The ECMscore signature, consisting of 14 genes, was validated using Cox proportional hazards regression with a lasso penalty. Cox regression analyses demonstrated that ECMscore is an excellent indicator for prognostic classification in prevalent malignancies, including HGSOC. Moreover, patients with higher ECMscores exhibited more active stromal and carcinogenic activation pathways, including apical surface signaling, Notch signaling, apical junctions, Wnt signaling, epithelial-mesenchymal transition, TGF-beta signaling, and angiogenesis. In contrast, patients with relatively low ECMscores showed more active immune-related pathways, such as interferon alpha response, interferon-gamma response, and inflammatory response. The relationship between the ECMscore and genomic anomalies was further examined. Additionally, the correlation between ECMscore and immune microenvironment components and signals in HGSOC was examined in greater detail. Moreover, the expression of MGP, COL8A2, and PAPPA and its correlation with FAP were validated using qRT-PCR on samples from HGSOC. The utility of ECMscore in predicting the prospective clinical success of immunotherapy and its potential in guiding the selection of chemotherapeutic agents were also explored. Similar results were obtained from pan-cancer research.

Conclusion: The comprehensive evaluation of the ECM may help identify immune activation and assist patients in HGSOC and even pan-cancer in receiving proper therapy.

Keywords: Extracellular matrix; Immunity; Ovarian carcinoma; Prognosis; Treatment.


Conflict of interest statement

The authors declare no competing interests.

Figures

Fig. 1
Fig. 1
Flow chart of this study. The study begins with the identification of significantly correlated extracellular matrix (ECM) genes. Consensus clustering is employed to classify prognostic-related ECM genes into distinct extracellular matrix patterns, followed by an analysis of the association between different ECM clusters and patient prognosis. Subsequently, a LASSO algorithm is applied to construct an ECMscore signature. The risk model is comprehensively evaluated using clinical characteristics, survival analysis, functional enrichment annotations, genomic features, and the potential for predicting immunotherapy and chemotherapy responses. Finally, the prognostic relevance of the model is further validated in pan-cancer analysis and immunotherapy assessment
Fig. 2
Fig. 2
Identification of two ECM clusters in HGSOC patients. (A) Univariate Cox regression analysis used to identify ECM genes associated with OS across various cohorts. (B) Cumulative distribution function of consensus clustering for k = 2 in the meta-data cohort. (C) Principal component analysis demonstrating the separation between cluster C1 and cluster C2 based on prognostic-related ECM genes. (D) Heatmap illustrating the expression profiles of prognostic-related ECM genes in the meta-data cohort. (E, F) Kaplan-Meier analysis depicting the OS (E) and PFS (F) differences between different ECM clusters in the meta-data cohort
Fig. 3
Fig. 3
Construction of a prognostic signature based on ECM genes. (A) Frequency distribution of prognostic signatures after 1000 iterations (left pie chart) and regression coefficients of each gene in the ECMscore signature determined by the LASSO algorithm (right bar chart). (B) Associations between ECMscore and clinical features including survival status, age, grade, stage, TCGA molecular subtypes, and immune subtypes. (C) Kaplan-Meier analysis illustrating the differences in OS (upper) and PFS (bottom) between low- and high-ECMscore groups in the TCGA-OV cohort. (D) Univariate Cox regression analysis of ECMscore across various cohorts, with dashed line representing HR = 1. (E) Multivariate Cox regression analysis showing the effect of ECMscore and clinicopathological characteristics on survival in different cohorts. The HR value of ECMscore was adjusted for age, grade, and stage in various cohorts, with dashed line indicating HR = 1. (F) Time-dependent area AUC values of ECMscore in different cohorts. (G) C-index comparison of ECMscore with clinicopathological characteristics in different cohorts
Fig. 4
Fig. 4
Underlying biological functions of different ECMscore groups. (A) Heatmaps (left) and box plot (right) illustrating the activity scores of signaling pathways in low- and high-ECMscore groups within the TCGA-OV cohort. (B) Bar graph showing the disparity in enrichment scores based on GSVA analysis between low- and high-ECMscore groups. (C, D) GSEA of biological processes from the GO database (C) and KEGG pathway gene sets (D). The top 10 positively and negatively associated pathways with ECMscore are presented
Fig. 5
Fig. 5
Genomic Features of different ECMscore groups. (A) Distribution and relationship between total mutation counts, synonymous mutation counts, non-synonymous mutation counts, and ECMscore, depicted through boxplots and scatterplots. The distributions of these features in low and high ECMscore groups are shown. (B) Comparison of CNV through genomic amplifications and deletions between low- and high-ECMscore groups. (C) Chromosomal locations of ECM genes exhibiting significant amplifications and deletions in broad regions of copy number alterations
Fig. 6
Fig. 6
Immune Landscape of different ECMscore groups. (A) Correlation analysis demonstrating the relationship between ECMscore and immune score, stromal score, ESTIMATE score, and tumor purity across six cohorts. (B) Heatmap illustrating normalized scores of immune cell populations in low- and high-ECMscore groups. Correlation plots (left) depict the associations between ECMscore and immune cell infiltrates. Yellow indicates positive or negative correlations, while grey represents no correlation. (C) Comparison of CD8 + T cells, M1 macrophages, fibroblasts, CYT, GEP, and IFN-γ levels between low- and high-ECMscore groups. (D) Bubble chart (upper) and Heatmap (lower) showcasing the correlation between immune modulators and ECMscore, along with their distributions in the low- and high-ECMscore groups
Fig. 7
Fig. 7
Pan-cancer analyses of ECMscore signature. (A) Correlation analysis demonstrating the relationships between ECMscore and immune score, stromal score, ESTIMATE score, and tumor purity in the pan-cancer cohort. Purple indicates negative correlation, while green indicates positive correlation. (B) Correlation analysis between ECMscore and immune checkpoints (upper), immune cell populations (middle), and TME signatures (lower)
Fig. 8
Fig. 8
Implications of ECMscore for immunotherapy and chemotherapy. (A) Correlation analysis between ECMscore and TIDE scores in GSE140082 and TCGA-OV cohorts. (B) Comparison of IPS between low- and high-ECMscore groups stratified by PD-1 and CTLA4 expression. (C) Relationship between ECMscore groups and immunotherapy responses using the TIDE algorithm. (D) Kaplan-Meier analysis estimating OS in different ECMscore groups in the IMvigor cohort. (E) Distribution of ECMscore in patients with distinct immunotherapy responses (left) and immunophenotypes (right) in the IMvigor cohort. (F) Kaplan-Meier analysis estimating OS in different ECMscore groups in Nathanson’s cohort. (G) Distribution of ECMscore in patients with varying immunotherapy responses in Nathanson’s cohort. (H) Kaplan-Meier analysis estimating OS in different ECMscore groups in the GSE100797 cohort. (I, J) Distribution of ECMscore in patients with diverse immunotherapy responses in the GSE100797(I) and GSE35640 cohort. (K) Correlation analysis between ECMscore and IC50 values of candidate drugs in TCGA-OV cohort. (L) Comparison of IC50 values of candidate drugs between low- and high-ECMscore groups in TCGA-OV cohort

Similar articles

Cited by

References

    1. Sung H, Ferlay J, Siegel RL, Laversanne M, Soerjomataram I, Jemal A, Bray F. Global Cancer Statistics 2020: GLOBOCAN estimates of incidence and Mortality Worldwide for 36 cancers in 185 countries. CA Cancer J Clin. 2021;71(3):209–49. - PubMed
    1. Siegel RL, Miller KD, Fuchs HE, Jemal A. Cancer statistics, 2022. CA Cancer J Clin. 2022;72(1):7–33. - PubMed
    1. Punzon-Jimenez P, Lago V, Domingo S, Simon C, Mas A. Molecular Management of High-Grade Serous Ovarian Carcinoma. Int J Mol Sci 2022, 23(22). - PMC - PubMed
    1. Lisio MA, Fu L, Goyeneche A, Gao ZH, Telleria C. High-Grade Serous Ovarian Cancer: Basic Sciences, clinical and therapeutic standpoints. Int J Mol Sci 2019, 20(4). - PMC - PubMed
    1. Vaughan S, Coward JI, Bast RC, Jr, Berchuck A, Berek JS, Brenton JD, Coukos G, Crum CC, Drapkin R, Etemadmoghadam D, et al. Rethinking ovarian cancer: recommendations for improving outcomes. Nat Rev Cancer. 2011;11(10):719–25. - PMC - PubMed

LinkOut - more resources