. 2023 Sep 30;14(1):6121.
doi: 10.1038/s41467-023-41827-0.

Heat-inactivated Bifidobacterium adolescentis ameliorates colon senescence through Paneth-like-cell-mediated stem cell activation

Affiliations

Heat-inactivated Bifidobacterium adolescentis ameliorates colon senescence through Paneth-like-cell-mediated stem cell activation

Yadong Qi et al. Nat Commun. .

Abstract

Declined numbers and weakened functions of intestinal stem cells (ISCs) impair the integrity of the intestinal epithelium during aging. However, the impact of intestinal microbiota on ISCs in this process is unclear. Here, using premature aging mice (telomerase RNA component knockout, Terc-/-), natural aging mice, and in vitro colonoid models, we explore how heat-inactivated Bifidobacterium adolescentis (B. adolescentis) affects colon senescence. We find that B. adolescentis could mitigate colonic senescence-related changes by enhancing intestinal integrity and stimulating the regeneration of Lgr5+ ISCs via Wnt/β-catenin signaling. Furthermore, we uncover the involvement of Paneth-like cells (PLCs) within the colonic stem-cell-supporting niche in the B. adolescentis-induced ISC regeneration. In addition, we identify soluble polysaccharides (SPS) as potential effective components of B. adolescentis. Overall, our findings reveal the role of heat-inactivated B. adolescentis in maintaining the ISCs regeneration and intestinal barrier, and propose a microbiota target for ameliorating colon senescence.


Conflict of interest statement

The authors declare no competing interests.

Figures
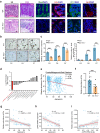
Fig. 1
Fig. 1. The association between senescent colon characterized by impaired intestinal integrity and reduced stemness with B. adolescentis abundance.
a Representative images of H&E staining, PAS staining, immunofluorescence staining of Muc2 (green), ZO-1 and Ocln and Lgr5 in the colon of WT and G3 Terc-/- mice. Scale bar, 50 μm. n = 6 animals per group. b Representative images (growing on day 3, 5 and 7) of colonoids derived from WT and G3 Terc-/- mice, Scale bar, 100 μm. Representative pictures are shown, n = 4 independent experiments. c Comparison of size and de novo buds’ number in colonoids derived from WT and G3 Terc-/- mice. n = 4 independent experiments. Comparisons were performed by Two-way ANOVA analysis followed by Bonferroni’s multiple comparisons test. d The fold change differences (Young/Old group) of the top shared microbiota in the CuratedMetagenomicData. e Correlation analysis between the relative abundance of B. adolescentis and age in CuratedMetagenomicData Database (n = 1004, Spearman r = −0.32, p < 0.001). Comparisons were performed by Spearman’s correlation analysis. f Comparison of fecal B. adolescentis abundance between WT and G3 Terc-/- mice (n = 12 animals per group). Data were represented as mean ± SEM. Comparisons were performed by unpaired, two-tailed t test. g Correlation analysis between the abundance of B. adolescentis and different ages in human colonic tissues (n = 40, Pearson r = −0.4631, p < 0.05). Comparisons were performed by Pearson’s correlation analysis. h Correlation analysis between the expression of the LGR5 gene in human colonic tissues and different ages (n = 40, Pearson r = −0.5018, p < 0.001). Comparisons were performed by Pearson’s correlation analysis. i Correlation analysis between the abundance of B. adolescentis and the LGR5 gene in human colonic tissues (n = 40, Pearson r = 0.3256, p < 0.05). Comparisons were performed by Pearson’s correlation analysis. ***p < 0.001, Source data and exact p value are provided as a Source data file.
Fig. 2
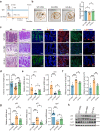
Fig. 2. Heated-inactivated B. adolescentis alleviated colon senescence phenotype by improving the intestinal barrier and restoring ISCs in G3 Terc-/- mice.
a The schematic diagram of the WT and G3 Terc-/- mice experimental procedure. b Representative image of gross morphology and length analysis of the mouse colon. n = 6 animals per group, the error bars indicate the mean ± SEM. Comparisons were performed by One-way ANOVA analysis followed by Dunnett’s multiple comparisons test. c Representative image of H&E staining and PAS staining, immunofluorescence image of Muc2, ZO-1 and Ocln and Lgr5, FISH probe of B. adolescentis in the colon from WT + PBS, G3 Terc-/- + PBS and G3 Terc-/- + B.a mice. Scale bar, 50 μm, n = 6 animals per group. d The mucosal height was measured. n = 15 random fields per group. Data were represented as mean ± SEM. Comparisons were performed One-way ANOVA analysis followed by Tukey’s multiple comparisons test. e Relative mRNA levels of ZO-1 and Ocln genes in WT + PBS, G3 Terc-/- + PBS and G3 Terc-/- + B.a mice. n = 6 animals per group. Data were represented as mean ± SEM. Comparisons were performed by Kruskal–Wallis test followed by Two-stage linear step-up procedure of Benjamini, Krieger and Yekutieli. f Relative LPS levels in the fecal and serum samples in WT + PBS, G3 Terc-/- + PBS and G3 Terc-/- + B.a mice. n = 6 animals per group. Data were represented as mean ± SEM. Comparisons were performed by One-way ANOVA analysis followed by Tukey’s multiple comparisons test. g Relative mRNA levels of p53, p21 and Lgr5 gene in WT + PBS, G3 Terc-/- + PBS and G3 Terc-/- + B.a mice. n = 6 animals per group. Data were represented as mean ± SEM. Comparisons in p53, p21 were performed by One-way ANOVA analysis followed by Tukey’s multiple comparisons test and in Lgr5 were performed by Kruskal–Wallis test followed by two-stage linear step-up procedure of Benjamini, Krieger and Yekutieli. h The protein level of p53, p21 and Lgr5 were detected by immunoblot from WT + PBS, G3 Terc-/- + PBS and G3 Terc-/- + B.a mice. *p < 0.05, **p < 0.01, ***p < 0.001. Source data and exact p value are provided as a Source data file.
Fig. 3
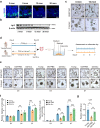
Fig. 3. Heated-inactivated B. adolescentis supplementation improved colonoids performance in vivo.
a, b The expression of the Lgr5 gene was detected in mice colon tissue from different age groups by immunofluorescence and western blot, n = 3 animals per age group. Scale bar, 50 μm. c Representative images of colonoids derived from 3-month-old mice and 12-month-old mice with n = 3 independent experiments with similar results. Arrows indicate crypt domains. Scale bar, 100 μm. d The schematic diagram of the experimental procedure in the young (3-month-old mice) and old (12-month-old mice) groups. e Representative images are shown from one out of 4 independent experiments with similar results in the organoid-forming capacity of crypts from Young, Old+PBS and Old+B.a mice group. Scale bar, 100 μm. f Relative size of colonoids quantified on days 3, 5 and 7 and represented relative to the Young group. n = 4 independent experiments per group) on days 3, 5 and 7. Data were represented as mean ± SEM. Comparisons were performed by Two-way ANOVA analysis followed by Tukey’s multiple comparisons test. g Relative mRNA levels of the Lgr5 gene in Young, Old+PBS and Old+B.a mice group, n = 3 individual experiments. Data were represented as mean ± SEM. Comparisons were performed by unpaired, two-tailed t test. *p < 0.05, **p < 0.01, ***p < 0.001. Source data and exact p value are provided as a Source data file.
Fig. 4
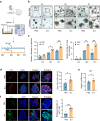
Fig. 4. Heated-inactivated B. adolescentis increased the proliferation of colonoids in vitro.
a The schematic diagram of the experimental procedure in mice colonoids. b Representative images with 3 independent experiments in the organoid-forming capacity of crypts from PBS or B.a treated group. Scale bar, 100 μm. c The relative size of colonoids was quantified on days 3, 5 and 7 and represented relative to PBS treated group (n = 3 independent experiments per group). Data were represented as mean ± SEM. Comparisons were performed by Two-way ANOVA analysis followed by Bonferroni’s multiple comparisons test. d Representative images of colonoids staining with DAPI (blue) and EdU (red); Scale bar, 50 μm. The mean density of EdU-positive cells in each group was calculated. n = 6 random field of view per group in three independent experiments. Data were presented as the mean ± SEM. Comparisons were performed by unpaired, two-tailed t test e Relative expression of Lgr5 gene in PBS and B.a treated group (n = 5 biological replicates per group). Data were presented as the mean ± SEM. Comparisons were performed by unpaired, two-tailed t test. f Representative images of Lgr5 staining (green) and DAPI staining (blue) in colonoids with 3 independent experiments. The number of Lgr5+ cells in each crypt was counted and represented relative to PBS-treated group. n = 7 random field of view per group in 3 independent experiments. Scale bar, 50 μm. Data were presented as the mean ± SEM. Comparisons were performed by unpaired, two-tailed t test. *p < 0.05, **p < 0.01, ***p < 0.001. Source data and exact p value are provided as a Source data file.
Fig. 5
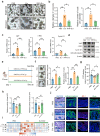
Fig. 5. Wnt/β-catenin pathway involved in heated-inactivated B. adolescentis induced ISCs proliferation.
a Heatmap visualization of a series of Wnt/β-catenin and Notch pathway genes in PBS and B. adolescentis treated colonoids. Asterisk denotes statistical significance. Source data and exact p value are provided as a Source data file. b Relative mRNA levels of Cyclin D1 and c-Myc were shown. n = 10 individual experiments per group. Data were represented as mean ± SEM. Comparisons were performed by unpaired, two-tailed t test. c Representative images of immunostaining staining with DAPI (blue) and active β-catenin (green) in colonoids. Scale bar, 25 μm. n = 3 independent experiments. d Immunoblot of Cyclin D1, c-Myc and active β-catenin in colonoids from PBS or B. adolescentis treated group. n = 3 independent experiments. Data were represented as mean ± SEM. Comparisons were performed by Two-way ANOVA followed by Two-stage linear step-up procedure of Benjamini, Krieger and Yekutieli. e The expression of c-Myc, Cyclin D1 and Axin2 genes were detected by qPCR from WT + PBS, G3 Terc-/- + PBS and G3 Terc-/- + B.a mice group. n = 6 animals per group. Data were represented as mean ± SEM. Comparisons in Cyclin D1 and Axin2 were performed by One-way ANOVA analysis followed by Tukey’s multiple comparisons test and in c-Myc were performed by Kruskal–Wallis test followed by Two-stage linear step-up procedure of Benjamini, Krieger and Yekutieli. test. f The protein level of c-Myc, Cyclin D were detected by immunoblot from WT + PBS, G3 Terc-/- + PBS and G3 Terc-/- + B.a mice group. n = 3 animals per group. *p < 0.05, **p < 0.01, ***p < 0.001. Source data and exact p value are provided as a Source data file.
Fig. 6
Fig. 6. Wnt/β-catenin pathway involved in B. adolescentis-induced ISCs proliferation.
a, b Representative images in organoid-forming capacity and size of colonoids quantified from PBS, B.a and IWR + B.a group. Scale bar, 100 μm. n = 3 independent experiments per group. Data were represented as mean ± SEM and represented relative to PBS control. Comparisons were performed by One-way ANOVA analysis followed by Tukey’s multiple comparisons test. c The expression of Lgr5 and Wnt/β-catenin target genes were detected by qPCR from PBS, B.a and IWR + B.a treated group. n = 3 independent experiments. Data were represented as mean ± SEM. Comparisons were performed by One-way ANOVA analysis followed by Tukey’s multiple comparisons test. d The protein level of Lgr5 and Wnt/β-catenin target genes were detected by immunoblot from PBS, B.a and IWR + B.a treated group. e Schematic diagrams of inhibition experiment in vivo from PBS, B.a, B.a + XAV group, n = 8 animals per group. f Representative images in organoid-forming capacity and size of colonoids quantified from PBS, B.a, B.a + XAV group on day 7. Arrows indicate crypt domains. Scale bar, 100 μm. Data was from 3 independent experiments with a total of n = 8 mice per group. Data were represented as mean ± SEM and represented relative to PBS control. Comparisons were performed by One-way ANOVA analysis followed by Tukey’s multiple comparisons test. g FITC-dextran concentration in the serum in PBS, B.a and B.a + XAV group mice. n = 8 animals per group. Data were represented as mean ± SEM. Comparisons were performed by One-way ANOVA analysis followed by Tukey’s multiple comparisons test. h Relative LPS levels in the fecal and serum samples in PBS, B.a and B.a + XAV mice. n = 8 animals per group. Data were represented as mean ± SEM. Comparisons were performed by One-way ANOVA analysis followed by Tukey’s multiple comparisons test. i Heatmap visualization of a series of (c-Myc, Cyclin D1, Lgr5, Ocln, ZO-1) genes in PBS, B.a and B.a + XAV group. Pound key (#) denotes statistical significance between PBS and B.a group, asterisk (*) denotes statistical significance between B.a and B.a + XAV group. n = 8 animals per group. Source data are provided as a Source Data file. Comparisons were performed by One-way ANOVA analysis followed by Tukey’s multiple comparisons test. j Representative image of AB-PAS staining and immunofluorescence image of active-β-catenin, ZO-1 and Ocln in the colon from indicated mice. n = 8 animals per group. Scale bar, 50 μm, n = 8 animals per group. *p < 0.05, **p < 0.01, ***p < 0.001. #p < 0.05, ##p < 0.01, ###p < 0.001. Source data and exact p-value are provided as a Source data file.
Fig. 7
Fig. 7. Paneth-like cells were involved in ISC-promoted regulation of B. adolescentis.
a Heatmap visualization of a series of Wnt family genes in PBS or B. adolescentis treated colonoids (above). Comparisons were performed by unpaired, two-tailed t test. Asterisk denotes statistical significance. n = 6 individual experiments per group. Heatmap visualization of a series of Wnt family genes in WT + PBS, G3 Terc-/- + PBS and G3 Terc-/- + B.a mice group (below). n = 6 individual experiments per group. Comparisons were performed by One-way ANOVA analysis followed by Tukey’s multiple comparisons test. Pound key (#) denotes statistical significance between WT + PBS and G3 Terc-/- + PBS group, asterisk (*) denotes statistical significance between G3 Terc-/- + PBS and G3 Terc-/- + B.a group. b Paneth-like cells (green dots) cluster in human single-cell transcriptome data (GSE125970). c Gene set variation analysis (GSVA) was performed in the Paneth-like-cell cluster from the colon tissues. Wnt/β-catenin signaling pathway was highlighted. d Integration of LYZ, REG4 and LGR5 gene expression in human colon spatial transcriptomics profiles on Visium datasets (GSE158328). e Cell communication between PLCs and ISCs in the single-cell transcriptome (top), and validation of the co-localization of PLCs and ISCs cells in spatial transcriptomics (bottom). f Western blot results of Lyz and Reg4 in WT + PBS, G3 Terc-/- + PBS and G3 Terc-/- + B.a mice. n = 3 animals per group. g Immunofluorescence staining of Lgr5 (green) and Lyz (red) in colonoids treated with B. adolescentis or PBS as a control. Scale bar, 100 μm. n = 3 biological replicates per group. h Immunofluorescence staining of Lgr5 (green) and Lyz (red) in the colon from WT, G3 Terc-/- + PBS and G3 Terc-/- + B.a mice. Scale bar, 50 μm. n = 6 animals per group. i Relative mRNA levels of LYZ and REG4 gene in normal colon tissues in the young group (20-39 years, n = 49 individuals) and old group (60–79 years, n = 90 individuals) from GTEx database. Data were represented as mean ± SEM. Comparisons were performed by unpaired, two-tailed t test. j, k Correlation analysis of the expression of LYZ and REG4 with age in human colonic tissues with different ages (n = 40, Spearman r = −0.7031, p < 0.001 and r = −0.3911, p < 0.05). Comparisons were performed by Pearson’s correlation analysis. *p < 0.05, **p < 0.01, ***p < 0.001. #p < 0.05, ##p < 0.01, ###p < 0.001. Source data and exact p value are provided as a Source data file.
Fig. 8
Fig. 8. Identification of crude active components in heated-inactivated B. adolescentis.
a Schematic diagrams of crude extraction and intervention about B. a. b, c Representative images in organoid-forming capacity and size of colonoids quantified from NC, B.a, supernatant and precipitation group on day 7. Scale bar, 100 μm. Arrows indicate crypt domains. n = 3 independent experiments. Data were represented as mean ± SEM and represented relative to NC control. Comparisons were performed by One-way ANOVA analysis followed by Tukey’s multiple comparisons test. d The expression of Lgr5 and Ascl2 genes were detected by qPCR from NC, B.a, supernatant and precipitation group. n = 3 independent experiments. Data were represented as mean ± SEM. Comparisons were performed by One-way ANOVA analysis followed by Tukey’s multiple comparisons test. e, f Representative images in colonoid-forming capacity and size of colonoids quantified from B.a, SPS, WPG and Lipids group on day 7. Scale bar, 100 μm. Arrows indicate crypt domains. n = 3 independent experiments. Data were represented as mean ± SEM and represented relative to NC control. Comparisons were performed by One-way ANOVA analysis followed by Tukey’s multiple comparisons test. n = 3 independent experiments. g The expression of Lgr5 and Ascl2 genes were detected by qPCR from B.a, SPS, WPG and Lipids group. n = 3 independent experiments Data were represented as mean ± SEM. Comparisons were performed by One-way ANOVA analysis followed by Tukey’s multiple comparisons test. *p < 0.05, **p < 0.01, ***p < 0.001, n.s. not significant. Source data and exact p value are provided as a Source data file. SPS soluble polysaccharides, WPG whole peptidoglycan.
Fig. 9
Fig. 9. A model of the proposed mechanism by which B. adolescentis ameliorates colon senescence.
The proposed scheme shows that B. adolescentis ameliorates senescent colon and intestinal integrity by promoting ISCs regeneration via the PLCs-mediated Wnt/β-catenin pathway. SPS soluble polysaccharides, ISC intestinal stem cells, B.a Bifidobacterium adolescentis.

Similar articles

Cited by

References

    1. Barker N, et al. Identification of stem cells in small intestine and colon by marker gene Lgr5. Nature. 2007;449:1003–1007. - PubMed
    1. Wang Q, et al. The aged intestine: performance and rejuvenation. Aging Dis. 2021;12:1693. - PMC - PubMed
    1. Moorefield EC, et al. Aging effects on intestinal homeostasis associated with expansion and dysfunction of intestinal epithelial stem cells. Aging. 2017;9:1898–1915. - PMC - PubMed
    1. Warren PM, Pepperman MA, Montgomery RD. Age changes in small-intestinal mucosa. Lancet. 1978;312:849–850. - PubMed
    1. Funk MC, Zhou J, Boutros M. Ageing, metabolism and the intestine. EMBO Rep. 2020;21:e50047. - PMC - PubMed

Publication types