. 2023 Oct 10;56(10):2388-2407.e9.
doi: 10.1016/j.immuni.2023.09.001. Epub 2023 Sep 29.

Deletion of the inhibitory co-receptor CTLA-4 enhances and invigorates chimeric antigen receptor T cells

Affiliations

Deletion of the inhibitory co-receptor CTLA-4 enhances and invigorates chimeric antigen receptor T cells

Sangya Agarwal et al. Immunity. .

Abstract

Chimeric antigen receptor (CAR) T cell therapy targeting CD19 has achieved tremendous success treating B cell malignancies; however, some patients fail to respond due to poor autologous T cell fitness. To improve response rates, we investigated whether disruption of the co-inhibitory receptors CTLA4 or PD-1 could restore CART function. CRISPR-Cas9-mediated deletion of CTLA4 in preclinical models of leukemia and myeloma improved CAR T cell proliferation and anti-tumor efficacy. Importantly, this effect was specific to CTLA4 and not seen upon deletion of CTLA4 and/or PDCD1 in CAR T cells. Mechanistically, CTLA4 deficiency permitted unopposed CD28 signaling and maintenance of CAR expression on the T cell surface under conditions of high antigen load. In clinical studies, deletion of CTLA4 rescued the function of T cells from patients with leukemia that previously failed CAR T cell treatment. Thus, selective deletion of CTLA4 reinvigorates dysfunctional chronic lymphocytic leukemia (CLL) patient T cells, providing a strategy for increasing patient responses to CAR T cell therapy.

Keywords: CAR T cells; CRISPR-Cas9; CTLA4; PD-1; T cell exhaustion; acute lymphoblastic leukemia; cancer immunotherapy; checkpoint blockade; chronic lymphocytic leukemia; resistance.


Conflict of interest statement

Declaration of interests A.J.R. is a consultant for Affini-T Therapeutics. M.R. is the scientific founder of viTToria bio and is an inventor of intellectual property (IP) managed by Penn and licensed to Novartis, Tmunity, and viTToria. M.R. is part of the SAB of ABClon, viTToria bio, and Scailyte and has served as a consultant for GLG, BMS, GSK, nanoString, Sana, Bayer. M.M.D. is a consultant and has received research funding from Tmunity Therapeutics and is a consultant and member of the scientific advisory board for Cellares Corporation. J.A.F. is a member of the Scientific Advisory Boards of Cartography Bio. and Shennon Biotechnologies Inc. and has patents, royalties, and other intellectual property. D.L.P. has a consulting or advisory role at Novartis, Kite/Gilead, Incyte, Gerson Lehrman Group, Janssen (Johnson and Johnson), BMS, Bluebird Bio, Angiocrine, Mirror Biologics, Capstan Therapeutics, Instill Bio, Sana Biotherapeutics, and Verismo Therapeutics and research support from Novartis. D.L.P. is a patent inventor for use of CAR T cells in CD19+ malignancies. D.L.P. served as Chair of Board of Directors for National Marrow Donor Program from October 2018 to October 2020. D.L.P. is Associate Editor for Am J Hematology, Wiley and Deputy editor for Transplant and Cell Therapy (ASTCT Journal), Elsevier. D.L.P. spouse has stock and other ownership interests with Genentech and Roche from former employment. C.H.J. is an inventor of patents related to the CAR therapy product, which is the subject of this paper, as well as other CAR therapy products, and may be eligible to receive a select portion of royalties paid from Kite to the University of Pennsylvania. C.H.J. is a scientific co-founder and holds equity in Capstan Therapeutics, Dispatch Biotherapeutics, and Bluewhale Bio. C.H.J. serves on the board of AC Immune and is a scientific advisor to BluesphereBio, Cabaletta, Carisma, Cartography, Cellares, Cellcarta, Celldex, Danaher, Decheng, ImmuneSensor, Kite, Poseida, Verismo, Viracta, and WIRB-Copernicus group. C.H.J., R.M.Y., M.M.D., M.R., and D.L.P. are inventors on patents and/or patent applications licensed to Novartis Institutes of Biomedical Research and Kite and may receive license revenue from such licenses.

Figures

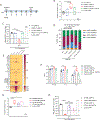
Figure 1.
Figure 1.. CD19 BBz CAR T cells exhibit comparable effector function and cytokine secretion after single stimulation with target cells irrespective of deletion of PD-1 and/or CTLA-4.
A. PD-1 and/or CTLA-4 deletion efficiency as detected by flow cytometry on day 4 of T cell expansion in ND’s (n=8 donors). Error bars indicate mean±standard deviation. Not significant (ns) P > 0.05, * P ≤ 0.05, ** P ≤ 0.01, *** P ≤0.001, **** P ≤ 0.0001 by unpaired t-test. B. Distribution of inferred positions of cleavage and dsODN incorporation at an on-target locus using iGUIDE-seq. Incorporation in different strand orientations is shown on the positive (red) and negative (blue) y axis. The percentage in the bottom right corner is an estimate of the number of incorporations associated with the on-target site (based on pileups) captured within the allowed window of 100bp. The PDCD1 sgRNA binds the positive strand and the CTLA4 sgRNA binds the negative strand. C. Population doublings of edited CAR T cells during the expansion in ND’s (n=3 ND’s). Error bars indicate mean±standard error of the mean (SEM). Not significant (ns) P > 0.05, * P ≤ 0.05, ** P ≤ 0.01, *** P ≤0.001, **** P ≤ 0.0001, by repeated measure two-way ANOVA with Bonferroni correction for multiple comparisons. D. Representative flow plots (left, n=1 ND) and quantification (right, n=3 ND’s) showing memory phenotype of PD-1 and/or CTLA-4 disrupted CART19 cells. Memory phenotype populations are defined as: Naïve-like (CCR7+ CD45RO−), Central Memory (CM; CCR7+ CD45RO+), Effector memory (EM; CCR7− CD45RO+), Effector (EMRA; CCR7− CD45RO−). Error bars indicate mean±SEM in each memory sub-population. E. Co-inhibitory receptor expression (LAG3, TIM3, CD38 and CD39) assessed by flow cytometry on PD-1 and/or CTLA-4 disrupted CART19 cells during the expansion (n=1 ND). Error bars indicate mean±SD from technical replicates. F. Cytotoxicity of WT and edited CART19 cells tested in a 24 hr luciferase-based assay with NALM6 as targets. Different E:T ratios are shown (n=2 ND’s). Error bars indicate mean±SD. See also Figure S1.
Figure 2.
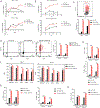
Figure 2.. Deletion of CTLA4 endows CART19 cells with superior in vitro effector function under stress conditions.
A. Experimental design of CAR T cell dysfunction in an in vitro CAE stress test model in which 2.5e5 CART19 cells (Day 0 product) are repeatedly stimulated with 1e6 NALM6 cells every 3 −4 days. Arrows represent each round of re-stimulation with fresh NALM6 target cells. Day 0 product and Day 15 continuously stimulated CART19 cells are sorted for transcriptional analysis. B. Population doublings of WT and CTLA-4-deficient BBz CART19 cells at the end of the CAE stress test quantified by using counting beads-based flow cytometry gated on CD45+ T cells (n=4 ND’s). C. Total tumor burden remaining at the end of the CAE stress test quantified by using counting beads-based flow cytometry gated on GFP+ NALM6 target cells (n=4 ND’s). D. Flow cytometry characterization of CCR7+ CD45RO−, CCR7+ CD45RO+, CCR7− CD45RO+ and CCR7− CD45RO− subsets of WT and CTLA-4-deficient CART19 cells measured on day 14 of the CAE stress test using flow cytometry (n=2 ND’s). E. Heatmap showing the levels of cytokine secretion in the supernatant collected on day 15 in WT and CTLA-4-deficient CART19 cells detected using a 31-plex Luminex assay (n=3 ND’s). F. Concentration of the cytokines that are differentially secreted in the supernatant on day 15 between WT and CTLA-4-deficient CART19 cells detected using a 31-plex Luminex assay (n=3 ND’s). G. Population doublings of BBz and 28z CART19 cells in the in vitro CAE stress test quantified by using counting beads-based flow cytometry gated on CD45+ T cells (n=3 ND’s). H. Total tumor burden remaining at the end of the CAE stress test quantified by using counting beads-based flow cytometry gated on GFP+ NALM6 target cells (n=3 ND’s). Error bars indicate mean±SEM in each memory population. ns P > 0.05, * P ≤ 0.05, ** P ≤ 0.01, *** P ≤0.001, **** P ≤ 0.0001, by ordinary one-way ANOVA or repeated measure two-way ANOVA with Bonferroni correction for multiple comparisons. See also Figure S2.
Figure 3.
Figure 3.. Deletion of CTLA-4 in T cells from non-responding CLL patients enables CART19 cells to clear tumor under stress-test conditions.
A. Population doublings of UTD T cells, WT, and CTLA-4-deficient CART19 cells during the in vitro CAE stress test quantified assessed by counting beads-based flow cytometry gated on CD45+ T cells. NR-01 (top) and PR-01 (bottom) CLL patients are shown. B. Cytotoxicity assessment of surface CAR-normalized day 18 CAE CD45+ sorted WT, and CTLA-4-deficient CART19 and UTD T control cells from NR-01 and PR-01 CLL patients against fresh NALM6 target cells at a 1:2 E:T ratio. C. Representative flow plot (top, NR-01) and quantification (bottom, NR-01 and PR-01) of granzyme B production by UTD T cells, WT and CTLA-4-deficient CART19 cells on day 18 of CAE stress test. D. Representative flow plots (left, NR-01) and quantification (right, NR-01 and PR-01) of Ki67 production by UTD T cells, WT and CTLA-4-deficient CART19 cells on day 18 of CAE stress test. E. Quantification of IL-2 (top) and TNFa (bottom) intracellular production levels in NR-01 and PR-01 CLL patients measured using flow cytometry on day 18 of the CAE stress test. F. Concentration of cytokines in the supernatant from UTD T cells, WT, and CTLA-4-deficient CART19 cells from NR-01 and PR-01 CLL patients detected using 31-plex Luminex assay on day 18 of stress testing. G. Frequency of CD45+ CD80+ and CD45+ CD86+ T cells from NR-01 and PR-01 CLL patients detected using flow cytometry on day 18 of the CAE stress test. H. Frequency of CD45+ICOS+ T cells from NR-01 and PR-01 CLL patients assessed by flow cytometry on day 18 of the CAE stress test. Error bars indicate mean±SD from technical replicates in one patient. NR-01 and PR-01 are shown separately. ns P > 0.05, * P ≤ 0.05, ** P ≤ 0.01, *** P ≤0.001, **** P ≤ 0.0001, by multiple unpaired t-tests with Bonferroni-Dunn correction for multiple comparisons. See also Figure S3.
Figure 4.
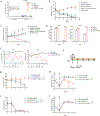
Figure 4.. CTLA-4 deficiency promotes surface CAR expression under stress-test conditions.
A. Quantification of surface CD19 CAR expression of WT and edited CART19 cells at day 0 and day 15 of the CAE stress test (n=5 ND’s). CAR detection was performed using an anti-idiotype antibody conjugated to a fluorophore. B. Level of surface CD19 CAR expression for WT and edited CART19 cells during the stress test (n=4 ND’s). C. Tumor burden in assay with WT and edited CART19 cells during the in vitro stress test model quantified by using counting beads-based flow cytometry gated on GFP+ NALM6 target cells. Arrows indicate addition of new NALM6 cells in each round of restimulation during CAE stress test. D. Quantification of surface CAR expression by UTD, WT, and CTLA-4-deficient CART19 cells in T cells from CLL patients measured using flow cytometry on day 0 and day 18 of CAE stress testing. E. Tumor burden in assay with UTD T cells, WT, and CTLA-4-deficient CART19 cells during the in vitro stress test model quantified by using counting beads-based flow cytometry gated on GFP+ NALM6 targets. NR-01 (left) and PR-01 (right) CLL patients are shown. Arrows show each round of restimulation with the NALM6 targets. F. Experimental design showing cocultures with CART19 cells and NALM6 at E:T ratio of 1:1 on day 0 followed by either 1:10 or 1:100 E:T ratio on day 3. G. Level of surface CD19 CAR expression for WT and CTLA-4-deficient CART19 cells at 1:10 E:T ratio (n=3 ND’s). H. Tumor burden in WT and CTLA-4-deficient CART19 cell groups at 1:10 E:T ratio quantified by using counting beads-based flow cytometry gated on GFP+ NALM6 target cells (n=3 ND’s). Arrows indicate addition of NALM6 cells at 1:1 E:T ratio followed by 1:10 E:T ratio. I. Level of surface CD19 CAR expression for WT and CTLA-4-deficient CART19 cells at 1:100 E:T ratio (n=3 ND’s). J. Tumor burden in assay with WT and CTLA-4-deficient CART19 cell groups at 1:100 E:T ratio quantified by using counting beads-based flow cytometry gated on GFP+ NALM6 target cells (n=3 ND’s). Arrows indicate addition of NALM6 cells at 1:1 E:T ratio followed by 1:100 E:T ratio. Error bars indicate mean±SEM. * P ≤ 0.05, ** P ≤ 0.01, *** P ≤0.001, **** P ≤ 0.0001, by multiple unpaired t-tests or repeated measure two-way ANOVA with Bonferroni correction for multiple comparisons. See also Figure S4A–C.
Figure 5.
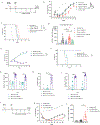
Figure 5.. Deletion of CTLA4 in CART19 cells manufactured from patient T cells enhances anti-tumor efficacy in xenograft models of acute leukemia.
A. Timeline showing experimental design of the ALL-xenograft model. NOD-SCID-IL2rγ−/− (NSG) mice were intravenously injected with NALM6 CGB-GFP. Established NALM6 liquid tumors were treated with WT and respective edited CART19 cells manufactured from ND or CLL patients’ T cells. Mice were imaged every 3–4 days; weighed and retro-orbitally bled every three days. B. Kinetics of tumor burden assessed by bioluminescence from two independent experiments (n=17 mice). C. Kaplan-Meier survival curves from two independent experiments (n=17 mice). D. Frequency of CD3+CD45+ ND T cells in the NSG mice. Peripheral blood was collected 7 days post adoptive transfer of CAR T cells and counted using Trucount based flow cytometry (n=17 mice). E. Kinetics of tumor bioluminescence for NALM6-bearing mice treated with UTD, and CART19 WT and CART19 CTLA-4-deficient T cells derived from NR-01 CLL patient (n=8 mice). F. Kaplan-Meier survival curves for mice treated with UTD, and CART19 WT and CART19 CTLA-4-deficient T cells derived from NR-01 CLL patients (n=8 mice). G. Frequency of CD3+CD45+ human T cells in the NSG mice peripheral blood collected 7 and 14 days post adoptive transfer of NR-01 CLL patient CAR T cells counted using Trucount-based flow cytometry (n=8 mice). H. Surface protein expression of CD28 on CD3+CD45+ human T cells NSG mice in the peripheral blood collected 7 days post adoptive transfer of NR-01 CLL patient CAR T cells measured using flow cytometry (n=8 mice). I. Surface protein expression of CD19 CAR on CD3+CD45+ human T cells in the NSG mice peripheral blood collected 7 and 14 days post-adoptive transfer of NR-01 CLL patient CAR T cells measured using flow cytometry (n=8 mice). J. Timeline showing experimental design of the MM-xenograft model. NOD-SCID-IL2rγ−/− (NSG) mice were intravenously injected with MM1.S CGB-GFP. Established MM1.S liquid tumors were treated with high or low dose WT and CTLA-4-deficient BCMA CAR T cells manufactured from ND. Mice were imaged every 3–4 days; weighed and retro-orbitally bled every week. K. Kinetics of tumor burden in NSG mice treated with WT and CTLA-4-deficient BCMA CAR T cells assessed by bioluminescence from two independent experiments (n=11 mice). L. Frequency of CD45+ ND T cells in the NSG mice treated with WT and CTLA-4-deficient BCMA CAR T cells. Peripheral blood was collected 7 days post adoptive transfer of CAR T cells and counted using counting beads-based flow cytometry (n=14 mice). ** P < 0.01 *** P < 0.001, **** P < 0.0001, ns not significant by repeated measure two-way ANOVA with Bonferroni correction for multiple comparisons or ordinary one-way ANOVA. For Kaplan Meier Curves, Log-rank (Mantel Cox) test was performed. Error bars indicate mean±SEM from two individual experiments. See also Figure S4D–I and S5.
Figure 6.
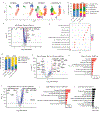
Figure 6.. Transcriptional dynamics of CTLA4-deleted CART19 cells.
A. UMAP projection of scRNA-seq data on day 0 and on day 15 of stress testing of WT and CTLA-4-deficient CART19 cells, determined by Seurat v.4.1. Each dot corresponds to one individual cell. A total of 5 clusters were identified and color-coded (n=2 ND’s). B. Bar plot showing percentage of cells in each cluster in WT and CTLA4-deleted CART19 cells on day 0 and day 15 (n=2 ND’s). Fisher’s exact test was used. Top 3 genes in each cluster are cluster 0 (CCL5, GZMK, KLRK1), cluster 1 (HIST1H4C, TOP2A, TUBA1B), cluster 2 (IL7R, KLF2, SELL), cluster 3 (CCL3, GNLY, GZMB), cluster 4 (PMCH, HSPA1A, HSPA1B), cluster 5 (BIRC3, MALAT1, HSP90AA1). C. Volcano plot identifying the DEGs between day 0 (left) vs day 15 (right) WT CART19 cells. Genes upregulated in the day 15 WT CART19 are indicated on the right side. Red dots indicate genes with p < 1e-50 and log2FC >0.3 (n=2 ND’s). The x axis represents the log fold change; the y axis represents the log10 adjusted p values. A two-sided Wilcoxon rank sum test was used. D. GSE analysis showing the enrichment of publicly available dysfunction and exhaustion datasets when considering all DEGs between day 15 WT CART19 CAE stress test vs day 0 WT CART19 product. E. Bar plot showing percentage of cells in each cluster in WT and CTLA-4-deleted CART19 cells on day 0 and day 18 from NR-01 and PR-01 CLL patients. Fisher’s exact test was used. Top 3 genes in each cluster are cluster 0 (PMCH, GNLY, GZMB), cluster 1 (LTB, FTL, RPS28), cluster 2 (HIST1H4C, TOP2A, TUBA1B), cluster 3 (HIST1H1B, HMGN2, LGALS1). F. Volcano plot identifying the DEGs between day 0 WT CART19 cells (left) and day 0 CTLA-4-deficient CART19 cells (right) from NR-01 and PR-01 CLL patients. Red dots indicate genes with log10 adjusted p values < 1e-50 and log2FC >0.3.). The x axis represents the log fold change; the y axis represents the log10 adjusted p values. A two-sided Wilcoxon rank sum test was used. G. IPA of pathways upregulated at day 0 CTLA-4-deficient CART19 compared to day 0 WT CART19 cells shown as bar graphs. Top pathways were determined by using a significant p-value of <0.05 and pathways with a negative z-score were removed from analysis. H. Volcano plot identifying the DEGs between WT CART19 cells (left) and CTLA-4-deficient CART19 cells (right) after day 18 of CAE stress from NR-01 and PR-01 CLL patients. Red dots indicate genes with p < 1e-50 and log2FC >0.3. The x axis represents the log fold change; the y axis represents the log10 adjusted p values. A two-sided Wilcoxon rank sum test was used. I. IPA of pathways upregulated at day 18 CTLA-4-deficient CART19 compared to day 0 CTLA-4-deficient CART19 cells shown as bar graphs. Top pathways were determined by using a significant p-value of <0.05 and pathways with a negative z-score were removed from analysis. J. IPA of pathways upregulated at day 18 WT CART19 compared to day 0 WT CART19 cells shown as bar graphs. Top pathways were determined by using a significant p-value of <0.05 and pathways with a negative z-score were removed from analysis. See also Figure S6 and Table S1–5.
Figure 7.
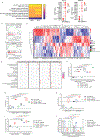
Figure 7.. Uninhibited CD28 co-stimulation enhances the anti-tumor efficacy of CTLA-4-deficient CART19 cells.
A. GSE analysis of common pathways upregulated in CTLA4-deleted CART19 cells in ND and CLL patients showing normalized enrichment scores (NES). B. Downstream targets of CD28 in CTLA-4-deficient CART19 cells after stress testing as predicted by IPA in both ND and CLL patients. Genes that are differentially expressed in stress tested WT and CTLA-4-deficient CART19 cells compared to day 0 WT and CTLA-4-deficient CART19 cells. Glycolytic genes are shown as controls. C. GSE analysis showing positive enrichment of CD28 signaling in genes upregulated after stress testing CTLA4-deleted CART19 compared to WT CART19 cells from donors shown on the top; and genes upregulated at CAE CTLA4-deleted CART19 compared to CAE WT CART19 cells from CLL patients shown at the bottom (n=2 ND’s). D. Heatmap depicting the normalized expression of top 130 DEGs between day 15 of the CAE stress test vs day 0 product in WT CART19 cells and PDCD1- and/ or CTLA4-deleted CART19 cells using nCounter-based readout (n=2 ND’s). E. Dotplot of the NES scored by GSEA showing the significantly enriched pathways when considering all DEGs between day 15 CAE stress test vs day 0 product in each group using nCounter-based readout (n=2 ND’s). F. MFI FD of phospho-ZAP70 (normalized to unstimulated T cells) in WT and edited BBz CART19 cells in the presence or absence of CD28 agonist at the end of the CAE stress test quantified by flow cytometry gated on CD45+ T cells (n=2 ND’s). G. MFI FD of phospho-LCK (normalized to unstimulated T cells) in WT and edited BBz CART19 cells in the presence or absence of CD28 agonist at the end of the CAE stress test quantified by flow cytometry gated on CD45+ T cells (n=2 ND’s). H. MFI FD of phospho-BTK/ITK (normalized to unstimulated T cells) in WT and edited BBz CART19 cells in the presence or absence of CD28 agonist at the end of the CAE stress test quantified by flow cytometry gated on CD45+ T cells (n=2 ND’s). I. Population doublings of WT and edited BBz CART19 cells in the presence of CD28 agonist at the end of the CAE stress test quantified by using counting beads-based flow cytometry gated on CD45+ T cells (n=2 ND’s). J. Total tumor burden remaining presence of CD28 agonist at the end of the CAE stress test quantified by using counting beads-based flow cytometry gated on GFP+ NALM6 target cells (n=2 ND’s). Error bars indicate mean±SEM. ns P > 0.05, * P ≤ 0.05, ** P ≤ 0.01, *** P ≤0.001, **** P ≤ 0.0001, by ordinary one-way ANOVA with Bonferroni correction for multiple comparisons. See also Figure S7 and Table S6–7.

Comment in

Similar articles

Cited by

References

    1. Davila ML, Riviere I, Wang X, Bartido S, Park J, Curran K, Chung SS, Stefanski J, Borquez-Ojeda O, Olszewska M, et al. (2014). Efficacy and Toxicity Management of 19–28z CAR T Cell Therapy in B Cell Acute Lymphoblastic Leukemia. Sci Transl Med 6. - PMC - PubMed
    1. Maude SL, Laetsch TW, Buechner J, Rives S, Boyer M, Bittencourt H, Bader P, Verneris MR, Stefanski HE, Myers GD, et al. (2018). Tisagenlecleucel in Children and Young Adults with B-Cell Lymphoblastic Leukemia. N Engl J Med 378, 439–448. 10.1056/NEJMoa1709866. - DOI - PMC - PubMed
    1. Shah BD, Ghobadi A, Oluwole OO, Logan AC, Boissel N, Cassaday RD, Leguay T, Bishop MR, Topp MS, Tzachanis D, et al. (2021). KTE-X19 for relapsed or refractory adult B-cell acute lymphoblastic leukaemia: phase 2 results of the single-arm, open-label, multicentre ZUMA-3 study. The Lancet 398, 491–502. 10.1016/s0140-6736(21)01222-8. - DOI - PubMed
    1. Young RM, Engel NW, Uslu U, Wellhausen N, and June CH (2022). Next-Generation CAR T-cell Therapies. Cancer Discov, OF1–OF14. 10.1158/2159-8290.CD-21-1683. - DOI - PMC - PubMed
    1. Schultz LM, Baggott C, Prabhu S, Pacenta HL, Phillips CL, Rossoff J, Stefanski HE, Talano JA, Moskop A, Margossian SP, et al. (2022. ). Disease Burden Affects Outcomes in Pediatric and Young Adult B-Cell Lymphoblastic Leukemia After Commercial Tisagenlecleucel: A Pediatric Real-World Chimeric Antigen Receptor Consortium Report. J Clin Oncol. 40, 945–955. 10.1200/JCO.20.03585. - DOI - PMC - PubMed

LinkOut - more resources