. 2023 Sep 4;13(14):4993-5016.
doi: 10.7150/thno.87968. eCollection 2023.

Metabolite Neu5Ac triggers SLC3A2 degradation promoting vascular endothelial ferroptosis and aggravates atherosclerosis progression in ApoE-/-mice

Affiliations

Metabolite Neu5Ac triggers SLC3A2 degradation promoting vascular endothelial ferroptosis and aggravates atherosclerosis progression in ApoE-/-mice

Peng Xiang et al. Theranostics. .

Abstract

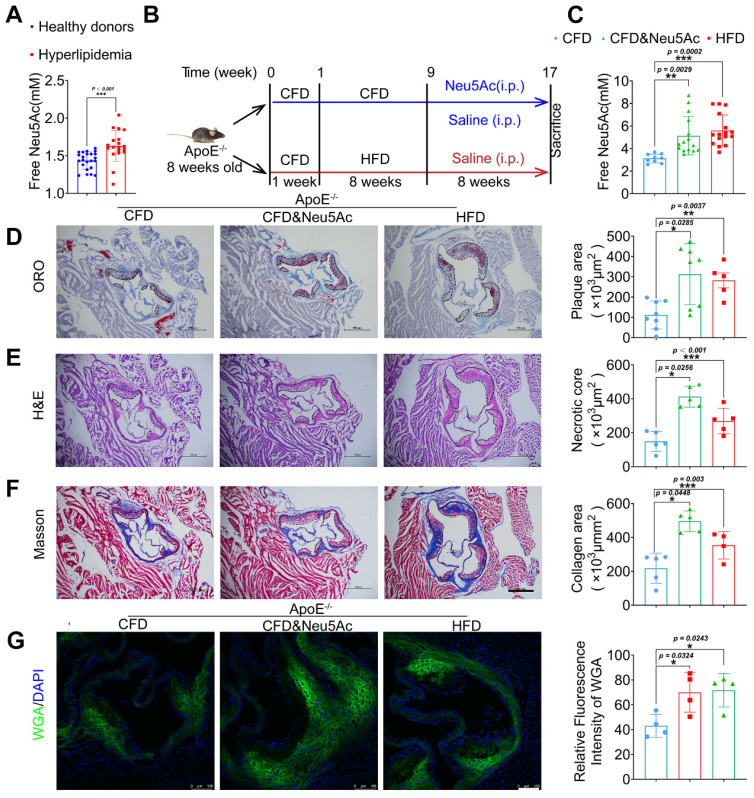
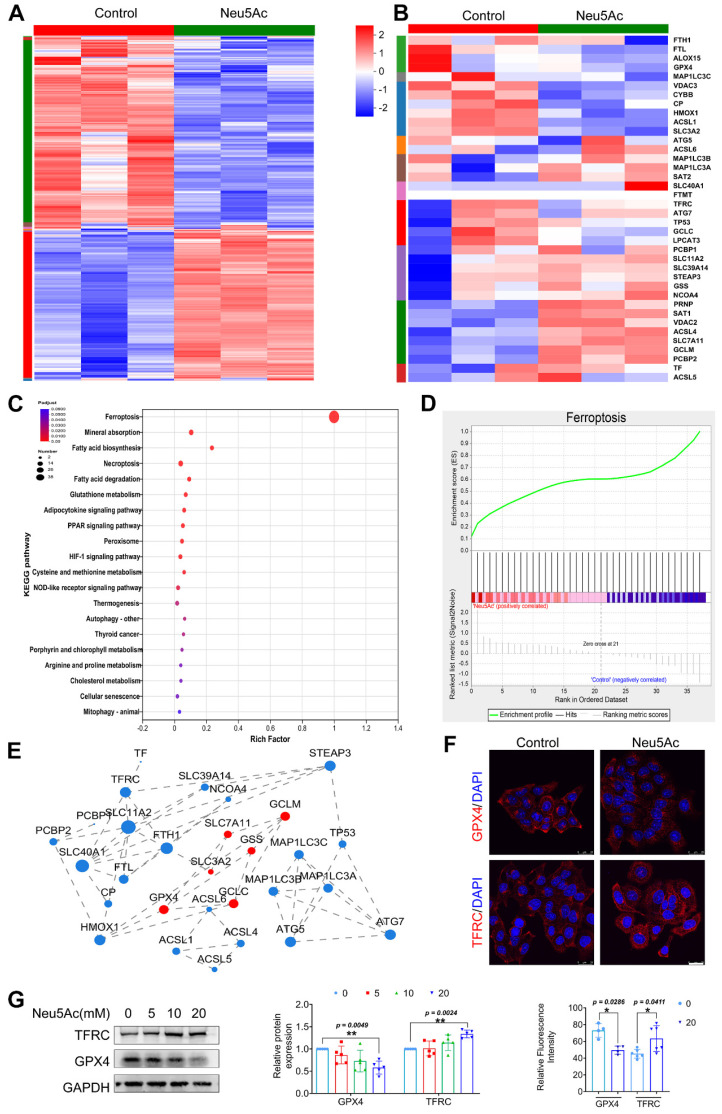
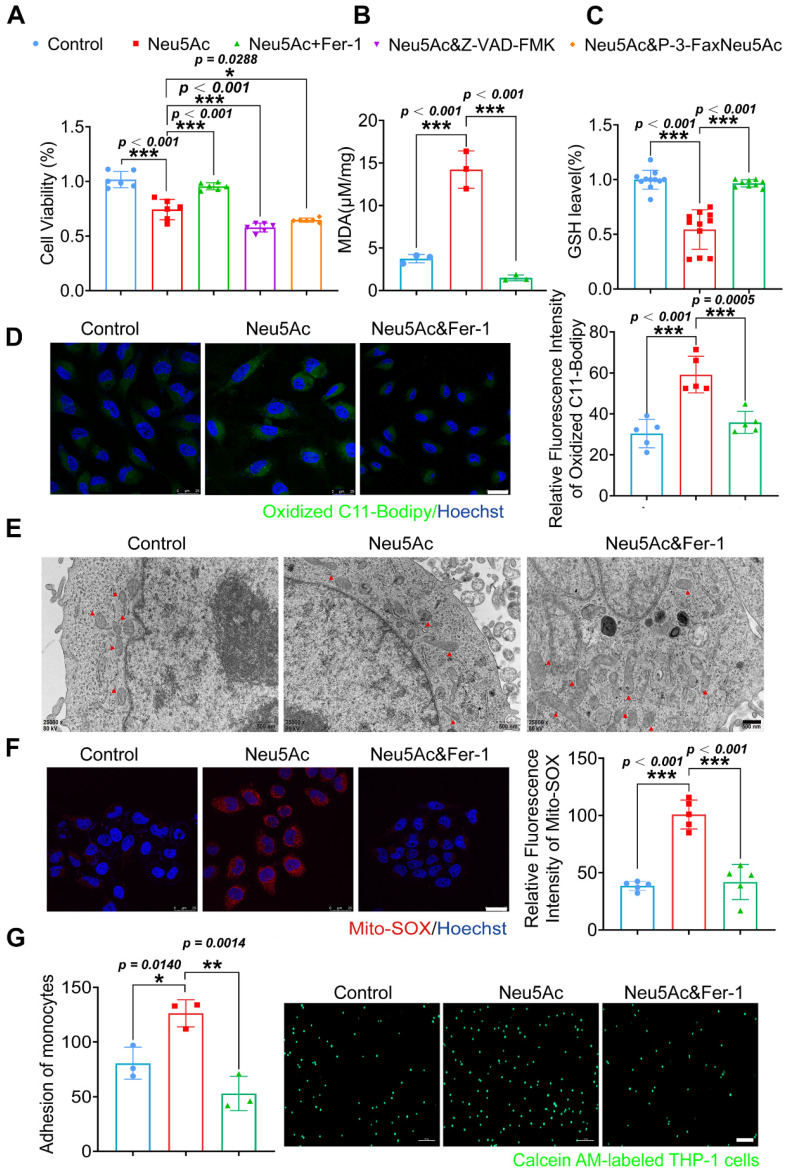
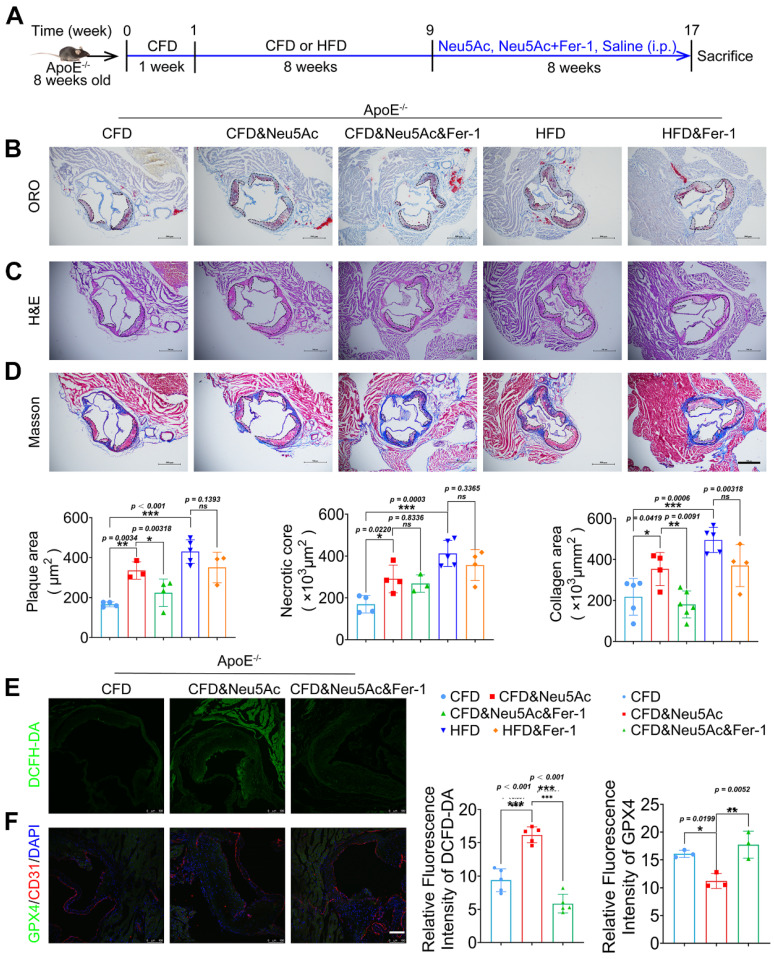
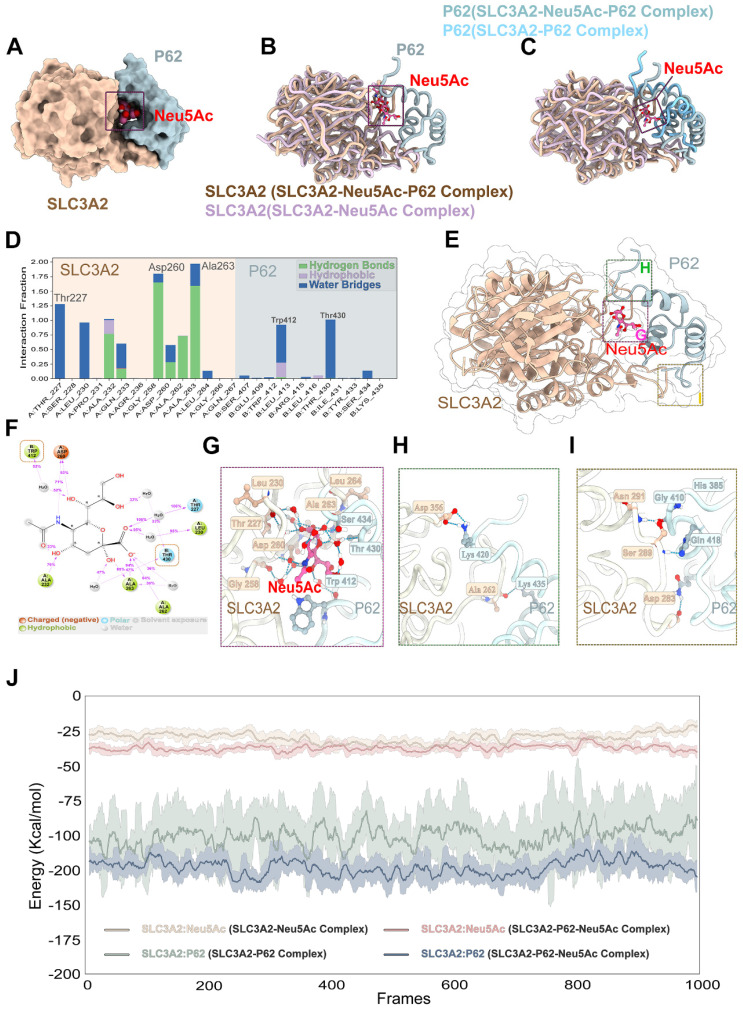
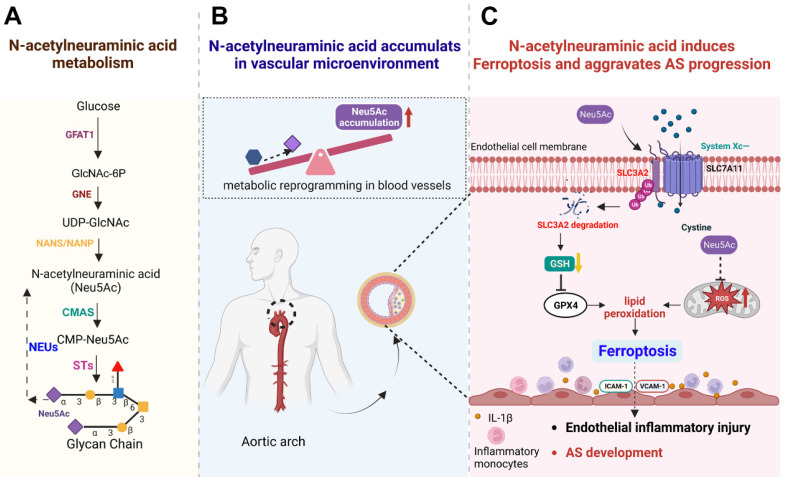
Background: Atherosclerosis (AS) is still the major cause of cardiovascular disease (CVD) as well as stroke. Endothelial metabolic disorder has been found to be activated and then promote endothelial cells (ECs) injury, which is regarded to initiate AS progression. N-acetylneuraminic acid (Neu5Ac), a metabolite produced by hexosamine-sialic acid pathway branching from glucose metabolism, was presented as a notable biomarker of CVD and is positively correlated with ECs function. However, few studies explain whether Neu5Ac regulate AS progression by affecting EC function as well as its involved mechanisms are still unknown. Methods: Here, we mimicked an animal model in ApoE-/- mice which displaying similar plasma Neu5Ac levels with AS model to investigate its effect on AS progression. Results: We found that Neu5Ac exacerbated plaques area and increased lipids in plasma in absence of HFD feeding, and ECs inflammatory injury was supposed as the triggering factor upon Neu5Ac treatment with increasing expression of IL-1β, ICAM-1, and promoting ability of monocyte adhesion to ECs. Mechanistic studies showed that Neu5Ac facilitated SLC3A2 binding to ubiquitin and then triggered P62 mediated degradation, further leading to accumulation of lipid peroxidation in ECs. Fer-1 could inhibit ECs injury and reverse AS progression induced by Neu5Ac in ApoE-/- mice. Interestingly, mitochondrial dysfunction was also partly participated in ECs injury after Neu5Ac treatment and been reversed by Fer-1. Conclusions: Together, our study unveils a new mechanism by which evaluated metabolite Neu5Ac could promote SLC3A2 associated endothelial ferroptosis to activate ECs injury and AS plaque progression, thus providing a new insight into the role of Neu5Ac-ferroptosis pathway in AS. Also, our research revealed that pharmacological inhibition of ferroptosis may provide a novel therapeutic strategy for premature AS.

Keywords: Neu5Ac, ferroptosis, SLC3A2; atherosclerosis, endothelial inflammatory injury.


Conflict of interest statement

Competing Interests: The authors have declared that no competing interest exists.

Figures

Figure 1
Figure 1
Elevated Neu5Ac accelerates atherosclerotic plaque progression in ApoE-/- mice. (A) Plasma Neu5Ac levels were tested by using Assay Kit and found upregulated in Hyperlipidemic compared with healthy donors (n > 20 per group). (B) Experimental design for investigating the effect of Neu5Ac on AS progression in ApoE-/- mice. Briefly, ApoE-/- mice were fed with CFD or HFD and treated intraperitoneally with Neu5Ac (60 mg/kg/d) or saline (60 mg/kg/d) for 8 weeks. (C) Plasma Neu5Ac levels were found to be higher in mice with HFD or Neu5Ac-injecting than mice in CFD-fed group (n > 5 per group). (D) Representative microphotograph of Oil Red O-stained aortic sinus and showed that Oil Red O positive plaque area was larger in HFD-fed and Neu5Ac-injected groups than that in CFD-fed group. Scale bars = 500 μm (n > 3 per group). (E) Representative microphotograph of H&E-stained aortic sinus and found that necrotic core area was up-regulated in HFD or Neu5Ac treatment mice compared with CFD-fed mice. Scale bars = 500 μm (n > 3 per group). (F) Representative images of the aortic sinus stained with Masson's trichrome stain. The quantification of collagen area was larger in HFD or Neu5Ac treatment mice compared with mice in CFD-fed group. Scale bars = 500 μm (n > 3 per group). (G) Representative images of immunofluorescence staining of Neu5Ac-specific fluorescent dye WGA (green) in aortic sinus and found decreased immunofluorescence intensity of WGA in CFD mice compared with HFD and Neu5Ac mice, with quantitative data in the right panel. Scale bars = 100 μm (n = 4 per group). Statistical analysis was performed by Student t test for A, and one-way ANOVA followed by the Tukey test for C-G. Neu5Ac: N-acetylneuraminic acid, WGA: Wheat germ agglutinin, ORO: Oil Red O.
Figure 2
Figure 2
Neu5Ac induced inflammatory injury in HUVECs. (A) HUVECs viability was measured by CCK-8, displaying a reduction in cell viability following treatment with Neu5Ac (0, 5, 10, 20, 40 mM) for 12 and 24 h (n > 3 per group). (B) The IL-1β and ICAM-1 mRNA expression were increased in HUVECs after treating with Neu5Ac (0, 5, 10, 20 mM) for 12 and 24 h (n = 3 per group). (C) Western blotting assay showed that Neu5Ac increases IL-1β and ICAM-1 protein levels in a dose and time dependent manner, with quantitative data in the right panel (n ≥ 3 per group). (D) Representative images of monocyte-endothelial adhesion after Neu5Ac (0, 5, 10, 20 mM) treatment for 12 and 24 h in HUVECs, quantification data revealed Neu5Ac increased EC adhesion to monocytes as shown in the right panel (n ≥ 3 per group). Statistical analysis was performed by one-way ANOVA followed by the Tukey test for A-D. HUVEC: human umbilical vein endothelial cells, IL-1β: Interleukin-1β, ICAM-1: Intercellular cell adhesion molecule-1.
Figure 3
Figure 3
Neu5Ac induces HUVECs injury by promoting ferroptosis pathway. HUVECs were treated with Neu5Ac (20 mM) for 24 h. (A) The hierarchically clustered heatmap showed the differentially expressed genes in HUVECs (n = 3 per group). (B) The hierarchically clustered heatmap showed the ferroptosis-related genes in HUVECs (n = 3 per group). (C) Bubbled blot showed the most significantly altered KEGG pathways in HUVECs, and ferroptosis pathway was enriched mostly (n = 3 per group). (D) GSEA analyzed the enrichment plot of the ferroptosis pathway in HUVECs (n = 3 per group). (E) Construction of protein-protein interaction regulatory network based on differentially expressed genes (n = 3 per group). (F) Immunofluorescence staining of GPX4 and TFRC in HUVECs treated with Neu5Ac (20 mM) for 24 h, showing decrease GPX4 level and increase TFRC level in HUVECs exposed Neu5Ac compared with control. Scale bar = 25 μm. The quantification data were shown below (n > 3 per group). (G) HUVECs were treated with Neu5Ac (0, 5, 10, 20 mM) for 24h, and increased TFRC expression, but lows GPX4 expression, and the quantification of these proteins' expression was shown in the right panel (n = 4 per group). Statistical analysis was performed by Student t test for F and one-way ANOVA followed by the Tukey test for G. KEGG: Kyoto Encyclopedia of Genes and Genomes, GSEA: Gene set enrichment analysis, PPI: Protein-Protein Interaction Networks, GPX4: Glutathione peroxidase 4, TFRC: Transferrin receptor.
Figure 4
Figure 4
Fer-1 protected against HUVECs inflammatory injury by abolishing ferroptosis pathway. (A) CCK-8 assay showed Neu5Ac (20 mM) reduced HUVECs viability, which were reversed by co-treated with Fer-1 (1 μM) rather than Z-VAD-FMK (20 μM) or P-3-Fax-Neu5Ac (100μM) (n > 3 per group). (B) The MDA assay showed Neu5Ac (20 mM) increased MDA levels in HUVECs, which were decreased by co-treated with Fer-1 for 24 h (n = 3 per group). (C) The GSH assay demonstrated Neu5Ac down-regulated GSH levels in HUVECs, which were up-regulated by co-treated with Fer-1 for 24 h (n > 3 per group). (D) Representative images of immunofluorescence staining of C11-BODIPY staining (green) to analyze lipid oxidations. The levels of lipid oxidations were up-regulated in cells with Neu5Ac (20 mM) treatment, which were reversed by Fer-1. The quantification data was shown in the right panel. Scale bar = 25 μm (n = 5 per group). (E) Representative TEM images showed Neu5Ac (20 mM) induced disruption of mitochondrial membrane structure and loss of cristae in HUVECs, which were restored by Fer-1. Scale bar = 500 nm. (F) Immunofluorescence staining of Mito-SOX (red) and Hoechst (blue) in HUVECs, showing increased Mito-SOX levels in HUVECs treated with Neu5Ac (20 mM) and co-treated with Fer-1 can inhibited Mito-SOX. Scale bar = 25 μm (n = 5 per group). (G) Representative images of monocyte-endothelial adhesion. HUVECs were treated with Neu5Ac (20 mM) or Neu5Ac (20 mM) & Fer-1 (1 μM) for 24 h, with quantification data in the right panel (n = 3 per group). Statistical analysis was performed by one-way ANOVA followed by the Tukey test for A-D and F-G. Fer-1: Ferrostatin-1, MDA: Malonaldehyde, GSH: glutathione, TEM: Transmission electron microscope.
Figure 5
Figure 5
Fer-1 suppressed Neu5Ac associated-AS progression in ApoE-/- mice. (A) Experimental design of ApoE-/- mice combined with Fer-1 treatment. ApoE-/- mice fed with CFD or HFD and treated intraperitoneally with Neu5Ac (60 mg/kg/d), Neu5Ac&Fer-1 (10 mg/kg/d), Fer-1 (10 mg/kg/d) or saline (60 mg/kg/d) for 8 weeks. (B) Representative microphotograph of Oil Red O-stained aortic sinus. The quantification of Oil Red O positive plaque area was greater in Neu5Ac-treatment group than Neu5Ac&Fer-1 group. Scale bars = 500 μm (n > 3 per group). (C) Representative microphotograph of H&E-stained aortic sinus. The quantification of necrotic core was up-regulated in Neu5Ac-treatment group compared with Neu5Ac&Fer-1 group. Scale bars = 500 μm (n > 3 per group). (D) Representative microphotograph of the aortic sinus stained with Masson's trichrome stain. The quantification of collagen arear was larger in Neu5Ac-treatment groups than Neu5Ac&Fer-1 group. Scale bars = 500 μm (n > 3 per group). (E) Staining of DCFH-DA-positive (green) arear in the aortic sinus from ApoE-/- mice, showing decreased immunofluorescence intensity of DCFH-DA in the Neu5Ac&Fer-1 group compare with Neu5Ac-treatment group. The quantitative data were shown in the right panel. Scale bar = 25 μm. (n = 4 per group). (F) Representative images of immunofluorescence staining of GPX4 (green), CD31 (red) and DAPI (blue). The quantification of the GPX4 immunofluorescence intensity was increased in the Neu5Ac&Fer-1 group compared with Neu5Ac- treatment group. The quantitative data were shown in the right panel. Scale bar = 25 μm. (n =3 per group). Statistical analysis was performed by one-way ANOVA followed by Tukey test for B-F.
Figure 6
Figure 6
Neu5Ac induced SLC3A2 degradation and promoted ferroptosis pathway. (A) Western blotting showed Neu5Ac (20 mM)-induced decreasing of GPX4, GSS, GCLC, GCLM, SLC7A11 and SLC3A2 protein levels. Following co-treatment with Erastin (10 μM), GCLC protein levels were lower than Neu5Ac treated along, with quantitative data in the right panel (n ≥ 3 per group). (B) Representative images of immunofluorescence staining of GCLC (green), CD31 (red), and DAPI (blue) in aortic sinus from ApoE-/- mice, with quantitative data in the right panel. Scale bar = 100 μm (n = 4 per group). (C) The mRNA levels of SLC7A11 and SLC3A2 were increased after Neu5Ac treatment for 24 h (n = 3 per group). (D) CHX assay was conducted and confirmed Neu5Ac accelerated SLC3A2 protein degradation (n = 3 per group). (E) Representative structure of SLC3A2-Neu5Ac complex modeled with AlphaFold2 algorithm followed by molecular docking. (F-H) Amino acids at the binding site of SLC3A2 and Neu5Ac. (I) HEK293 cells were transfected with SLC3A2 for 48 h, then treated with Neu5Ac (20 mM) for 24 h. The expressions of GPX4, GCLC, GCLM were determined by Western blot, with quantitative data in the right panel (n = 3 per group). Statistical analysis was performed by one-way ANOVA followed by Tukey test for A, B, D, I, and Student t test for the C. CHX: Cycloheximide.
Figure 7
Figure 7
SLC3A2 could bind P62 in the absence of Neu5Ac treatment. (A) Co-immunoprecipitation of SLC3A2 and P62 in HUVECs treated with Neu5Ac (20 mM) for 24 h, and the quantification of SLC3A2 protein expression in the precipitant was shown at the bottom (n = 4 per group). (B) Co-immunoprecipitation of SLC3A2 and Ub in HUVECs treated with Neu5Ac (20 mM) for 24 h, and the quantification of SLC3A2 protein expression in the precipitant was shown at the bottom (n = 4 per group). (C) Representative structure of SLC3A2-P62 complex modeled with AlphaFold2 algorithm followed by molecular docking. (D) The space-filling electrostatic surface charge distribution shows a positively charged groove on the SLC3A2 bound to the negatively charged P62. (E-F) RMSD analysis of SLC3A2, and P62 during 100-ns MD simulations. (G-H) RMSF analysis of SLC3A2, and P62. (I) Hydrogen bonds formed by SLC3A2 and P62 complexes during molecular dynamics simulations. Statistical analysis was performed by Student t test for the A, B. P62: Sequestosome 1, Ub: Ubiquitin, RMSD: Root Mean Square Deviation, RMSF: Root Mean Square Fluctuation.
Figure 8
Figure 8
Neu5Ac promoted SLC3A2 binding to P62. (A-C) Representative structure of SLC3A2-P62-Neu5Ac complex modeled with AlphaFold2 algorithm followed by molecular docking. (D-G) In the SLC3A2-Neu5Ac-P62 ternary complex, Neu5Ac forms hydrogen bonds with SLC3A2 and P62, respectively, during molecular dynamics simulations. (H-I) Hydrogen bonds formed between SLC3A2 and P62 during molecular dynamics simulations in the SLC3A2-Neu5Ac-P62 ternary complex. (J) Extract the last 5 ns from the trajectories of the molecular dynamics of the SLC3A2-Neu5Ac complex, the SLC3A2-P62 complex and the SLC3A2-Neu5Ac-P62 complex (1000 frames in total) and calculate the free energy of binding between SLC3A2-Neu5Ac complex, the SLC3A2-P62 complex and the SLC3A2-Neu5Ac-P62 for each frame.
Figure 9
Figure 9
Schematic concept of metabolite Neu5Ac in inducing ferroptosis and aggravating AS progression. (A) Normal Neu5Ac metabolism pathway in humans with several important enzymes and its catalytic substrate; (B) Upon metabolism disorder such as glucose disorder, Neu5Ac accumulates in vascular microenvironment and identify as a characteristic biomarker of AS progression; (C) Evaluated Neu5Ac in circulation promotes SLC3A2 degradation and decreases GSH levels, further induces lipid peroxides accumulation and activates EC ferroptosis. Meanwhile, Neu5Ac induces mitochondrial damage and releases ROS, which further exacerbates ferroptosis. Together, Neu5Ac induces EC injury and secretes a variety of inflammatory factors which capture circulating monocytes and adhere to the vascular endothelium, leading to the AS progression. Fer-1 could inhibit lipid peroxides and then attenuate ECs injury as well as protect against premature AS induced by Neu5Ac accumulation. GFAT1: Fructose-6-phosphate aminotransferase; GlcNAc-6P: GlcNAc-6-phosphate; GNE: hydrolyzing UDP-GlcNAc 2-epimerase/ManNAc-6-kinase; NANS: Neu5Ac-9-P synthetase; NANP: Neu5Ac-9-P phosphatase; CMAS: cytidine monophosphate N-acetylneuraminic acid synthetase; STs: sialyltransferases; NEUs: neuraminidases.

Similar articles

Cited by

References

    1. Health effects of dietary risks in 195 countries, 1990-2017. a systematic analysis for the Global Burden of Disease Study 2017. Lancet. 2019;393:1958–72. - PMC - PubMed
    1. Benjamin EJ, Muntner P, Alonso A, Bittencourt MS, Callaway CW, Carson AP, Heart Disease and Stroke Statistics-2019 Update: A Report From the American Heart Association. Circulation. 2019. 139. - PubMed
    1. Libby P. The changing landscape of atherosclerosis. Nature. 2021;592:524–33. - PubMed
    1. Liang S, Zhang J, Ning R, Du Z, Liu J, Batibawa JW. et al. The critical role of endothelial function in fine particulate matter-induced atherosclerosis. Part Fibre Toxicol. 2020;17:61. - PMC - PubMed
    1. Li X, Sun X, Carmeliet P. Hallmarks of Endothelial Cell Metabolism in Health and Disease. Cell Metab. 2019;30:414–33. - PubMed

Publication types

Substances