. 2023 Oct 31;42(10):113171.
doi: 10.1016/j.celrep.2023.113171. Epub 2023 Sep 27.

Myeloid BAF60a deficiency alters metabolic homeostasis and exacerbates atherosclerosis

Affiliations

Myeloid BAF60a deficiency alters metabolic homeostasis and exacerbates atherosclerosis

Yang Zhao et al. Cell Rep. .

Abstract

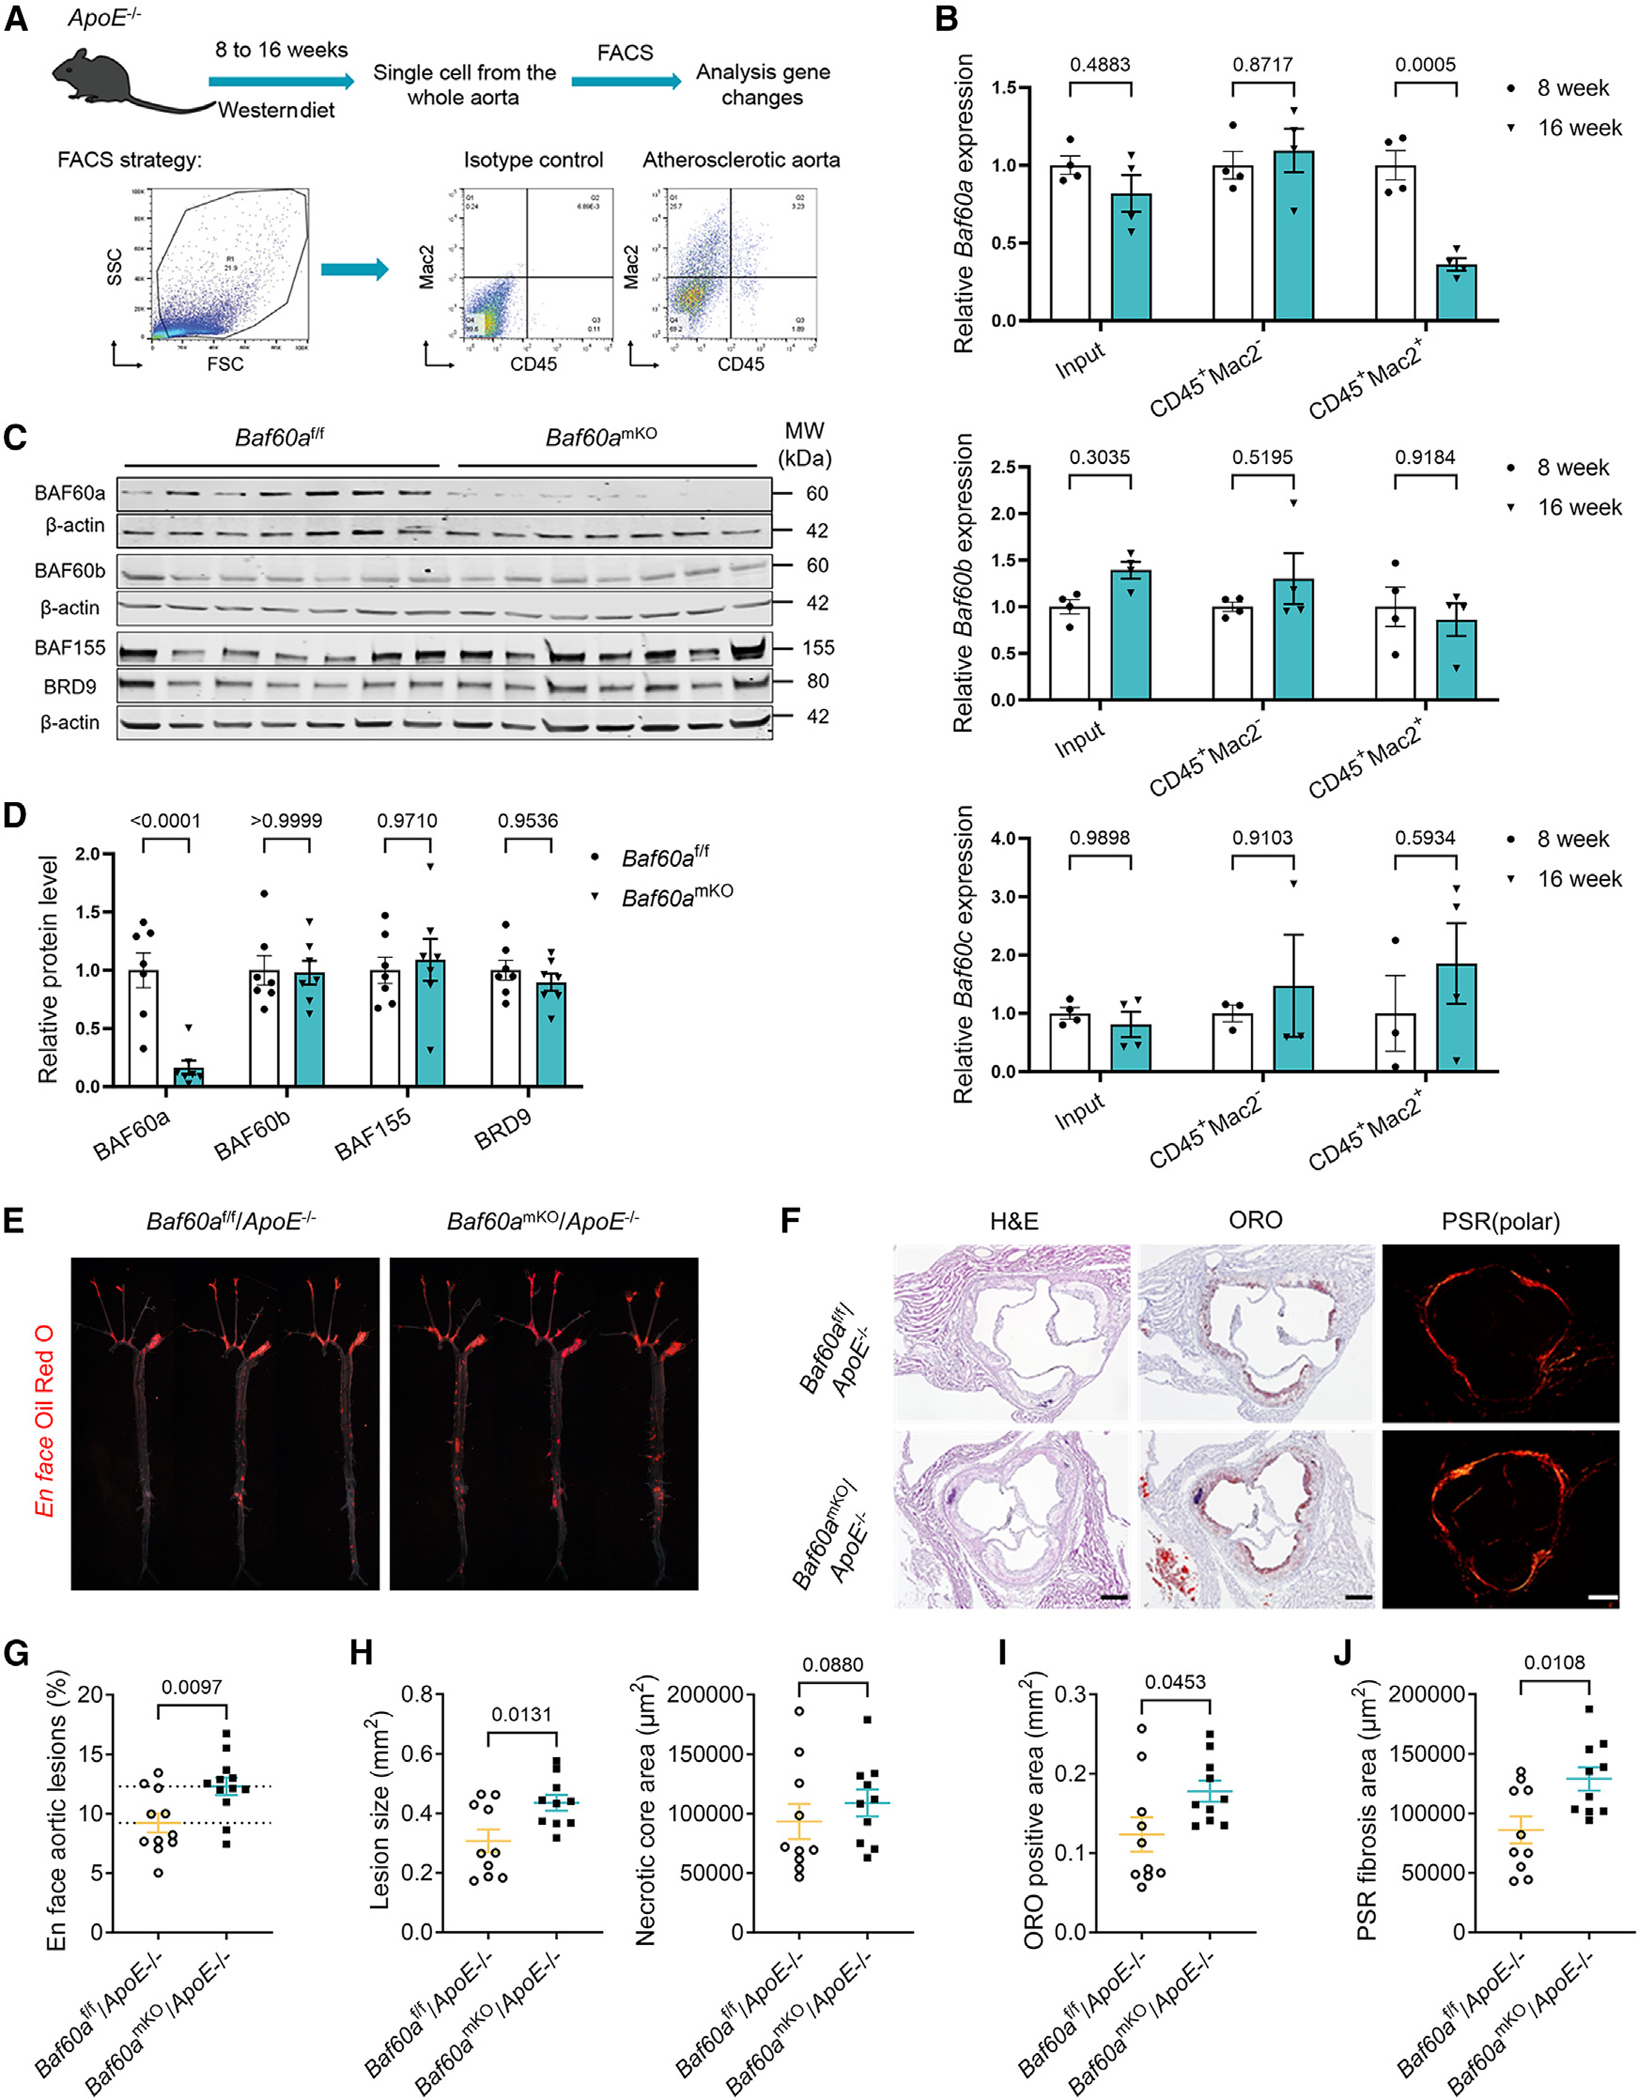
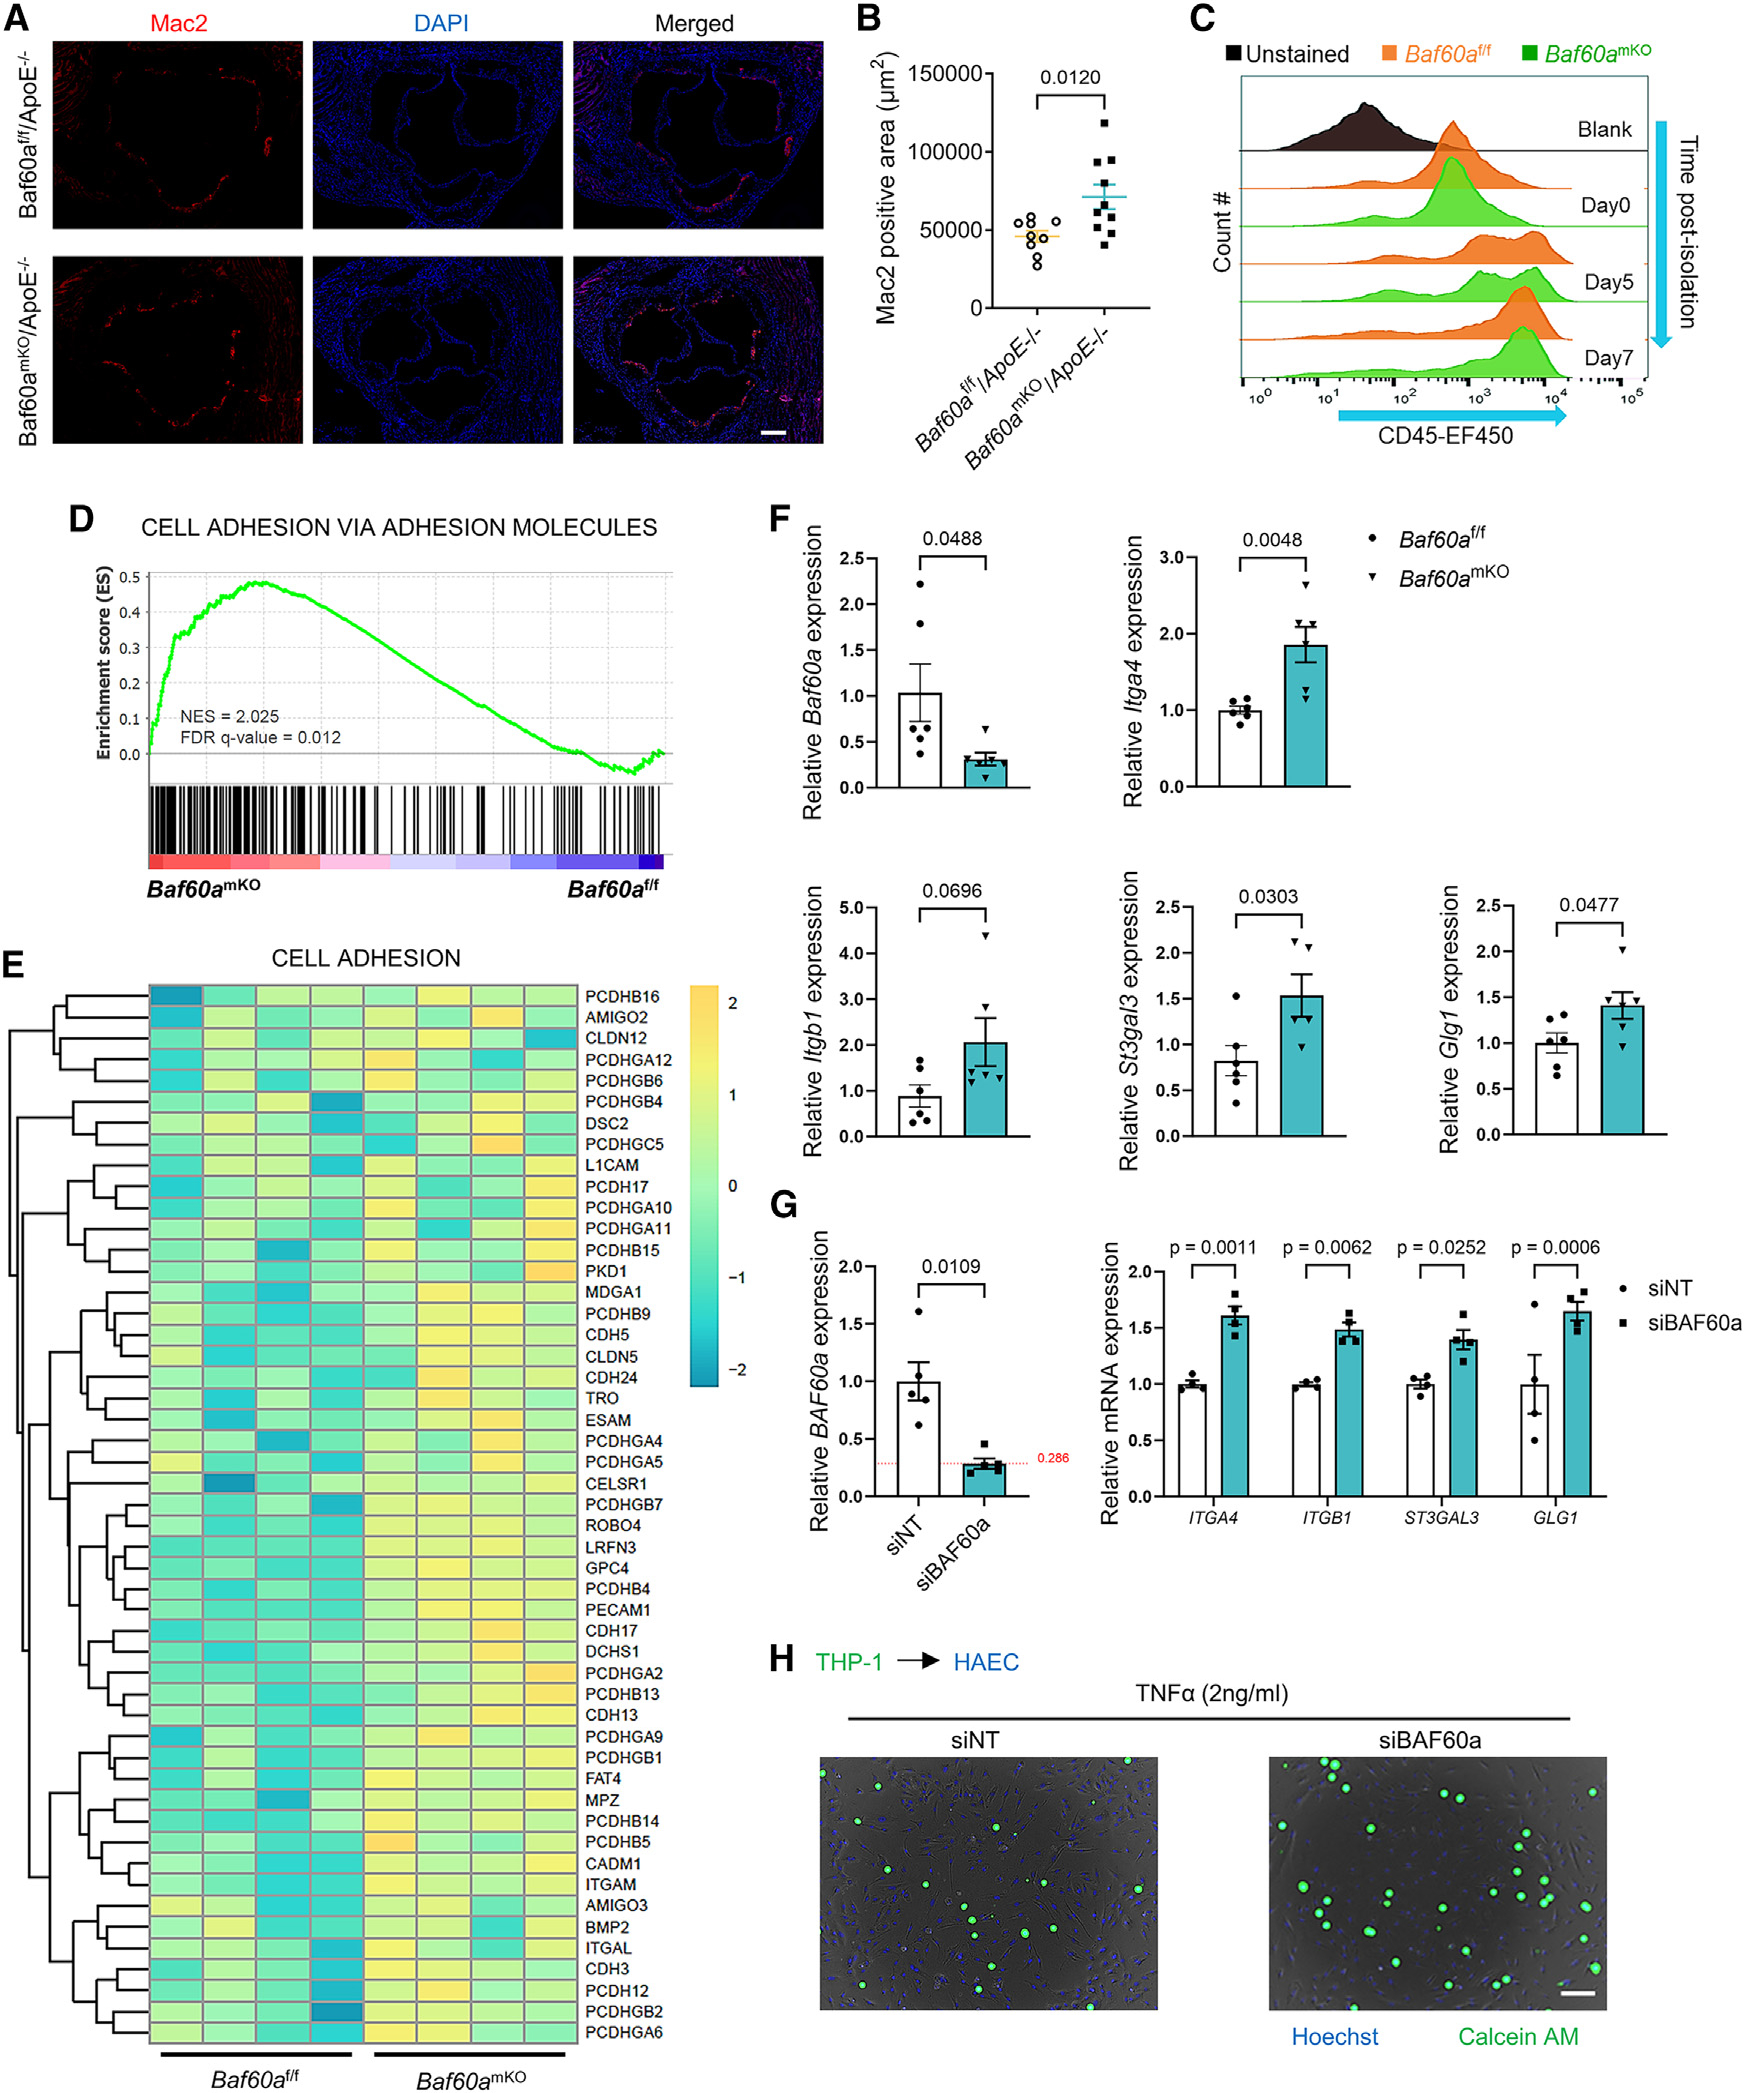
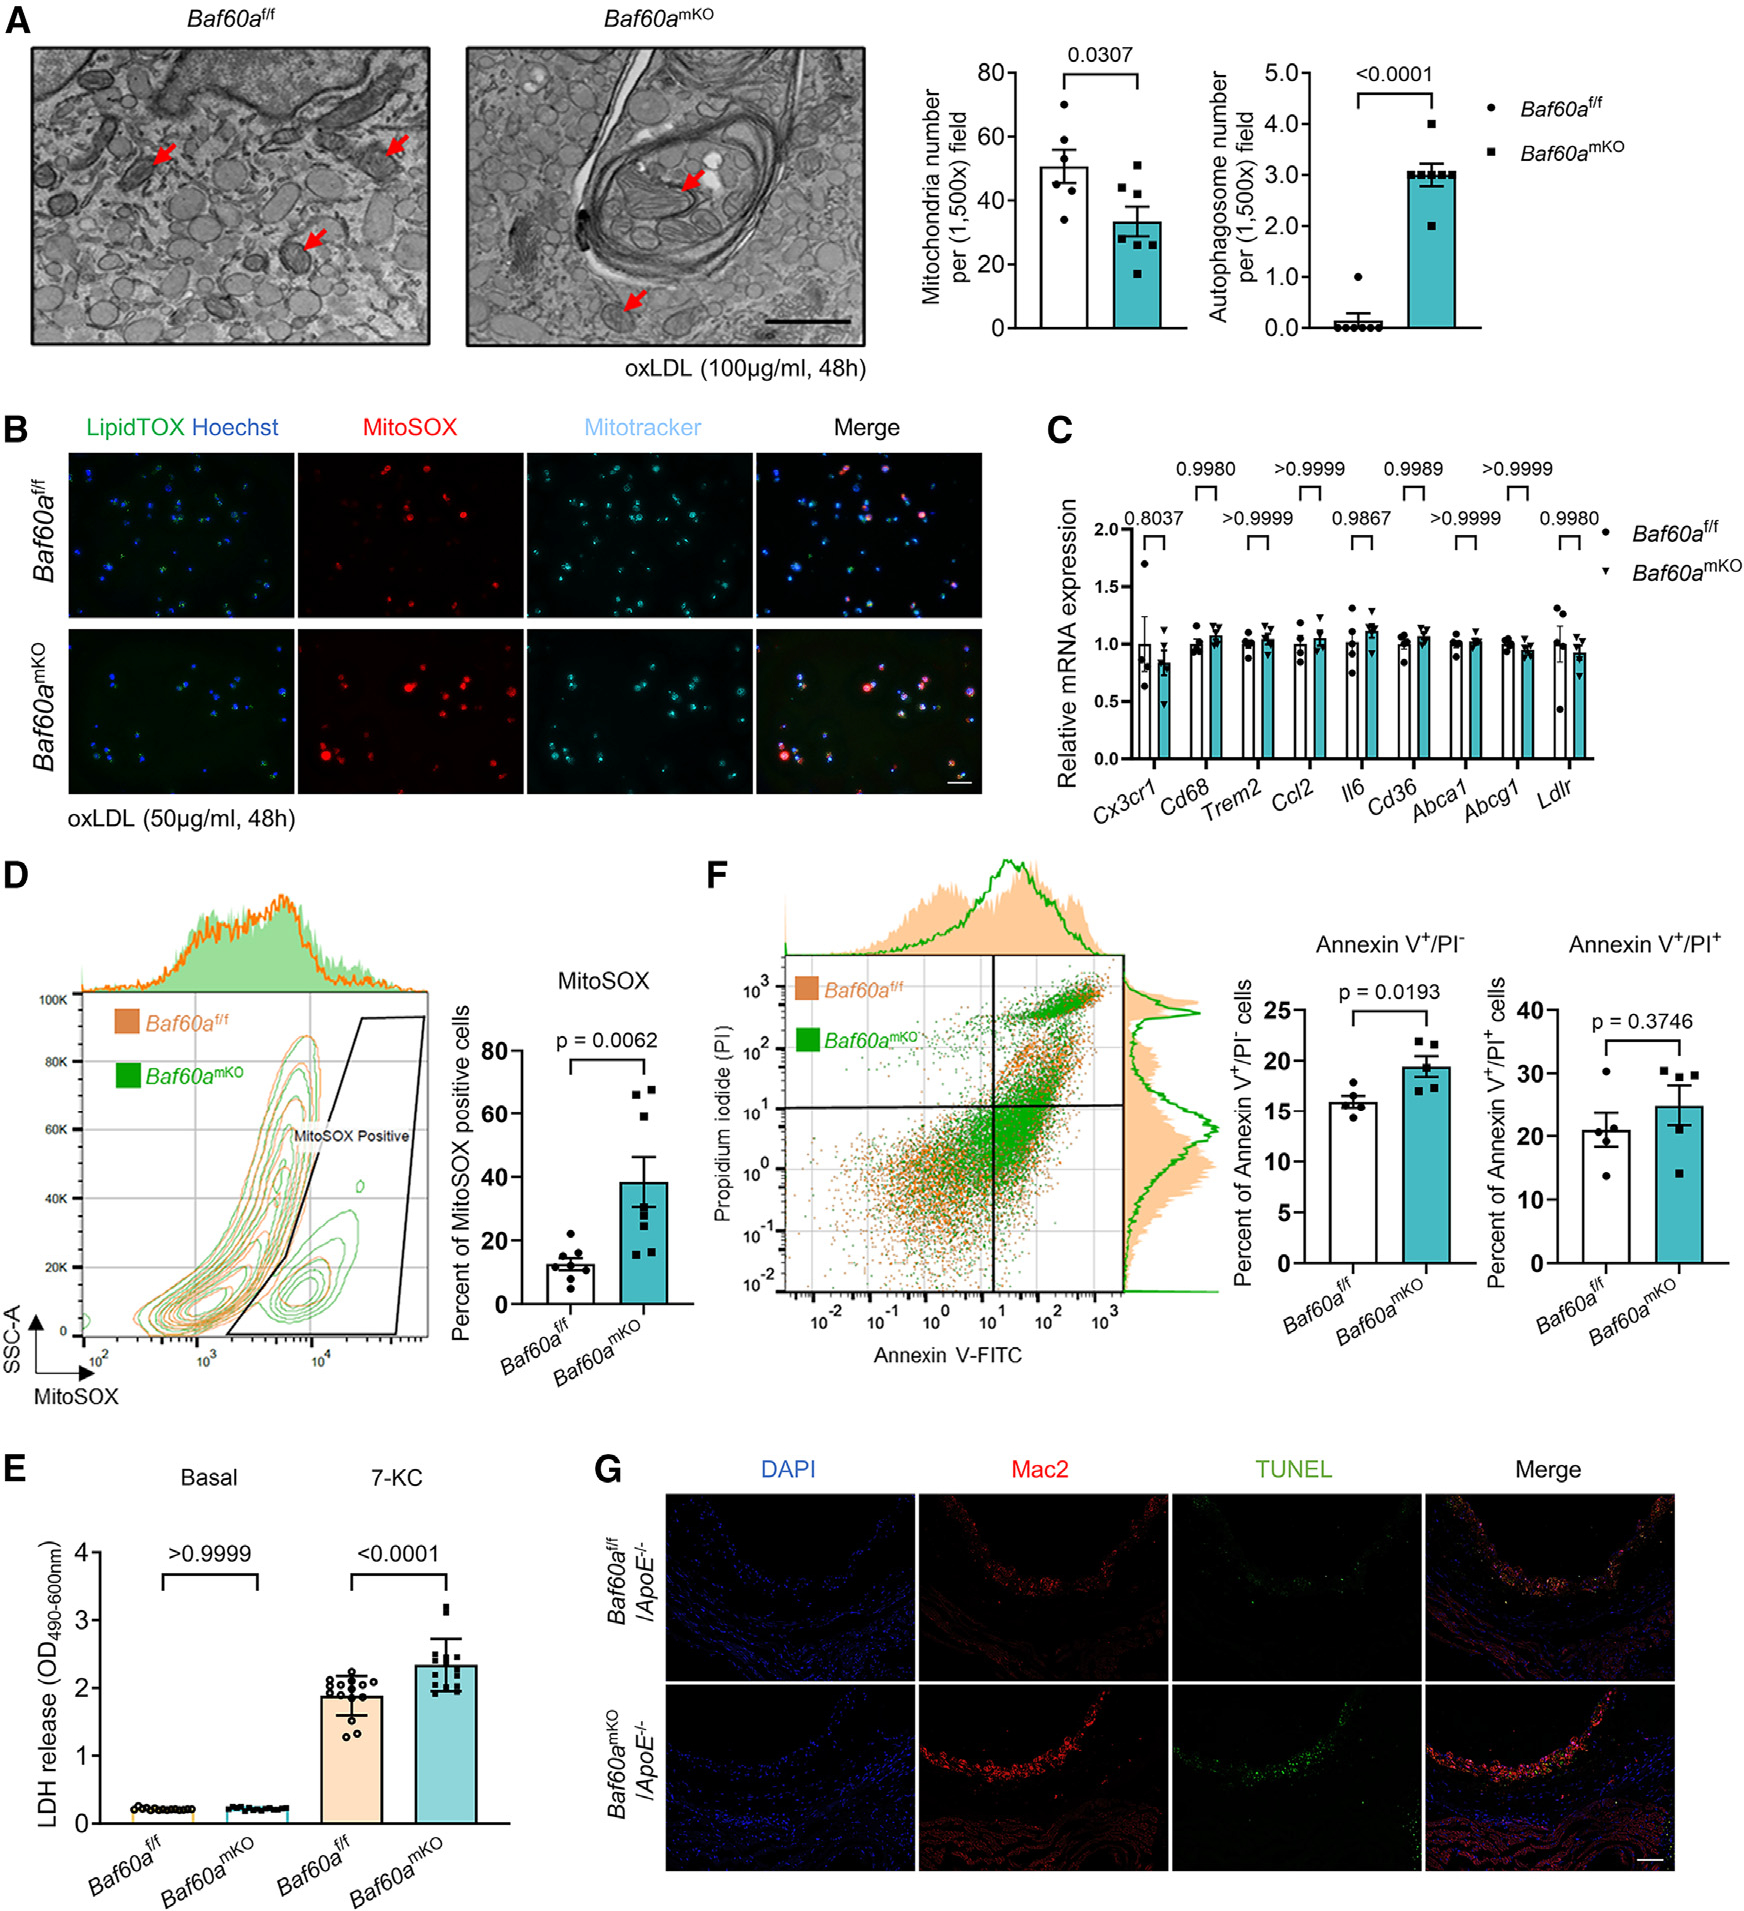
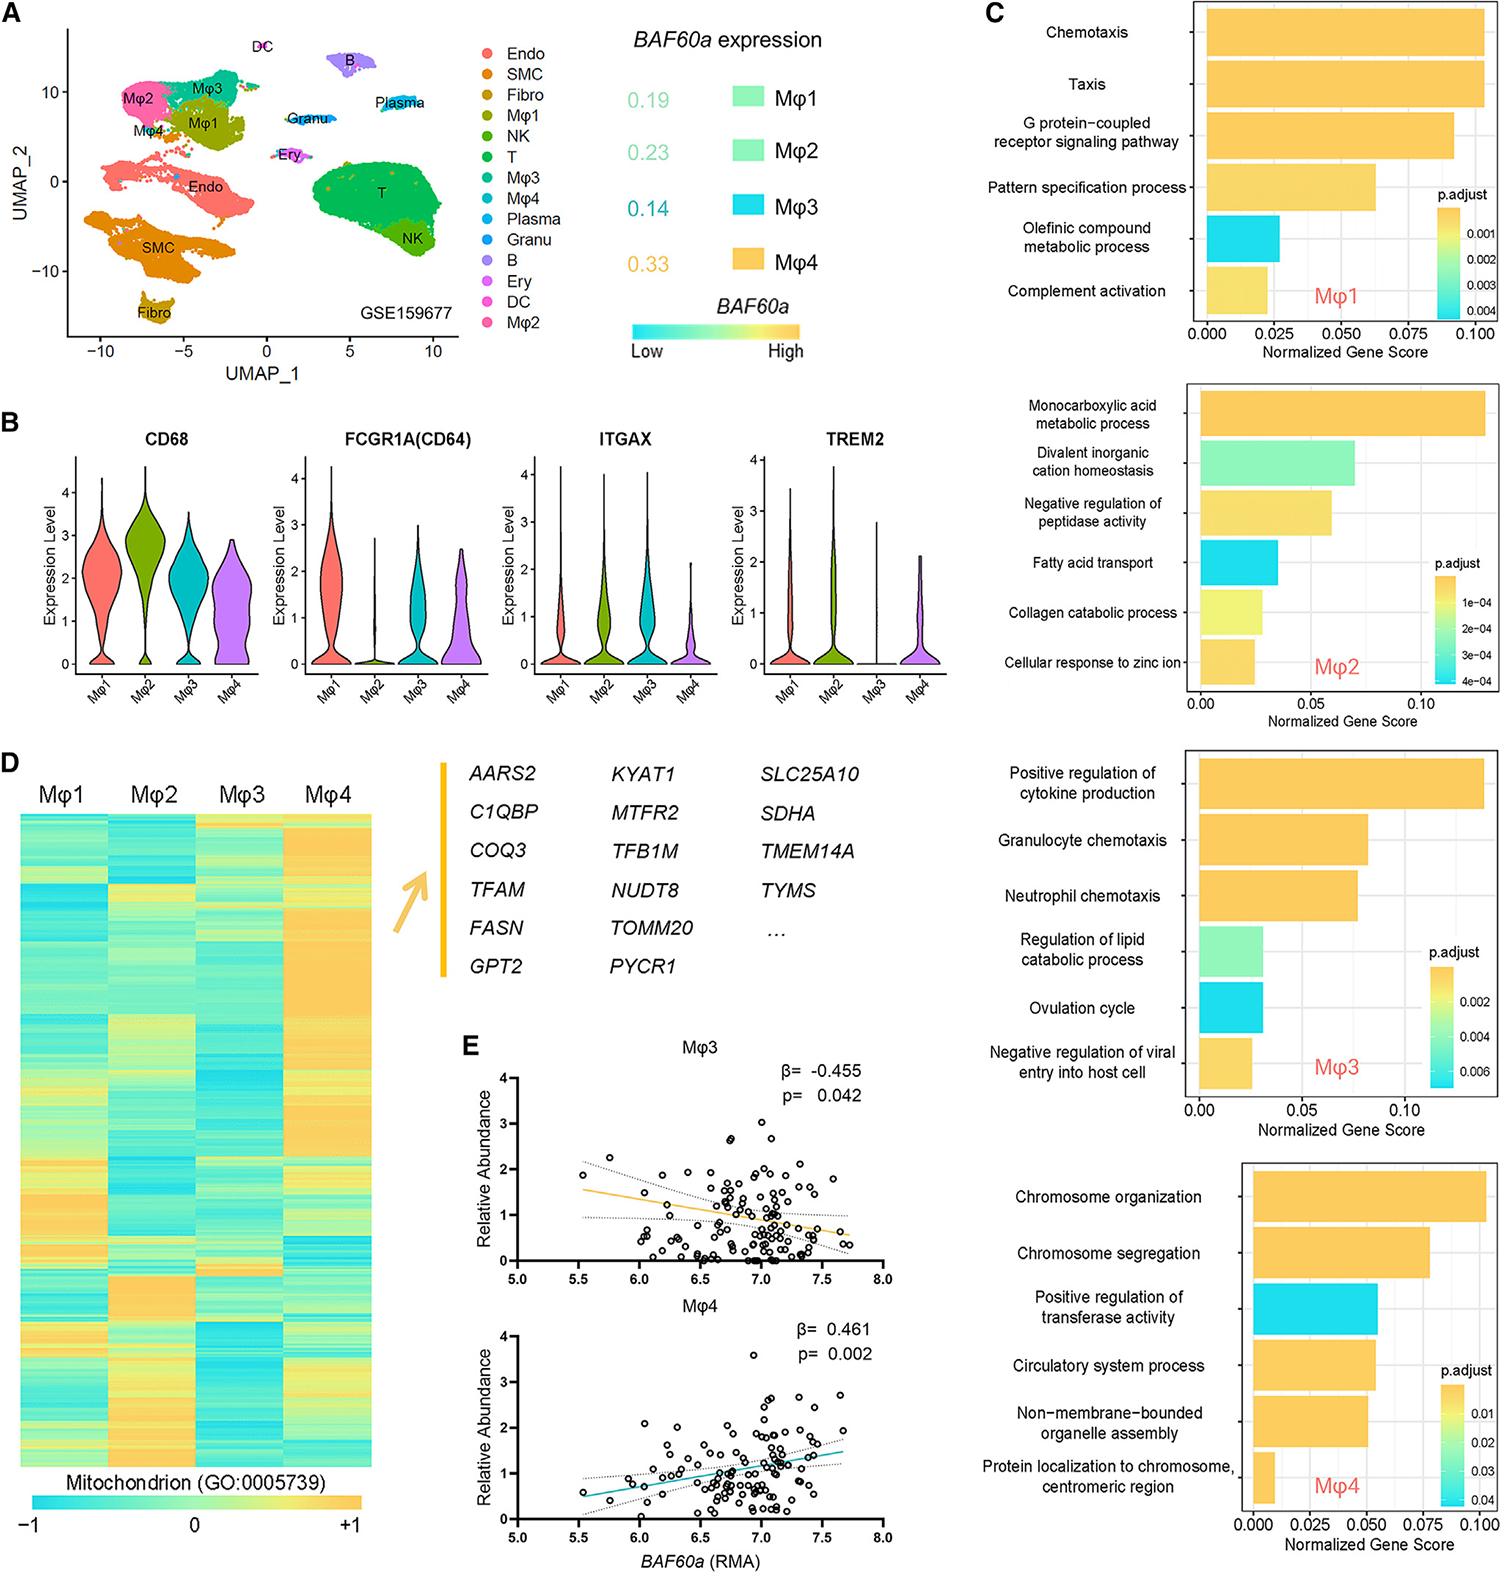
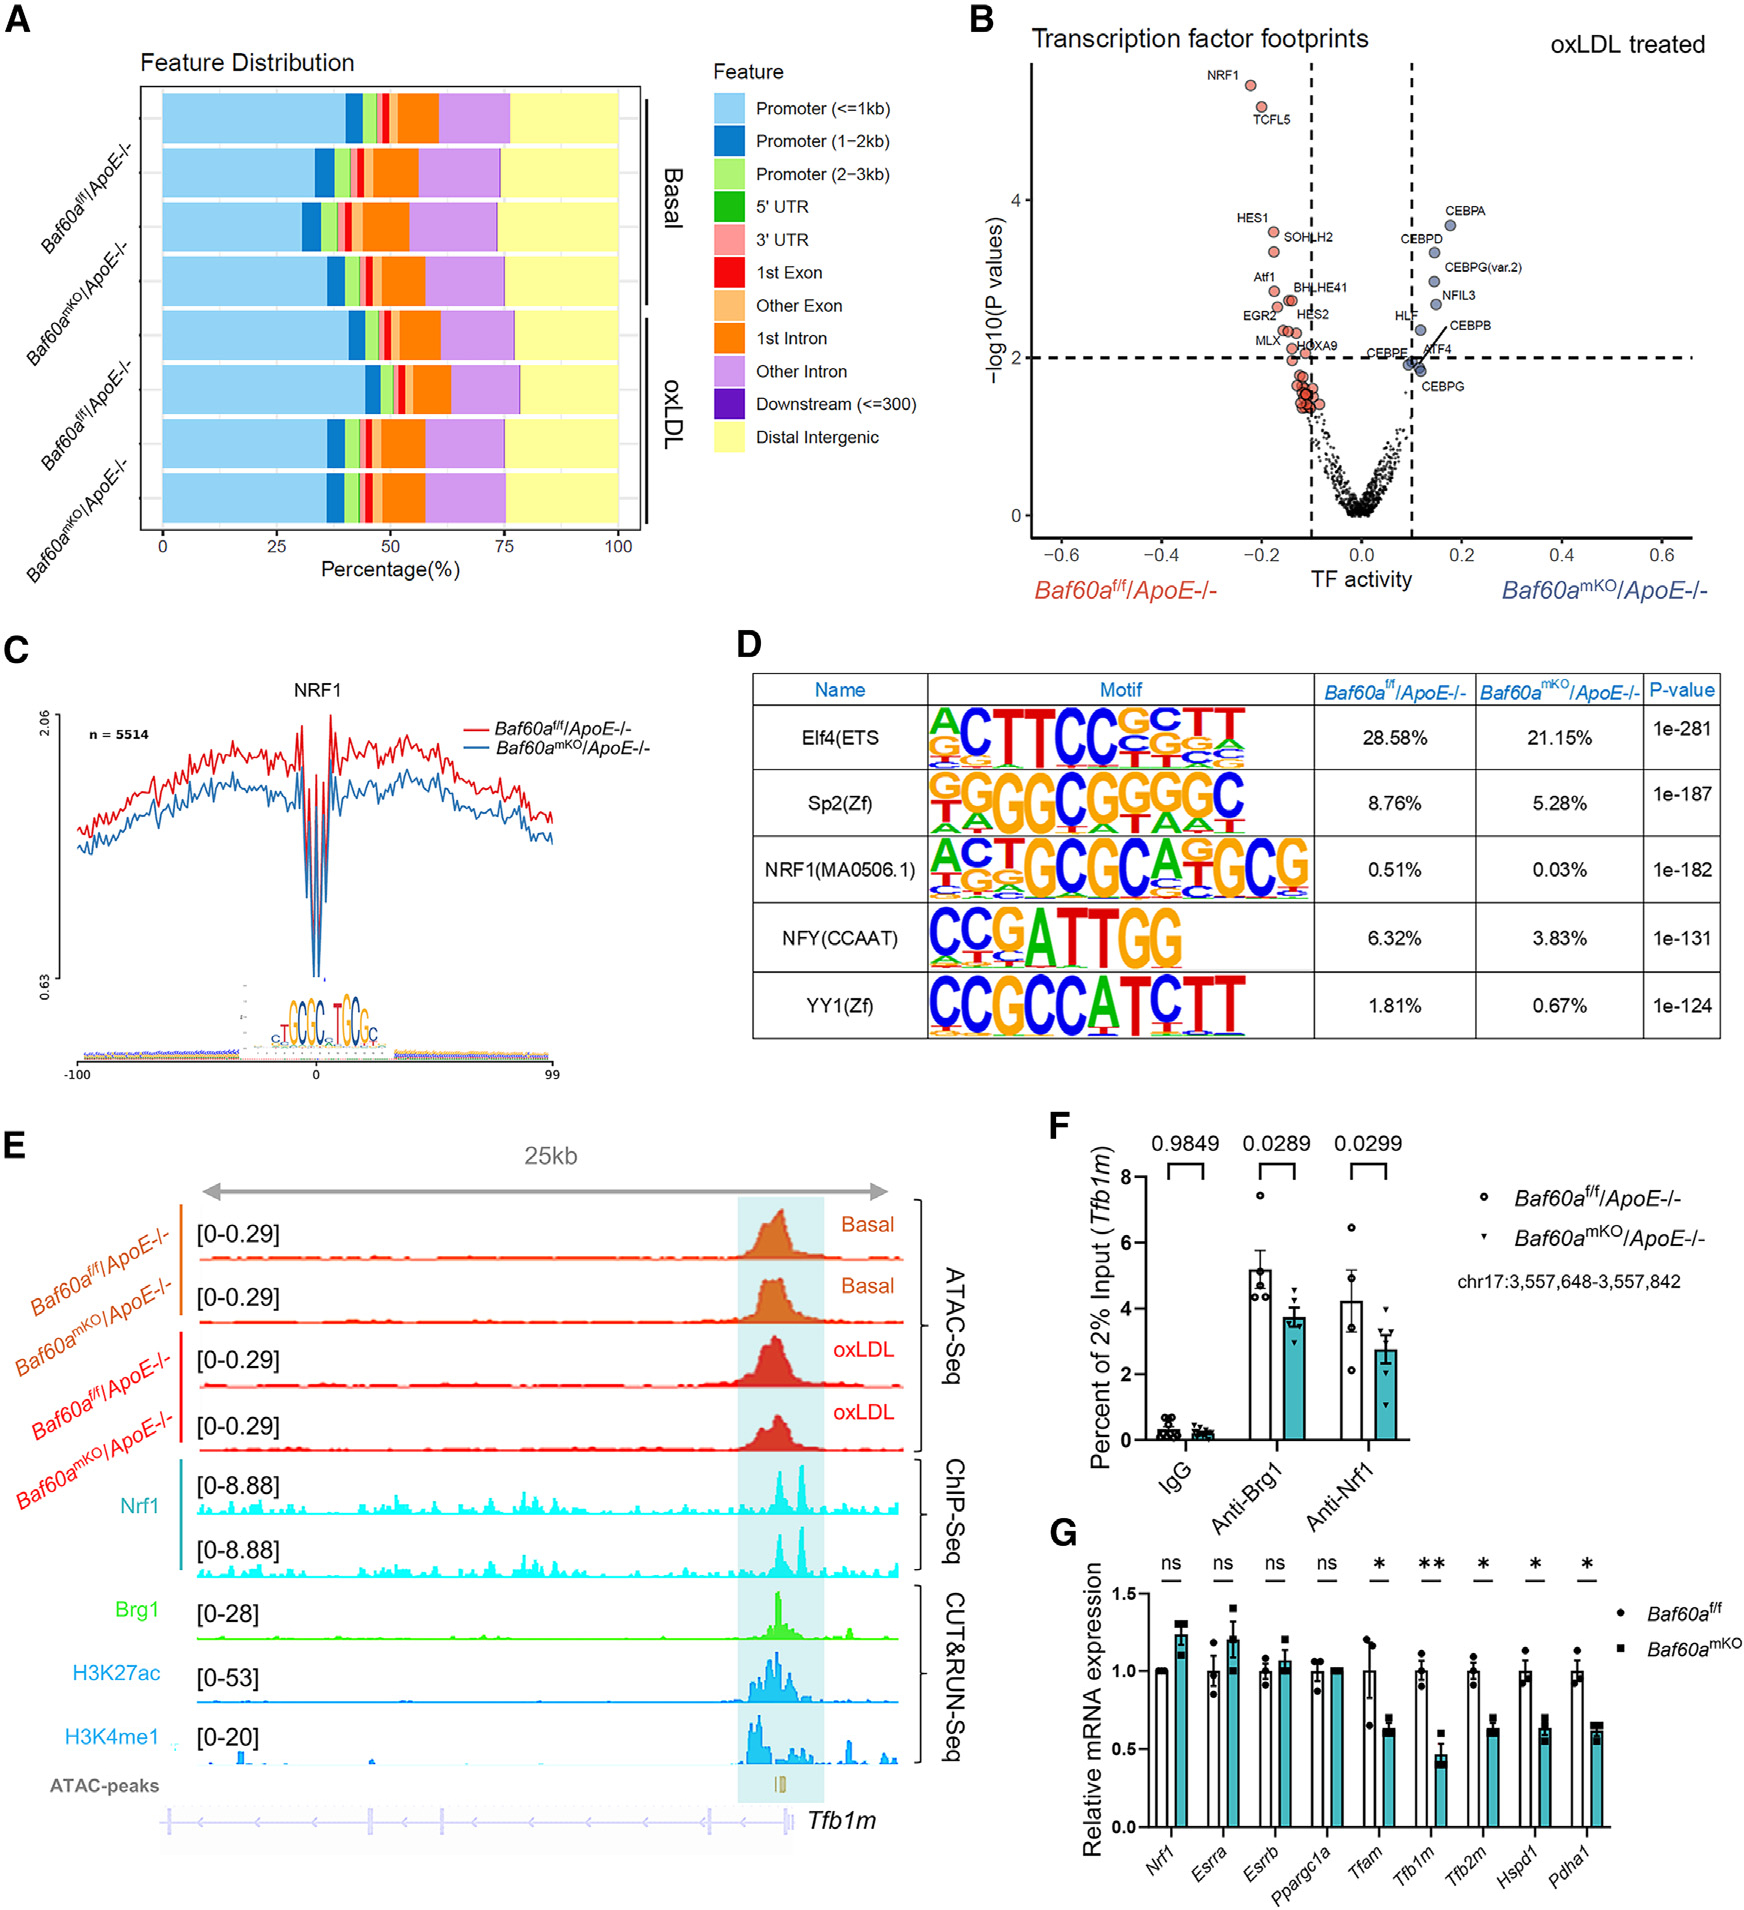
Atherosclerosis, a leading health concern, stems from the dynamic involvement of immune cells in vascular plaques. Despite its significance, the interplay between chromatin remodeling and transcriptional regulation in plaque macrophages is understudied. We discovered the reduced expression of Baf60a, a component of the switch/sucrose non-fermentable (SWI/SNF) chromatin remodeling complex, in macrophages from advanced plaques. Myeloid-specific Baf60a deletion compromised mitochondrial integrity and heightened adhesion, apoptosis, and plaque development. BAF60a preserves mitochondrial energy homeostasis under pro-atherogenic stimuli by retaining nuclear respiratory factor 1 (NRF1) accessibility at critical genes. Overexpression of BAF60a rescued mitochondrial dysfunction in an NRF1-dependent manner. This study illuminates the BAF60a-NRF1 axis as a mitochondrial function modulator in atherosclerosis, proposing the rejuvenation of perturbed chromatin remodeling machinery as a potential therapeutic target.

Keywords: CP: Metabolism; CP: Molecular biology; SWI/SNF; atherosclerosis; chromatin remodeling; macrophage; mitochondria.


Conflict of interest statement

Declaration of interests The authors declare no competing interests.

Figures

Figure 1.
Figure 1.. Downregulation of Baf60a in advanced atherosclerotic plaque macrophages exacerbates atherosclerosis in ApoE−/− hypercholesterolemic mice
(A) FACS isolation of single aortic cells from atherosclerotic ApoE−/− mice at 8 or 16 weeks post WD feeding. (B) qPCR measurement of mRNA abundance for Baf60a, Baf60b, and Baf60c. Each data point represents pooled samples from three mice (n = 4). (C and D) (C) Immunoblotting and (D) quantification of BAF60a, BAF60b, BAF155, BRD9, and β-actin protein abundance in BMDMs isolated from Baf60amKO and Baf60af/f mice (n = 7; membranes were reused in Figure S4A). (E–J) Male Baf60af/f/ApoE−/− and Baf60amKO/ApoE−/− mice were fed a WD for 16 weeks (n = 13–15 per group). (E) En-face ORO staining of the aortic tree. (F) H&E, ORO, and PSR staining of the aortic root. Scale bars, 200 μm. (G) Quantification of en-face ORO staining of the aortic tree. (H) H&E staining of the aortic root followed by quantification of lesion and necrotic core area. (I) Quantification of ORO-positive aortic root area. (J) Quantification of PSR-positive fibrotic region in the aortic root. Data are presented as mean ± SEM. Two-way ANOVA followed by Holm-Sidak multiple comparisons for (B) and (D); Student’s t test for (G)–(J).
Figure 2.
Figure 2.. Myeloid Baf60a deletion induces vascular immune cell recruitment
Male Baf60amKO/ApoE−/− and Baf60af/f/ApoE−/− mice were fed a WD for 16 weeks. (A and B) Immunofluorescence staining at the aortic root region demonstrating Mac2-positive macrophage and immune cell content, followed by quantification (B). (C) FACS histogram of dynamic changes in CD45 expression during 7 days of BMDM differentiation. (D) RNA-seq of BMDM from Baf60amKO and Baf60af/f mice (n = 4) followed by GSEA. (E) Heatmap of adhesion-related gene expression from (D). (F) qPCR of the adhesion-related genes in CD11b-positive PBMCs from Baf60amKO or Baf60af/f mice (n = 6). (G) qPCR of the adhesion-related genes from THP-1 cells transfected with siNT or siBAF60a at 72 h post transfection (n = 4). (H) Representative figures of Calcein AM-stained THP-1 cell attached to TNF-α-activated HAECs. Scale bar, 100 μm. Data are presented as mean ± SEM. Student’s t test for (B), (F), and (G) (left); two-way ANOVA followed by Holm-Sidak post hoc analysis for (G) (right).
Figure 3.
Figure 3.. Mitochondrial content decreased in Baf60a-deficient atherosclerotic macrophages
(A) RNA-seq of BMDMs isolated from 16-week WD feeding atherosclerotic Baf60amKO/ApoE−/− and Baf60af/f/ApoE−/− mice followed by GSEA. (B) Heatmap of OXPHOS-related gene expression from (A). (C) Upper: Seahorse measurement of OCR in Baf60amKO and Baf60af/f BMDMs treated with oxLDL (50 μg/mL, 48 h, n = 26–30 per group). Lower: Seahorse measurement of OCR in F4/80+ aortic macrophage from 16-week WD-fed Baf60amKO/ApoE−/− and Baf60af/f/ApoE−/− mice (n = 42–60 per group). (D) Quantification of basal and maximal OCR. (E) Upper: qPCR quantification of mtDNA/nDNA ratio in Baf60amKO and Baf60af/f bone marrow-derived monocytes or macrophages treated with oxLDL(50 μg/mL, 48 h, n = 8). Lower: qPCR quantification of mtDNA/nDNA ratio in FACS-sorted F4/80+ aortic macrophages and non-macrophages from 16-week WD-fed Baf60amKO/ApoE−/− and Baf60af/f/ApoE−/− mice (n = 8 per group). (F) Immunoblotting and quantification of BAF60a, PDH, mtTFA, COX IV, and β-actin protein abundance in BMDMs from Baf60amKO or Baf60af/f mice treated with oxLDL (50 μg/mL, 48 h, n = 4–7 per group). Data are presented as mean ± SEM. Two-way ANOVA followed by Holm-Sidak post hoc analysis for (D) and (F); Student’s t test for (E).
Figure 4.
Figure 4.. Atherosclerotic environmental cues link Baf60a deficiency to mitochondria dysfunction, ROS generation, and apoptosis
(A) TEM imaging of BMDMs from Baf60amKO or Baf60af/f mice treated with oxLDL (100 mg/mL, 48 h), followed by quantification of individual mitochondrion and autophagosome numbers (n = 6–7 per group). Scale bar, 800 nm. (B) Hoechst, LipidTOX, MitoSOX, and MitoTracker staining of BMDMs isolated from Baf60amKO or Baf60af/f mice and treated with oxLDL (50 μg/mL, 48 h). Scale bar, 100 μm. (C) qPCR quantification of mRNA extracted from Baf60amKO or Baf60af/f BMDMs and treated with oxLDL (50 μg/mL for 48 h, n = 4–5 per group). (D) Density plot and FACS analysis of BMDMs from Baf60amKO or Baf60af/f mice treated with oxLDL (50 μg/mL, 48 h) and stained with MitoSOX (n = 8). (E) LDH release from vehicle control or 7-KC (10 μg/mL, 24 h)-treated BMDMs isolated from either Baf60amKO or Baf60af/f mice (n = 15). (F) Dot plot and FACS analysis of BMDMs from Baf60amKO or Baf60af/f mice treated with 7-KC (10 μg/mL, 24 h) and stained with annexin V/PI to quantify apoptotic cell number (n = 5). (G) Immunofluorescence illustration of aortic sinus from 16-week WD-fed Baf60amKO/ApoE−/− and Baf60af/f/ApoE−/− mice co-stained with DAPI, Mac2, and TUNEL. Scale bar, 50 μm. Data are presented as mean ± SEM. Student’s t test for (A) and (D)–(F); two-way ANOVA followed by Holm-Sidak post hoc analysis for (C) and (E).
Figure 5.
Figure 5.. Correlation between BAF60a expression and mitochondrial gene expression in plaque macrophages from human patients
(A) UMAP (uniform manifold approximation and projection) plot of different cell types defined by human plaque scRNA-seq (GEO: GSE159677) and corresponding cluster-wise BAF60a expression. (B) Violin plot of common macrophage marker expression in Mφ1 to Mφ4 clusters. (C) Gene ontology (GO) enrichment analysis of gene expression in Mφ1 to Mφ4 clusters. (D) Heatmap of normalized mitochondria-related gene expression in Mφ1 to Mφ4 clusters. (E) Bulk plaque sequencing deconvolution using a curated single-cell signature matrix, followed by Pearson correlation analysis (n = 126).
Figure 6.
Figure 6.. BAF60a deficiency impairs NRF1 transcriptional response to atherosclerotic stress and reduces NRF1 targeted gene expression
BMDMs from Baf60amKO/ApoE−/− or Baf60af/f/ApoE−/− mice were treated with either vehicle control or oxLDL (50 μg/mL, 48 h). (A) Peak feature distribution across different chromatin regions. (B–D) ATAC-seq followed by transcription factor (TF) footprint and motif analysis (n = 2 for each condition). (B) Volcano plot of TF footprints with top differential activities. (C) NRF1 footprint within 100 bp of the seed region. (D) HOMER motif enrichment analysis of top five differentially enriched motifs based on p value. (E) Genome track view of chromatin accessibility around selected NRF1-targeted Tfb1m gene loci by Baf60amKO/ApoE−/− or Baf60af/f/ApoE−/− BMDMs ATAC-seq, Nrf1 ChIP-seq (GEO: GSE208936), and CUT&RUN-seq for Brg1, H3K27ac, and H3K4me1 (GEO: GSE192777). (F) ChIP assay of BRG1 and NRF1 binding on the peak region of Tfb1m promoter determined above. (G) qPCR quantification of potential BAF60a-interacting TF/co-factors and NRF1-regulated mitochondria genes (n = 3). Data are presented as mean ± SEM. Two-way ANOVA followed by Holm-Sidak post hoc analysis for (F) and (G). ns, none significant; *p < 0.05; **p < 0.01.
Figure 7.
Figure 7.. BAF60a interacts with NRF1, and its overexpression requires NRF1 to alleviate mitochondrial dysfunction
(A) Co-IP of the physical interaction between NRF1 and BAF60a in RAW264.1 cells overexpressing HA-NRF1, with immunoglobulin G (IgG) as a negative control. (B) Immunoblotting of RAW264.7 cells co-transfected with siNT/siBaf60a and pcDNA/NRF1 for 48 h followed by treatment of either control or oxLDL (50 μg/mL, 24 h). (C) Quantification of mitochondrial-related protein changes in response to NRF1 overexpression in (B) (n = 4). (D) BMDMs from Baf60amKO mice were infected with either AdLacZ or AdBAF60a and transfected with vehicle, siBrg1, or siNrf1 for 48 h before treatment with oxLDL (50 μg/mL, 48 h). qPCR was performed to quantify Nrf1-regulated gene expression (n = 3). (E) mtDNA-to-nDNA ratio quantified by qPCR. Left: BMDMs from Baf60amKO mice were infected with either AdLacZ or AdBAF60a for 24 h and treated with oxLDL (50 μg/mL, 48 h, n = 5). Right: RAW264.7 cells were co-transfected with siNT/siBaf60a and pcDNA/Nrf1 for 48 h and treated by either control or oxLDL (50 μg/mL, 24 h, n = 10). (F) Schematic model of BAF60a regulation of plaque macrophage and mitochondria homeostasis in atherosclerosis. Data are presented as mean ± SEM. Student’s t test for (C) and (E) (left); ordinary one-way ANOVA by Tukey’s post hoc analysis for (E) (right); two-way ANOVA followed by Holm-Sidak post hoc analysis for (D). ns, none significant; *p < 0.05; **p < 0.01; ***p < 0.001; ****p < 0.0001.

Similar articles

Cited by

References

    1. Björkegren JLM, and Lusis AJ (2022). Atherosclerosis: Recent developments. Cell 185, 1630–1645. 10.1016/j.cell.2022.04.004. - DOI - PMC - PubMed
    1. Libby P (2021). The biology of atherosclerosis comes full circle: lessons for conquering cardiovascular disease. Nat. Rev. Cardiol. 18, 683–684. 10.1038/s41569-021-00609-1. - DOI - PubMed
    1. Banach M, and Penson PE (2021). Lipid-lowering therapies: Better together. Atherosclerosis 320, 86–88. 10.1016/j.atherosclerosis.2021.01.009. - DOI - PubMed
    1. Vincent J (2018). Lipid Lowering Therapy for Atherosclerotic Cardiovascular Disease: It Is Not So Simple. Clin. Pharmacol. Ther. 104, 220–224. 10.1002/cpt.1138. - DOI - PubMed
    1. Lorenzatti AJ (2021). Anti-inflammatory Treatment and Cardiovascular Outcomes: Results of Clinical Trials. Eur. Cardiol. 16, e15. 10.15420/ecr.2020.51. - DOI - PMC - PubMed

Publication types

Substances