. 2023 Sep 15;15(9):1933.
doi: 10.3390/v15091933.

Unraveling the Dynamics of Omicron (BA.1, BA.2, and BA.5) Waves and Emergence of the Deltacton Variant: Genomic Epidemiology of the SARS-CoV-2 Epidemic in Cyprus (Oct 2021-Oct 2022)

Affiliations

Unraveling the Dynamics of Omicron (BA.1, BA.2, and BA.5) Waves and Emergence of the Deltacton Variant: Genomic Epidemiology of the SARS-CoV-2 Epidemic in Cyprus (Oct 2021-Oct 2022)

Andreas C Chrysostomou et al. Viruses. .

Abstract

Commencing in December 2019 with the emergence of severe acute respiratory syndrome coronavirus 2 (SARS-CoV-2), three years of the coronavirus disease 2019 (COVID-19) pandemic have transpired. The virus has consistently demonstrated a tendency for evolutionary adaptation, resulting in mutations that impact both immune evasion and transmissibility. This ongoing process has led to successive waves of infections. This study offers a comprehensive assessment spanning genetic, phylogenetic, phylodynamic, and phylogeographic dimensions, focused on the trajectory of the SARS-CoV-2 epidemic in Cyprus. Based on a dataset comprising 4700 viral genomic sequences obtained from affected individuals between October 2021 and October 2022, our analysis is presented. Over this timeframe, a total of 167 distinct lineages and sublineages emerged, including variants such as Delta and Omicron (1, 2, and 5). Notably, during the fifth wave of infections, Omicron subvariants 1 and 2 gained prominence, followed by the ascendancy of Omicron 5 in the subsequent sixth wave. Additionally, during the fifth wave (December 2021-January 2022), a unique set of Delta sequences with genetic mutations associated with Omicron variant 1, dubbed "Deltacron", was identified. The emergence of this phenomenon initially evoked skepticism, characterized by concerns primarily centered around contamination or coinfection as plausible etiological contributors. These hypotheses were predominantly disseminated through unsubstantiated assertions within the realms of social and mass media, lacking concurrent scientific evidence to validate their claims. Nevertheless, the exhaustive molecular analyses presented in this study have demonstrated that such occurrences would likely lead to a frameshift mutation-a genetic aberration conspicuously absent in our provided sequences. This substantiates the accuracy of our initial assertion while refuting contamination or coinfection as potential etiologies. Comparable observations on a global scale dispelled doubt, eventually leading to the recognition of Delta-Omicron variants by the scientific community and their subsequent monitoring by the World Health Organization (WHO). As our investigation delved deeper into the intricate dynamics of the SARS-CoV-2 epidemic in Cyprus, a discernible pattern emerged, highlighting the major role of international connections in shaping the virus's local trajectory. Notably, the United States and the United Kingdom were the central conduits governing the entry and exit of the virus to and from Cyprus. Moreover, notable migratory routes included nations such as Greece, South Korea, France, Germany, Brazil, Spain, Australia, Denmark, Sweden, and Italy. These empirical findings underscore that the spread of SARS-CoV-2 within Cyprus was markedly influenced by the influx of new, highly transmissible variants, triggering successive waves of infection. This investigation elucidates the emergence of new waves of infection subsequent to the advent of highly contagious and transmissible viral variants, notably characterized by an abundance of mutations localized within the spike protein. Notably, this discovery decisively contradicts the hitherto hypothesis of seasonal fluctuations in the virus's epidemiological dynamics. This study emphasizes the importance of meticulously examining molecular genetics alongside virus migration patterns within a specific region. Past experiences also emphasize the substantial evolutionary potential of viruses such as SARS-CoV-2, underscoring the need for sustained vigilance. However, as the pandemic's dynamics continue to evolve, a balanced approach between caution and resilience becomes paramount. This ethos encourages an approach founded on informed prudence and self-preservation, guided by public health authorities, rather than enduring apprehension. Such an approach empowers societies to adapt and progress, fostering a poised confidence rooted in well-founded adaptation.

Keywords: COVID-19; Cyprus; SARS-CoV-2; genomic epidemiology.


Conflict of interest statement

The authors declare no conflict of interest.

Figures
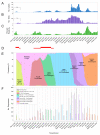
Figure 1
Figure 1
This study encompasses an extensive analysis of SARS-CoV-2 cases, testing, percent positivity, and dominant lineages in Cyprus spanning from March 2020 to October 2022. Specifically, the current investigation is focused on the timeframe from October 2021 to October 2022, while our prior research encompassed the period between April 2020 and October 2021 [24,25]. The inclusion of the previous timeframes serves the purpose of maintaining continuity and illustrating the evolution of SARS-CoV-2 infections in Cyprus. Importantly, there is no overlap in data collection between the earlier studies and the present one. (A) Depicts the weekly count of positive SARS-CoV-2 cases. Dark blue columns represent the number of positive cases, with values beneath the black bracket (covering the period from 1 March 2020 to 17 May 2020) being multiplied by 10 for enhanced visibility. (B) Presents the total number of SARS-CoV-2 tests, encompassing PCR and rapid tests, conducted weekly in Cyprus. Purple columns represent the test count, with values beneath the black bracket (covering the period from 1 March 2020 to 17 May 2020) being multiplied by 5 for enhanced visibility. (C) Illustrates the calculated percent positivity of SARS-CoV-2 testing weekly. The green columns represent the percent positivity values. (D) Highlights periods of lockdown and partial lockdown in Cyprus. Red-filled horizontal rectangles indicate full lockdown periods, while horizontal rectangles with diagonal red lines denote partial lockdowns. The initial lockdown occurred from 24 March 2020 to 3 May 2020, and the second lockdown occurred from 10 January 2021 to 9 May 2021. The first partial lockdown spanned from 4 May 2020 to 20 May 2020; the second from 23 October 2020 to 9 January 2021; and the third from 10 May 2021 to 10 June 2021 (information sourced from the Ministry of Health). Brackets underneath (AC) group weeks into approximately 1-month periods. (E,F) Depicts the frequency (proportion) and the number of sequences for the most prevalent lineages in Cyprus per month, respectively. Specifically, the sequences for lineages B.1.1.29 (parental lineage B.1.1), B.1.258 and sublineages, Alpha (B.1.1.7 and Q. sublineages), Delta (B.1.617.2 and AY. sublineages), Omicron 1 (BA.1 and sublineages), Omicron 2 (BA.2 and sublineages), and Omicron 5 (BA.5 and sublineages) are represented in bright green, red, green, light blue, purple, lilac, and orange, respectively. The numbers of sequences categorized under “Remaining Lineages” are displayed in pink, calculated by excluding the monthly sequences of lineages B.1.1.29 (parental lineage B.1.1), B.1.258 and sublineages, Alpha (B.1.1.7 and Q. sublineages), Delta (B.1.617.2 and AY. sublineages), Omicron 1 (BA.1 and sublineages), Omicron 2 (BA.2 and sublineages), and Omicron 5 (BA.5 and sublineages) from the total number of sequences indicated in gray. Recombinant lineages such as XL (recombination of BA.1 and BA.2) and XAL (recombination of BA.1.1 and BA.2), as well as Omicron (BA.4 and sublineages), were classified under “Remaining Lineages” due to their limited representation in the dataset. No available sequencing data were provided for March 2020.
Figure 2
Figure 2
This figure provides an overview of the progression and waves of SARS-CoV-2 in Cyprus, spanning from March 2020 to October 2022. To facilitate continuity and illustrate the evolution of SARS-CoV-2 infections in Cyprus, data from our previous studies conducted between April 2020 and October 2021 [24,25] were integrated. The number of positive SARS-CoV-2 cases reported monthly in Cyprus from March 2020 to October 2022 is depicted. The representation is scaled proportionally to the prevalence of SARS-CoV-2 variants, as indicated in Figure 1A,E,F. The sequences of various lineages, including B.1.1.29 (parental lineage B.1.1), B.1.258 and sublineages, Alpha (B.1.1.7 and Q. sublineages), Delta (B.1.617.2 and AY. sublineages), Omicron 1 (BA.1 and sublineages), Omicron 2 (BA.2 and sublineages), Omicron 5 (BA.5 and sublineages), and remaining lineages, are represented in a smoothed line chart. These lineages are differentiated by colors: bright green, red, green, light blue, purple, lilac, orange, and pink, respectively. The values beneath the black bracket, denoting the period from March 2020 to May 2020, have been multiplied by 20 to enhance their visibility.
Figure 3
Figure 3
The figure effectively illustrates the significant S protein mutations within these prominent SARS-CoV-2 lineages during the specified period, shedding light on the molecular characteristics of the virus during the 5th and 6th waves in Cyprus. These mutations were identified through the analysis of Cypriot SARS-CoV-2 sequences collected between October 2021 and October 2022. Specifically, the figure focuses on the most common S protein mutations found in Omicron 1 (BA.1, BA.1.1), Omicron 2 (BA.2), and Omicron 5 (BA.5.1, BA.5.2) lineages. A colored cylinder represents the essential domains of the SARS-CoV-2 S protein (GenBank: MN908947.3), including the N-terminal domain (NTD); the receptor-binding domain (RBD), highlighted in red; the receptor-binding motif (RBM) in yellow; subdomains 1 and 2 (SD1 and SD2); fusion peptide (FP); subunit 1 (S1) in blue; subunit 2 (S2) in cyan; heptad repeats (HRs); the transmembrane domain (TM) in gray; and the cytoplasmic tail (CT) in gray. Cleavage sites (S1/S2 and S2′) are marked with black arrows. The green-highlighted area corresponds to the receptor-binding domain (RBD) [42,43,44,45,46,47,48,49,50,51]. Mutations are indicated by red lines, denoting the locations of the most common mutations identified in all or nearly all sequences within a given lineage. The figure also provides information on the total number of sequences analyzed for each lineage in this study, displayed on the right side of the figure.
Figure 4
Figure 4
This figure effectively visualizes the evolutionary relationships and mutation patterns within these prominent SARS-CoV-2 lineages during the specified time frame, providing valuable insights into the viral dynamics during the 5th and 6th waves in Cyprus from October 2021 to October 2022. The maximum likelihood tree portrays the evolution of mutations and was generated using Nextclade (https://clades.nextstrain.org, last accessed on 31 May 2023 [27]). The analysis includes SARS-CoV-2 sequences classified as Omicron 1 (BA.1, BA.1.1), Omicron 2 (BA.2), and Omicron 5 (BA.5.1, BA.5.2). The maximum likelihood tree represents the evolutionary relationships between these lineages. Mutations that originated earlier during the pandemic are typically positioned on the left-hand side of the figure, while those that emerged or reappeared as SARS-CoV-2 evolved into new lineages are situated on the right-hand side. Highlighted in purple, lilac, and orange rectangles are the sequences of the most prevalent lineages from the 5th wave (Omicron 1-BA.1, BA.1.1, and Omicron 2-BA.2) and the 6th wave (Omicron 5-BA.5.1, BA.5.2) in Cyprus, respectively. Red dots on the tree symbolize the sequences belonging to Omicron 1 (BA.1, BA.1.1), Omicron 2 (BA.2), and Omicron 5 (BA.5.1, BA.5.2) used in this study.
Figure 5
Figure 5
Maximum likelihood phylogenic tree of the 450 representative Cypriot SARS-CoV-2 genomes classified as Omicron 1 (BA.1, BA.1.1), 2 (BA.2), and 5 (BA.5.1, BA.5.2). The sequences of the most prevalent lineages of the fifth wave Omicron 1 (BA.1, BA.1.1) and 2 (BA.2), as well as the sixth wave Omicron 5 (BA.5.1, BA.5.2), are highlighted in purple, lilac, and orange, respectively.
Figure 6
Figure 6
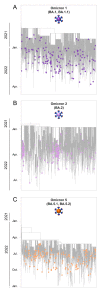
Time-scaled migration history for the datasets used for reconstructing the history of the spread of (A) Omicron 1 (BA.1 and BA.1.1, purple circles), (B) Omicron 2 (BA.2, lilac circles), and (C) Omicron 5 (BA.5.1 and BA.5.2, orange circles). Gray tips represent reference sequences downloaded from GISAID (accessed on 12 February 2023) [70].
Figure 7
Figure 7
Map of SARS-CoV-2 Omicron 1 (BA.1, BA.1.1) transmission between Cyprus and other countries. The geographic origins of SARS-CoV-2 Omicron 1 (BA.1, BA.1.1) imported into Cyprus are depicted with red lines; exports from Cyprus to other countries are depicted with yellow lines. Countries acting as “sources” or “sinks” for SARS-CoV-2 Omicron 1 (BA.1, BA.1.1) transmission are highlighted and labeled, and the estimated average number of migration events is indicated. In southern Europe, the highlighted countries are Bosnia and Herzegovina, North Macedonia, Serbia, Portugal, Slovenia, and Greece. In Western Asia, the highlighted countries are Turkey and the United Arab Emirates. In South-Eastern Asia, the highlighted countries are Indonesia, Singapore, Thailand, the Philippines, and Malaysia. In Oceania, the highlighted countries are Australia, the Northern Mariana Islands, and Guam. To enhance the clarity of the figure, only the locations with the five highest estimated total average numbers of importation or exportation events are displayed (Table 2). Map images courtesy of Google Earth Pro 7.3.2.5776 and 7.3.4.8642 (14 December 2015). Global view centered on North and South America (left), 5°49′53.21″ N 81°12′52.44″ W, Eye alt 9503.85 km. Europe (middle), 36°16′38.78″ N 36°07′29.71″ E, Eye alt 7949.12 km. South-Eastern Asia and Oceania (right), 1°14′19.88″ N 112°15′56.16″ E, Eye alt 11,201.60 km. US Dept. of State Geographer, DATA SIO, NOAA, U.S. Navy, NGA, and GEBCO. Image Landsat/Copernicus. 2018 and 2023 © Google. https://www.google.com/earth/versions/#earth-pro (accessed on 10 April 2019 and 16 July 2023).
Figure 8
Figure 8
Map of SARS-CoV-2 Omicron 2 (BA.2) transmission between Cyprus and other countries. The geographic origins of SARS-CoV-2 Omicron 2 (BA.2) imported into Cyprus are depicted with red lines; exports from Cyprus to other countries are depicted with yellow lines. Countries acting as “sources” or “sinks” for SARS-CoV-2 Omicron 2 (BA.2) transmission are highlighted and labeled, and the estimated average number of migration events is indicated. In Western Europe, the highlighted countries are Luxembourg, Belgium, and the Netherlands. In Western Asia, the highlighted countries are Bahrain, Turkey, and Israel. To enhance the clarity of the figure, only the locations with the five highest estimated total average numbers of importation or exportation events are displayed (Table 2). Map images courtesy of Google Earth Pro 7.3.2.5776 and 7.3.4.8642 (14 December 2015). Global view centered on North and South America (left), 5°49′53.21″ N 81°12′52.44″ W, Eye alt 9503.85 km. Europe (middle), 36°16′38.78″ N 36°07′29.71″ E, Eye alt 7949.12 km. South-Eastern Asia and Oceania (right), 1°14′19.88″ N 112°15′56.16″ E, Eye alt 11,201.60 km. US Dept. of State Geographer, DATA SIO, NOAA, U.S. Navy, NGA, and GEBCO. Image Landsat/Copernicus. 2018 and 2023 © Google. https://www.google.com/earth/versions/#earth-pro (accessed on 10 April 2019 and 16 July 2023).
Figure 9
Figure 9
Map of SARS-CoV-2 Omicron 5 (BA.5.1, BA.5.2) transmission between Cyprus and other countries. The geographic origins of SARS-CoV-2 Omicron 5 (BA.5.1, BA.5.2) imported into Cyprus are depicted with red lines; exports from Cyprus to other countries are depicted with yellow lines. Countries acting as “sources” or “sinks” for SARS-CoV-2 Omicron 5 (BA.5.1, BA.5.2) transmission are highlighted and labeled, and the estimated average number of migration events is indicated. To enhance the clarity of the figure, only the locations with the five highest estimated total average numbers of importation or exportation events are displayed (Table 2). Map images courtesy of Google Earth Pro 7.3.2.5776 and 7.3.4.8642 (14 December 2015). Global view centered on North and South America (left), 5°49′53.21″ N 81°12′52.44″ W, Eye alt 9503.85 km. Europe (right), 36°16′38.78″ N 36°07′29.71″ E, Eye alt 7949.12 km. US Dept. of State Geographer, DATA SIO, NOAA, U.S. Navy, NGA, and GEBCO. Image Landsat/Copernicus. 2018 and 2023 © Google. https://www.google.com/earth/versions/#earth-pro (accessed on 10 April 2019 and 16 July 2023).
Figure 10
Figure 10
This visual representation effectively conveys the temporal patterns of SARS-CoV-2 import and export activities involving Cyprus, offering insights into the dynamics of viral transmission and movement during the period under consideration. Each column in the graph corresponds to one week, with the width indicating the duration of that week and the height of each column representing the mean estimated total number of migration events (to or from Cyprus) occurring during that specific week. Exports from Cyprus are depicted in gray columns, while imports into Cyprus are shown in black columns. The y-axis represents the number of import/export events per week, quantifying the flow of SARS-CoV-2 to and from Cyprus. The x-axis represents time, showcasing the progression of weeks over the specified period.

Similar articles

Cited by

References

    1. Rabi F.A., Al Zoubi M.S., Al-Nasser A.D., Kasasbeh G.A., Salameh D.M. Sars-cov-2 and coronavirus disease 2019: What we know so far. Pathogens. 2020;9:231. doi: 10.3390/pathogens9030231. - DOI - PMC - PubMed
    1. Nicola M., Alsafi Z., Sohrabi C., Kerwan A., Al-Jabir A., Iosifidis C., Agha M., Agha R. The socio-economic implications of the coronavirus pandemic (COVID-19): A review. Int. J. Surg. 2020;78:185–193. doi: 10.1016/j.ijsu.2020.04.018. - DOI - PMC - PubMed
    1. Dong E., Du H., Gardner L. An interactive web-based dashboard to track COVID-19 in real time. Lancet Infect. Dis. 2020;20:533–534. doi: 10.1016/S1473-3099(20)30120-1. - DOI - PMC - PubMed
    1. Center for Systems Science and Engineering (CSSE) at Johns Hopkins University (JHU). COVID-19 Dashboard. [(accessed on 15 August 2023)]. Available online: https://gisanddata.maps.arcgis.com/apps/dashboards/bda7594740fd402994234....
    1. The World Health Organization (WHO) Tracking SARS-CoV-2 Variants. [(accessed on 3 May 2023)]. Available online: https://www.who.int/activities/tracking-SARS-CoV-2-variants.

Publication types

Supplementary concepts