. 2023 Sep 16;12(9):1770.
doi: 10.3390/antiox12091770.

Uncovering the Early Events Associated with Oligomeric Aβ-Induced Src Activation

Affiliations

Uncovering the Early Events Associated with Oligomeric Aβ-Induced Src Activation

Sandra I Mota et al. Antioxidants (Basel). .

Abstract

Soluble Aβ1-42 oligomers (AβO) are formed in the early stages of Alzheimer's disease (AD) and were previously shown to trigger enhanced Ca2+ levels and mitochondrial dysfunction via the activation of N-methyl-D-aspartate receptors (NMDAR). Src kinase is a ubiquitous redox-sensitive non-receptor tyrosine kinase involved in the regulation of several cellular processes, which was demonstrated to have a reciprocal interaction towards NMDAR activation. However, little is known about the early-stage mechanisms associated with AβO-induced neurodysfunction involving Src. Thus, in this work, we analysed the influence of brief exposure to oligomeric Aβ1-42 on Src activation and related mechanisms involving mitochondria and redox changes in mature primary rat hippocampal neurons. Data show that brief exposure to AβO induce H2O2-dependent Src activation involving different cellular events, including NMDAR activation and mediated intracellular Ca2+ rise, enhanced cytosolic and subsequent mitochondrial H2O2 levels, accompanied by mild mitochondrial fragmentation. Interestingly, these effects were prevented by Src inhibition, suggesting a feedforward modulation. The current study supports a relevant role for Src kinase activation in promoting the loss of postsynaptic glutamatergic synapse homeostasis involving cytosolic and mitochondrial ROS generation after brief exposure to AβO. Therefore, restoring Src activity can constitute a protective strategy for mitochondria and related hippocampal glutamatergic synapses.

Keywords: Alzheimer’s disease; NMDA receptor; Src tyrosine kinase; mitochondrial dysfunction; mitochondrial morphology.


Conflict of interest statement

The authors declare no competing financial interests or any conflicts of interest.

Figures

Figure 1
Figure 1
Src total and phosphorylated protein levels in mature hippocampal neurons after exposure to AβO. Hippocampal mature neurons (17 DIV) were incubated with 1 μM AβO for 5, 10 and 30 min in (A), and the levels of P(Tyr416)Src/Src (Ai,Bi,Ci), Src/actin (Aii,Bii,Cii) and P(Tyr416)Src/actin (Aiii,Biii,Ciii) were evaluated using Western blotting. The effects of SU6656 (5 μM) and MK-801 (10 μM) in (B), as well as NAC (1 mM) and GSH-EE (0.1 mM) in (C), were evaluated in cells exposed to AβO (1 μM), for 30 min. Data are expressed in arbitrary units as the mean ± SEM of n = 3 to 10 experiments. Statistical analysis: * p < 0.05 and ** p < 0.01 vs. control (Kruskal-Wallis followed by Dunn’s post hoc test).
Figure 2
Figure 2
Intracellular Ca2+ levels after acute treatment with AβO in mature hippocampal neurons. Basal Ca2+i levels were recorded for 2 min in mature hippocampal neurons (17 DIV), and the effect of AβO (1 μM) was recorded for a further 5 min. The effect of AβO was calculated by analysing the Fura-2 fluorescence ratio at 340/380 nm. The effect of the reverse peptide AβO42–1 (1 μM) was evaluated in (A). The effects of SU6656 (5 μM) and MK-801 (10 μM) were analysed in (B). The influence of antioxidants GSH-EE (0.1 mM), NAC (1 mM) and Mitotempo (MT; 1 μM) was evaluated in (C). Results were plotted as the difference between the last and the first values achieved before and after the addition of AβO. Graphic (D) is the representative line chart (normalised to baseline). Data are expressed as the mean ± SEM of n = 3 to 10 experiments, run in triplicates. Statistical analysis: * p < 0.05 and ** p < 0.01 vs. control (Kruskal-Wallis followed by Dunn’s post hoc test), t p < 0.05 (Mann-Whitney).
Figure 3
Figure 3
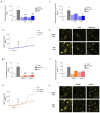
H2O2 levels following AβO stimulus in mature hippocampal neurons. Cellular H2O2 levels were evaluated by monitoring the fluorescence of resorufin. Basal fluorescence was recorded for 3 min, while the effect of AβO (1 μM) was recorded for 30 min (Aii,Bii). The effect of the reverse peptide Aβ42–1 (1 μM) was evaluated in (Ai,ii). The influence of NAC (1 mM), GSH-EE (0.1 mM) and Mitotempo (1 μM) or the effect of SU6656 (5 μM) and MK-801 (10 μM) were evaluated in (Bi,ii) in neurons exposed to AβO. In graphics (i), results were plotted as the difference between the last value achieved and the basal value before AβO addition, relative to the control. Graphics (ii) are the representative line charts (normalised to baseline). Data are expressed as the mean ± SEM of n = 3 to 10 experiments, run in quadruplicates. Statistical analysis: *** p < 0.001 or **** p < 0.0001 vs. control, $ p < 0.05, $$ p < 0.01 and $$$ p < 0.001 vs. AβO (Kruskal-Wallis followed by Dunn’s post hoc test).
Figure 4
Figure 4
Mitochondrial H2O2 levels following AβO exposure in mature hippocampal neurons. (A,B) The levels of mitochondrial H2O2 were evaluated by monitoring the fluorescence of MitoPY1 (10 μM) in mature hippocampal neurons (17 DIV). Basal mitochondrial H2O2 was recorded for 15 min, and the effect of AβO (1 μM) was recorded for 30 min. The effects of Mitotempo (MT, 1 μM) and NAC (1 mM) (A) or SU6656 (5 μM) and MK-801 (10 μM) (B) were also evaluated. In graphics (i), the slope was calculated using values of RFU before and after AβO addition. Graphics (ii) slope was calculated by assessing fluorescence within neurites, only using values of RFU before and after AβO addition. (iii) Representative line charts (normalised to baseline). (iv) Fluorescence image of representative cells before and after the treatment. Scale bar: 50 μm. Data are the mean ± SEM of 20 to 100 single-cell analyses obtained from 2 to 5 independent experiments. Statistical analysis: *** p < 0.001 or **** p < 0.0001 vs. control/“no treatment” (Kruskal-Wallis followed by Dunn’s post hoc test); $$ p < 0.01 or $$$$ p < 0.0001 vs. AβO (Kruskal-Wallis followed by Dunn’s post hoc test).
Figure 5
Figure 5
Dendritic mitochondrial morphology following AβO stimulus in mature hippocampal neurons. Cells cotransfected with pDsRed2-Mito and GFP plasmids were treated with AβO for 10 min, and mitochondrial morphology was measured using a 63× objective, NA = 1.4 on a spinning disk equipped Zeiss LSM 710 inverted microscope. The effect of SU6656 (5 μM) and MK-801 (10 μM) were also evaluated. (A) shows a representative mask of mitochondria obtained using the MitoProtAnalyser macro in Fiji used to assess mitochondrial morphology parameters, namely (B) aspect ratio and (C) circularity. Data are expressed as the mean ± SEM of n = 6–10 independent experiments, considering an average of 9 neuritis per analysis. Statistical analysis: * p < 0.05, ** p < 0.01 vs. Control (Kruskal-Wallis followed by Dunn’s post hoc test).

Similar articles

References

    1. Roda A., Serra-Mir G., Montoliu-Gaya L., Tiessler L., Villegas S. Amyloid-Beta Peptide and Tau Protein Crosstalk in Alzheimer’s Disease. Neural. Regen. Res. 2022;17:1666. doi: 10.4103/1673-5374.332127. - DOI - PMC - PubMed
    1. Younes L., Albert M., Moghekar A., Soldan A., Pettigrew C., Miller M.I. Identifying Changepoints in Biomarkers During the Preclinical Phase of Alzheimer’s Disease. Front. Aging Neurosci. 2019;11:74. doi: 10.3389/fnagi.2019.00074. - DOI - PMC - PubMed
    1. Fortin D.A., Srivastava T., Soderling T.R. Structural Modulation of Dendritic Spines during Synaptic Plasticity. Neuroscientist. 2012;18:326–341. doi: 10.1177/1073858411407206. - DOI - PubMed
    1. Godoy J.A., Rios J.A., Picón-Pagès P., Herrera-Fernández V., Swaby B., Crepin G., Vicente R., Fernández-Fernández J.M., Muñoz F.J. Mitostasis, Calcium and Free Radicals in Health, Aging and Neurodegeneration. Biomolecules. 2021;11:1012. doi: 10.3390/biom11071012. - DOI - PMC - PubMed
    1. Seager R., Lee L., Henley J.M., Wilkinson K.A. Mechanisms and Roles of Mitochondrial Localisation and Dynamics in Neuronal Function. Neuronal Signal. 2020;4:NS20200008. doi: 10.1042/NS20200008. - DOI - PMC - PubMed

LinkOut - more resources