. 2023 Oct;622(7983):619-626.
doi: 10.1038/s41586-023-06585-5. Epub 2023 Sep 27.

Inhibition of fatty acid oxidation enables heart regeneration in adult mice

Affiliations

Inhibition of fatty acid oxidation enables heart regeneration in adult mice

Xiang Li et al. Nature. 2023 Oct.

Erratum in

Abstract

Postnatal maturation of cardiomyocytes is characterized by a metabolic switch from glycolysis to fatty acid oxidation, chromatin reconfiguration and exit from the cell cycle, instating a barrier for adult heart regeneration1,2. Here, to explore whether metabolic reprogramming can overcome this barrier and enable heart regeneration, we abrogate fatty acid oxidation in cardiomyocytes by inactivation of Cpt1b. We find that disablement of fatty acid oxidation in cardiomyocytes improves resistance to hypoxia and stimulates cardiomyocyte proliferation, allowing heart regeneration after ischaemia-reperfusion injury. Metabolic studies reveal profound changes in energy metabolism and accumulation of α-ketoglutarate in Cpt1b-mutant cardiomyocytes, leading to activation of the α-ketoglutarate-dependent lysine demethylase KDM5 (ref. 3). Activated KDM5 demethylates broad H3K4me3 domains in genes that drive cardiomyocyte maturation, lowering their transcription levels and shifting cardiomyocytes into a less mature state, thereby promoting proliferation. We conclude that metabolic maturation shapes the epigenetic landscape of cardiomyocytes, creating a roadblock for further cell divisions. Reversal of this process allows repair of damaged hearts.


Conflict of interest statement

The authors declare no competing interests.

Figures

Fig. 1
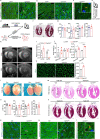
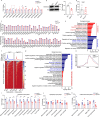
Fig. 1. Inactivation of Cpt1b induces hyperplastic and hypertrophic growth of CMs.
a, Generation of Cpt1bcKO mice. b, HW/BW ratio of 10-week-old CtrlCre and Cpt1bcKO mice (n = 5 per genotype). c, Quantification of CMs in adult CtrlCre and Cpt1bcKO hearts (n = 4 per genotype). d, EdU incorporation in PCM1+ cardiac nuclei from CtrlCre hearts (n = 7) and Cpt1bcKO hearts (n = 5) by FACS analysis. eg, Quantification of Ki67+ (e), pH3+ (f), aurora B+ (g) and sarcomeric (sarc)-actinin+ CMs on heart sections from CtrlCre and Cpt1bcKO mice (= 3 per genotype). h, Distribution of CM cross-section area (µm2) in CtrlCre and Cpt1bcKO mice (n = 3 each). i, Strategy to generate Cpt1biKO mice and experimental outline. j, HW/BW ratio of control and Cpt1biKO mice, 4 and 8 weeks (w) after TAM injection (control, 4 and 8 weeks after TAM, and Cpt1biKO, 8 weeks after TAM, n = 4 per group; Cpt1biKO, 4 weeks after TAM, n = 3). km, Quantification of Ki67+ (k), pH3+ (l), aurora B+ (m) and sarc-actinin+ CMs on heart sections from control and Cpt1biKO mice (n = 4 for k; n = 3 for l,m), 4 weeks after completion of TAM treatment. n, Quantification of CMs in control and Cpt1biKO hearts 4 weeks after TAM injection (n = 3 each). o, Quantification of CMs in Cpt1biKO hearts 4 weeks (n = 3) and 8 weeks (n = 4) after TAM injection. Error bars represent mean ± s.e.m. n numbers refer to individual mice. Two-tailed, unpaired Student t-tests were used for statistical analysis of data in bh,ko. One-way analysis of variance (ANOVA) with Tukey tests was used for correction of multiple comparisons in j. *P < 0.05, **P < 0.01, ***P < 0.001, ****P < 0.0001. Source data
Fig. 2
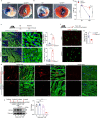
Fig. 2. Cpt1b-mediated abrogation of FAO protects from I–R damage and enables heart regeneration.
ad, Trichrome staining (a,c) and quantification of fibrosis (scar area; b,d) on heart sections from CtrlCre mice (n = 5) and Cpt1bcKO mice (n = 9) (a,b), and control mice (n = 9) and Cpt1biKO mice (n = 7) (c,d), 3 weeks after I–R injury. I–R surgery was carried out using 7-week-old (a) or 14-week-old (c) mice, 4 weeks after completion of TAM treatment. Scale bars, 300 μm. e,f, AAR (left) and infarct area (IF) of AAR (right) in CtrlCre mice (n = 6) and Cpt1bcKO mice (n = 5) (e) and in control mice (n = 4) and Cpt1biKO mice (n = 5) (f) 24 h after I–R injury. g,h, Trichrome staining (g) and quantification (h) of fibrosis on heart sections from control mice (n = 6) and Cpt1biKO mice (n = 5), 31 days after I–R injury. The I–R injury was carried out 1 day before initiation of Cpt1b deletion. Scale bars, 300 μm. i, Magnetic resonance imaging-based assessment of heart function in control and Cpt1biKO mice before and 7, 14 and 28 days after I–R surgery (before and 7 days after I–R, n = 6 each; 14 days after I–R, n = 5 each; 28 days after I–R, control n = 4, Cpt1biKO n = 5). LVEF, left ventricle ejection fraction. Asterisks representing P values in i refer to differences between individual measurements and the measurement before I–R. Asterisks representing P values above lines refer to measurements connected by the lines. Error bars represent mean ± s.e.m. n numbers refer to individual mice. Two-tailed, unpaired Student t-tests were used for statistical analysis in b,df,h. Two-way ANOVA with Tukey tests was used for correction of multiple comparisons in i. NS, not significant; *P < 0.05; **P < 0.01; ***P < 0.001; ****P < 0.0001. Source data
Fig. 3
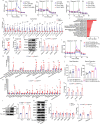
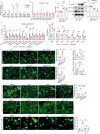
Fig. 3. Impeded mitochondrial import of fatty acid rewires the metabolism of CMs and boosts αKG levels.
a, Metabolic flux assay of CtrlCre and Cpt1bcKO hearts perfused with [13C]palmitate (n = 5 each). b, Volcano plot showing different metabolites in CtrlCre and Cpt1bcKO hearts (n = 8 each). Symbol colors indicate increased (red), decreased (blue) or unchanged (black) metabolites in Cpt1bcKO CMs. Dashed horizontal line indicates the threshold of changed metabolites with a P value of < 0.05; dashed vertical lines indicate a fold change of >2 or <0.5.  c, Quantification of metabolites associated with the Krebs cycle and glycolysis, as well as amino acids, in Cpt1bcKO hearts (pyruvate, n = 6 each; all other metabolites, n = 8 each). Dashed outline indicates the change in αKG. d,e, Quantification of BCAA catabolism-associated metabolites (n = 7 for d; n = 8 for e). KIV, α-ketoisovalerate; KMV, α-keto-β-methylvalerate. f,g, Metabolic flux assay of CtrlCre and Cpt1bcKO hearts perfused with [13C]glucose (f) or [13C]isoleucine (g) (n = 6 each). h, Western blot analysis of enzymes involved in αKG generation and catabolism (n = 3 each). Pan-actin was used as a loading control. For gel source data, see Supplementary Information. i, Enzymatic activity of OGDH in CMs from adult CtrlCre and Cpt1bcKO mice (n = 3 each). j, Comparison of Krebs cycle metabolites in CMs from control hearts (n = 6) and OgdhiKO hearts (n = 5). Dashed outline indicates the change in αKG k, Trichrome staining of heart sections from control and OgdhiKO mice, 3–4 weeks after termination of TAM treatment for Ogdh deletion. RV, right ventricle; LV, left ventricle. Scale bars, 500 μm. l, Quantification of CMs in adult control and OgdhiKO hearts (n = 3 each). mo, Quantification of Ki67+ (m), pH3+ (n), aurora B+ (o) and sarc-actinin+ CMs on heart sections from control and OgdhiKO mice (m, control n = 5; OgdhiKO n = 4; n and o, n = 4 each). Error bar represents mean ± s.e.m. n numbers refer to individual mice. Two-tailed, unpaired Student t-tests were used for statistical analysis in a,cg,i,j,lo. *P < 0.05, **P < 0.01, ***P < 0.001, ****P < 0.0001. Source data
Fig. 4
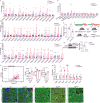
Fig. 4. Increased αKG levels induce H3K4me3 demethylation and decrease expression of CM maturity genes.
a, Western blot analysis of histone methylation modifications using FACS-isolated CM nuclei from CtrlCre and Cpt1bcKO mice (n = 3 mice each). Histone 3 (H3) was used as a loading control. For gel source data, see Supplementary Information. b, Coverage plots of H3K4me3 ChIP–seq signals within genes in three different groups categorized according to the breadth of H3K4me3 peaks in CtrlCre CMs. The 25% of genes with the broadest peaks were placed in the ‘broad’ group, the 25% of genes with the narrowest peaks were placed in the ‘narrow’ group, and the ‘medium’ group contains all other genes (25%–75%). RPM, reads per million mapped reads; TSS, transcription start site; TES, transcription end site; kb, kilobases. c, Box plots showing DESeq-normalized expression levels of genes with broad, medium and narrow H3K4me3 peaks in CtrlCre CMs. The box plot displays data from minimum to maximum, the median (centre line), 25th (bottom line) and 75th (top line) percentiles. One-way ANOVA analysis with multiple testing correction. The false discovery rate was controlled by using the two-stage step-up method of Benjamini, Krieger and Yekutieli. Broad, n = 2,387 genes; medium, n = 4,775 genes; narrow, n = 2,387 genes. d, Venn diagram showing the overlap between genes with reduced expression and genes with reduced H3K4me3 deposition in Cpt1bcKO compared to CtrlCre CMs. Distribution of overlapping peaks in the broad, medium and narrow groups is shown in the pie chart. e, Analysis of top GO terms from overlapping differentially expressed genes using the David tool (n = 3 mice each). f, Genome browser snapshots demonstrating reduced H3K4me3 deposition of representative genes associated with maturation of CMs in Cpt1bcKO CMs (normalized to mapped reads). RPKM, reads per kilobase per million mapped reads. Source data
Fig. 5
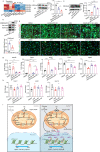
Fig. 5. Accumulation of αKG stimulates KDM5 activity, attenuates maturation and enhances proliferation of CMs.
a,b, Immunofluorescence images and quantification of Ki67 (n = 5 for a) and pH3(Ser10) (n = 3 for b) signals in cTnT+ neonatal CMs (P0–1) after 4-day culture in the presence of dimethylsulfoxide (DMSO) or (cell permeable) αKG. Top right corner, enlargement of area outlined in main image. Scale bars, 50 μm. c, GO-term enrichment of differentially expressed genes in DMSO- and αKG-treated neonatal CMs. Upregulated genes are in red, and downregulated genes are in blue. d, Western blot analysis of histone methylation modifications in P0–1 neonatal CMs treated with DMSO or αKG. H3 was used as a loading control. e, Top panels: western blot analysis of H3K4me3 in P0–1 CMs after 3-day culture in the presence of DMSO, αKG, CPI and αKG combined with CPI. H3 was used as a loading control. Lower panel: quantification of H3K4me3 levels (DMSO and αKG, n = 4 each; CPI and αKG + CPI, n = 3 each). f, Quantification of Ki67 signals in cTnT+ P0–1 CMs treated with DMSO, αKG, CPI and αKG combined with CPI (n = 6 each). g, Immunofluorescence micrographs and quantification of Ki67 signals in cTnT+ P0–1 CMs after lentiviral transduction of Kdm5b (n = 5 each). OE, overexpression. Top right corner, enlargement of area outlined in main image. Scale bars, 50 μm. h, Quantification of Ki67 signals in sarc-actinin+ neonatal CMs (P0–1), 4 days after lentiviral transduction of Kdm5b with and without αKG (DMSO, αKG, Kdm5b OE, n = 4; αKG + Kdm5b OE, n = 3). i, Quantification of Ki67 signals in sarc-actinin+ neonatal CMs (P0–1), 4 days after knockdown (KD) of Kdm5b, with and without αKG (DMSO, αKG + Kdm5b KD, Kdm5b KD, n = 4; αKG, n = 3). j, ChIP–qPCR of KDM5B in genes with broad and narrow H3K4me3 peaks in P0–1 CMs (n = 3). bp, base pairs. Error bars show mean ± s.e.m. Two-tailed, unpaired Student t-tests were used for statistical analysis in a,b,g,j. One-way ANOVA with Tukey tests was used for correction of multiple comparisons in e,f,h,i. *P < 0.05, **P < 0.01, ***P < 0.001, ****P < 0.0001. n numbers refer to independent experiments. For gel source data in d,e, see Supplementary Information. Source data
Extended Data Fig. 1
Extended Data Fig. 1. Inhibition of CPT1 stimulates cell cycle activity and hypertrophic growth of neonatal CMs.
a, Heat map representing expression of genes involved in glycolysis, cell cycle, fatty acid oxidation, and the Krebs Cycle. Publicly available RNA-seq data of CMs isolated from mice at E14.5, P1-2, P60, and adult mice one week after transaortic constriction were used (GSE79883). b, RT-qPCR analysis of Cpt1a (n = 3) and Cpt1b (n = 4) expression in mouse hearts at different developmental stages (P0, P3, P7, P14). 36b4 expression served as reference. c, EdU incorporation in neonatal CMs, 72 h after DMSO or etomoxir treatment (n = 5, each). Areas of enlarged images are labelled by white frames. Quantification of EdU+sarc-actinin+ CMs is in the right panel. Scale bar: 50 μm. d, Immunofluorescence staining of neonatal CMs for sarc-actinin and Ki67 (n = 4) or pH3 (Ser10) (n = 3) with or without etomoxir treatment. Quantification of Ki67+sarc-actinin+ and pH3+sarc-actinin+ CMs is in the right panels. Scale bar: 50 μm. e, Western blot analysis of Cyclin E1 in P0-1 CMs after 3-days-culture with DMSO or etomoxir (n = 3, each). Pan-actin served as loading control. f, RT-qPCR analysis of hypertrophy-associated genes in P0-1 CMs, 72 h after DMSO or etomoxir treatment (n = 4, each). 36b4 was used as reference gene. g, RT-qPCR analysis of Cpt1a and Cpt1b expression in CMs from 10-weeks-old CtrlCre and Cpt1bcKO mice (n = 3, each). 36b4 served as reference gene. h, Western blot analysis of CPT1B in CMs from 10-weeks-old CtrlCre and Cpt1bcKO mice (n = 2, each). Pan-actin served as loading control. i, BW, HW, and HW/BW ratios of P7 CtrlCre (n = 6) and Cpt1bcKO (n = 4) mice. j, H&E-stained heart sections from P7 CtrlCre and Cpt1bcKO mice (n = 3, each). Scale bar: 500 μm. k, Images of hearts from 10-weeks-old CtrlCre and Cpt1bcKO mice (n = 3, each). Scale bar: 2 mm. l, BW and HW of 10-weeks-old CtrlCre and Cpt1bcKO mice (n = 5, each). m, H&E staining of heart sections from 10-weeks-old CtrlCre and Cpt1bcKO mice (n = 3, each). Scale bar: 600 μm. n, Immunofluorescence staining for α-WGA and quantification of cell surface areas on heart sections from 10-weeks-old CtrlCre and Cpt1bcKO mice (n = 3, each). Scale bar: 20 μm. o, Immunofluorescence images of sarc-actinin+ CMs from 10-weeks-old CtrlCre and Cpt1bcKO mice (n = 3, each). Quantifications of cell length, width, and surface area are in the right panels. Scale bar: 50 μm. Error bar represents mean ± s.e.m. N-numbers refer to individual mice in b, e-o. N-numbers refer to independent experiments in c, d. Two-tailed, unpaired student t-tests for statistical analysis in c-g, i, l, n-o. One-way ANOVA with Tukey tests for correction of multiple comparisons in b. *P < 0.05, **P < 0.01, ****P < 0.0001. For gel source data in e, h, see Supplementary Information. Source data
Extended Data Fig. 2
Extended Data Fig. 2. Deletion of Cpt1b in adult CMs reverses cell cycle arrest.
ac, Immunofluorescence staining for Ki67 (a), pH3 (b), Aurora B (c), and sarc-actinin on heart sections from 10-weeks-old CtrlCre and Cpt1bcKO mice (n = 3, each). Scale bar: 50 μm. d, Outline of the EdU incorporation assays using isolated cardiac nuclei. e, Strategy for quantification of CMs numbers in adult mouse hearts. f, Trichrome staining of heart sections from 10-weeks-old CtrlCre and Cpt1bcKO mice (n = 3, each). Scale bar: 600 μm. g-h, Cardiac MRI analysis of 10-weeks-old CtrlCre and Cpt1bcKO mice (n = 6, each). i, RT-qPCR analysis of Cpt1a and Cpt1b expression in CMs from adult hearts of Ctrl and Cpt1biKO mice, 4 weeks after termination of tamoxifen treatment for Cpt1b deletion (n = 3, each). 36b4 served as reference gene. j, Analysis of BW (left panel) and HW (right panel) of Ctrl and Cpt1biKO mice 4 and 8 weeks after TAM injection (Ctrl 4 and 8 weeks after TAM, Cpt1biKO 8 weeks after TAM, n = 4; Cpt1biKO 4 weeks after TAM, n = 3). k, Immunofluorescence staining for α-WGA and quantification of cell surface areas on heart sections of Ctrl and Cpt1biKO mice, 8 weeks after termination of tamoxifen treatment for Cpt1b deletion (n = 4, each). Scale bar: 20 μm. l, Macroscopic images of Ctrl and Cpt1biKO hearts, 4 and 8 weeks after termination of tamoxifen treatment for Cpt1b deletion. Scale bar: 2 mm. m-n, H&E and Trichrome staining of heart sections from Ctrl and Cpt1biKO mice, 4 and 8 weeks after termination of tamoxifen treatment for Cpt1b deletion (n = 3, each). Scale bar: 600 μm. o, MRI analysis of left ventricle ejection fraction (LVEF), ESV (End-Systolic Volume), EDV (End-Diastolic Volume) and cardiac output of Ctrl (n = 7) and Cpt1biKO (n = 8) mice, 8 weeks after termination of tamoxifen treatment for Cpt1b deletion. p-r, Immunofluorescence staining for Ki67 (p), pH3 (q), Aurora B (r), and sarc-actinin on heart sections from Ctrl and Cpt1biKO mice. Scale bar: 50 μm, p, n = 4; q and r, n = 3. Error bar represents mean ± s.e.m. N-numbers refer to individual mice. Two-tailed, unpaired student t-tests for statistical analysis in g,i,k,o. One-way ANOVA with Tukey tests for correction of multiple comparisons in j. *P < 0.05, ***P < 0.001, ****P < 0.0001. Source data
Extended Data Fig. 3
Extended Data Fig. 3. Abrogation of FAO reverts maturation of CMs.
a-b, GO-term enrichment analysis of differentially expressed genes (DEGs) in Cpt1bcKO and Cpt1biKO CMs. Enriched biological processes for up-regulated genes are in red and for down-regulated genes in blue. c, Heat map of selected DEGs involved in cell cycle (Magenta), maturation (red), contraction (blue), and HIF1A signaling (light blue) based on z-score transformed normalized DESeq counts. d, EM images showing the cytoarchitecture of CMs isolated from 10-weeks-old CtrlCre and Cpt1bcKO mice (n = 3, each). Scar bar: 500 nm. e, left: IF staining of isolated single CMs from CtrlCre and Cpt1bcKO adult hearts for sarcomeric actinin (identical exposure time for both CMs); right: quantification of sarcomere density based on IF staining for sarcomeric actinin, comparing CtrlCre and Cpt1bcKO adult CMs (n = 3, each). Scale bar: 10 μm. f, RT-qPCR analysis of selected genes in CMs from 10-weeks-old CtrlCre and Cpt1bcKO mice. 36b4 served as reference gene (n = 3, each). g, Overlap of up-regulated (left panel) and down-regulated (right panel) genes in Cpt1bcKO and Cpt1biKO CMs compared to control CMs. h, GO term enrichment analysis of genes from the overlap shown in (g). Error bar represents mean ± s.e.m. N-numbers refer to individual mice. Two-tailed, unpaired student t-tests for statistical analysis in (e,f). *P < 0.05, **P < 0.01, ***P < 0.001, ****P < 0.0001. Source data
Extended Data Fig. 4
Extended Data Fig. 4. Inhibition of FAO in CMs increases HIF1A levels and reduces DNA damage.
a, Western blot analysis of HIF1A in CMs from 10-weeks-old CtrlCre and Cpt1bcKO mice (n = 3, each). Pan-actin was used as loading control. For gel source data, see Supplementary Information. b, TUNEL assays on heart sections from 20–25-weeks-old CtrlCre and Cpt1bcKO mice (n = 3, each). DNase-treated samples were used as positive control. Scale bar: 20 μm. c, Immunofluorescence staining of 10-weeks-old CtrlCre and Cpt1bcKO heart sections using DAPI and DHR123. H2O2 treated heart sections were used as positive controls. Quantification of mean fluorescence intensity (MFI) per image is shown in the right panel (n = 3, each). d, Immunofluorescence staining of 10-weeks-old CtrlCre and Cpt1bcKO heart sections using γH2A.X and sarc-actinin antibodies. Quantification of the percentage of γH2A.X+sarc-actinin+ CMs per heart section is shown in the right panel (n = 3, each). Error bar represents mean ± s.e.m. N-numbers refer to individual mice. Two-tailed, unpaired student t-tests for statistical analysis in c and d. **P < 0.01. Source data
Extended Data Fig. 5
Extended Data Fig. 5. Abrogation of FAO by deletion of Cpt1b protects from I/R damage and enables heart regeneration.
a, b, Images of CtrlCre and Cpt1bcKO (a) and Ctrl and Cpt1biKO (b) heart sections after Evans blue injection and TTC staining, 24 h after I/R injury. I/R surgery was done using 7-weeks-old mice (a) or 14-weeks-old mice, 3 weeks after completion of TAM treatment (b). c, Staining for Ki67 and Sarc-actinin (left panel), and Aurora B and cTnT (right panel) on sections from hearts of adult CtrlCre and Cpt1bcKO mice, 72 h after I/R injury (Ctrlcre n = 3, Cpt1bcKO n = 4). Scale bar: 50 μm (left panel), 20 μm (right panel). d, Immunofluorescence staining for detyrosinated tubulin and cTnI using sections from CtrlCre and Cpt1bcKO hearts, 24 h after IR surgery (n = 3, each). e, MRI-based assessment of heart functions in CtrlCre and Cpt1bcKO mice before and 48 h after I/R surgery (0 h, CtrlCre n = 8, Cpt1bcKO n = 7; 48 h, n = 7, each). f, g, Cell viability assay of CMs isolated from adult CtrlCre and Cpt1bcKO hearts after exposure to 1% O2 for 18 hrs. The experimental approach is outlined in the upper panel. Quantification of dead cells (EthD-1+) is shown in g (n = 3, each). h, Western blot analysis and quantification of CPT1B levels in Cpt1biKO mice, 0, 2, 5, and 10 days after initiation of TAM treatment (n = 3, each). Pan-actin served as loading control. For gel source data, see Supplementary Information. Error bars represent mean ± s.e.m. N-numbers refer to independent experiments in g, others refer to individual mice. Two-tailed, unpaired student t-tests for statistical analysis in c, g. Two-way ANOVA with Tukey tests for correction of multiple comparisons in e and one-way ANOVA with Tukey tests for correction of multiple comparisons in h. ns: not significant, *P < 0.05, **P < 0.01, ****P < 0.0001. Source data
Extended Data Fig. 6
Extended Data Fig. 6. Characterization of metabolic changes in Ctp1b-deficient CMs.
a, Oxygen consumption rate (OCR) measurements of adult CMs isolated from CtrlCre and Cpt1bcKO hearts after addition of Palmitate-BSA (long chain fatty acids (LCFA), left panel), medium chain fatty acids (MCFA, middle panel) and short chain fatty acids (SCFA, right panel) using the Mito Stress kit for Seahorse instruments. bd, Quantification of acylcarnitine (b), free carnitine (c), and acetyl-CoA (d) in CMs isolated from adult CtrlCre and Cpt1bcKO mice (n = 8, each). e, Western blot analysis and quantification of enzymes involved in acetyl-CoA production (n = 3, each). Pan-actin was utilized as loading control. f, Activated metabolic pathways in adult Cpt1bcKO CMs based on targeted metabolome analysis. g, h, Fold-changes of amino acids (g) and biogenic amines (h) in Cpt1bcKO compared to CtrlCre CMs (n = 8, each). i, j, OCR analysis of adult CMs from CtrlCre and Cpt1bcKO mice using the Mito Stress kit for Seahorse instruments. Palmitate, glucose, BCAA and pyruvate were added as substrates for energy production. Basal and maximal respiration rates are shown in j (n = 3, each). k, Quantification of western blot analysis for enzymes involved in αKG production (n = 3, each). l, Western blot analysis of enzymes of the αKG dehydrogenase complex in adult CtrlCre and Cpt1bcKO CMs (n = 3, each). m, Western blot analysis of Krebs Cycle enzymes in adult CtrlCre and Cpt1bcKO CMs (n = 5, each). n, Quantification of mitochondrial DNA copy number using DNA from adult CMs of CtrlCre and Cpt1bcKO mice (n = 4, each). H19 and Mx1 were used as controls. Error bar represents mean ± s.e.m. N-numbers refer to individual mice. Two-tailed, unpaired student t-tests for statistical analysis in b-e, g-h, k-n. One-way ANOVA with Tukey tests for correction of multiple comparisons in j. *P < 0.05, **P < 0.01, ***P < 0.001, ****P < 0.0001. For gel source data in e,l,m, see Supplementary Information. Source data
Extended Data Fig. 7
Extended Data Fig. 7. CM-specific inactivation of Ogdh in adult mice induces hyperplastic and hypertrophic cardiac growth, similar to Cpt1b-deficient mice.
ad, Fold-changes of diacylglycerols (a), triacylglycerols (b,c) and CoAs (d) in Cpt1bcKO compared to CtrlCre CMs (n = 8, each). e, RT-qPCR expression analysis of Lpl in CMs isolated from adult CtrlCre and Cpt1bcKO mice (CtrlCre n = 4, Cpt1bcKO n = 3). 36b4 served as reference gene. f, Generation of Ogdh conditional KO mice. g, Western blot analysis of OGDH in CMs from Ctrl and OgdhiKO mice, 3-4 weeks after termination of tamoxifen treatment for Ogdh deletion (n = 3, each). Pan-actin was used as sample processing control. For gel source data, see Supplementary Information. h, Volcano plot showing differentially present metabolites in CMs of Ctrl and OgdhiKO mice. Red dots indicate increased and blue dots reduced concentrations of metabolites in OgdhiKO compared to Ctrl CMs. i, HW, BW and HW/BW ratios of Ctrl and OgdhiKO mice, 3-4 weeks after termination of tamoxifen treatment for Ogdh deletion (Ctrl n = 5, OgdhiKO n = 7). jl, Immunofluorescence analysis of heart sections from Ctrl and OgdhiKO mice for Ki67 (j), pH3 (k) and Aurora B (l), counterstained for sarc-actinin to identify CMs. Scale bar: 50 μm, (j, Ctrl n = 5, OgdhiKO n = 4; k and l, n = 4, each). m, RT-qPCR analysis of markers related to CMs maturation in Ctrl and OgdhiKO mice, 3-4 weeks after termination of tamoxifen treatment for Ogdh deletion (n = 4, each). 36b4 served as reference gene. Error bar represents mean ± s.e.m. N-numbers refer to individual mice. Two-tailed, unpaired student t-tests for statistical analysis in a-e, g,i,m. *P < 0.05, **P < 0.01, ***P < 0.001, ****P < 0.0001. Source data
Extended Data Fig. 8
Extended Data Fig. 8. Analysis of epigenetic and expression changes in CMs after inactivation of Cpt1b or Ogdh in adult mice.
a, Quantification of histone methylation modifications using FACS-isolated CM nuclei from 10-weeks-old CtrlCre and Cpt1bcKO mice (n = 3, each). b, Western blot analysis of H3K4me3 in CMs from Ctrl and OgdhiKO mice, 3-4 weeks after termination of tamoxifen treatment for Ogdh deletion (n = 3, each). H3 was used as loading control. For gel source data, see Supplementary Information. c, Expression levels of selected Jmjc domain-containing histone demethylase (upper panel) and histone methyltransferase (lower panel) genes based on log2-transformation of DESeq-normalized counts (n = 3, each). d, Quantification of SAM concentrations in adult CMs from 10-weeks-old CtrlCre and Cpt1bcKO mice (n = 4, each). e, GO-terms of genes with differentially present H3K4me3 peaks in Cpt1bcKO CMs. Enriched biological processes for genes with increased peaks are represented in red and for genes with reduced peaks in blue. f, Heat map of genes with reduced H3K4me3 ChIP-seq signals on promoters normalized for reads mapped in peaks. Corresponding coverage plots are shown in the top panels. g, Biological processes enriched for genes containing broad and narrow H3K4me3 peaks. Enriched GO-terms for genes with broad H3K4me3 peaks are shown in blue and for genes with narrow H3K4me3 peaks in red. h, Coverage plot of H3K4me3 peaks of genes with an overlap as shown in (Fig. 4d) between reduced expression and reduced H3K4me3 deposition in Cpt1bcKO compared to CtrlCre CMs. i-k, ChIP-qPCR analysis of H3K4me3, H3K9me3 and H3K27me3 enrichment in genes related to cardiac maturation using FACS-isolated adult CMs nuclei from 10-weeks-old CtrlCre and Cpt1bcKO mice (i, Mylk3 Exon1 Ctrl n = 4, others n = 5; j and k, n = 5, each). Error bar represents mean ± s.e.m. N-numbers refer to individual mice. Two-tailed, unpaired student t-tests for statistical analysis in a-b, d, i-k. Wald-test with Benjamini–Hochberg correction in c. *P < 0.05, **P < 0.01, ***P < 0.001. Source data
Extended Data Fig. 9
Extended Data Fig. 9. αKG stimulates proliferation of CMs.
a, RT-qPCR analysis of P0-1 neonatal CMs treated with DMSO or αKG (Acta1, Nppa, Nppb, Myh7, Tnni3, Mylk3, n = 4 in DMSO and n = 3 in αKG; Myocd, n = 5 in DMSO and n = 4 in αKG). 36b4 served as reference gene. b, Quantification of histone methylation levels in P0-1 neonatal CMs after 3-days in presence of DMSO or αKG (H3K27me3, n = 4; others n = 3, each). c, Quantification of αKG levels in P0-1 CMs transduced with Idh3b and Idh3g lentiviruses (n = 4, each). d, Western blot analysis of His-tagged IDH3B, IDH3G and H3K4me3 in neonatal CMs after transduction with Idh3b and Idh3g lentiviruses. Quantification of H3K4me3 levels is shown in the right panels (n = 3, each). H3 and pan-actin were used as internal controls. For gel source data, see Supplementary Information. e, ChIP-qPCR showing reduced enrichment of H3K4me3 in key cardiac maturation genes with broad but not with narrow H3K4me3 peaks (Snx19) in P0-1 CMs after transduction of Idh3b and Idh3g (Ctrl n = 5, Idh3b, n = 4; Idh3g, Mylk3 TSS and Snx19 Promoter n = 4, others n = 5). f, RT-qPCR analysis of cardiac maturation markers in P0-1 CMs after transduction with Idh3b and Idh3g lentiviruses (n = 5, each). 36b4 served as reference gene. g, h, Immunofluorescence analysis of Ki67 in sarc-actinin+ P0-1 CMs, 4 days after transduction of Idh3b (g) or Idh3g (h) lentiviruses with and without CPI treatment (n = 4, each). Scale bar: 50 μm. i, Immunofluorescence analysis of Ki67 in sarc-actinin+ P0-1 CMs after 3-days-culture in the presence of DMSO, αKG, R2HG, and a combination of αKG and R2HG (n = 3, each). Quantification of Ki67+sarc-actinin+ CMs is shown in the right panel. Scale bar: 50 μm. j, Immunofluorescence analysis of Ki67 in cTnT+ P0-1 CMs after 3 days in presence of DMSO, αKG, CPI, and a combination of αKG and CPI. Scale bar: 50 μm. k, EdU incorporation in adult CM treated for 96 h with DMSO, αKG, and CPI (n = 3). Enlarged images are labelled by white frames. Quantification of EdU+sarc-actinin+ CMs is shown in the right panel. Scale bar: 50 μm. l, RT-qPCR analysis of genes in P0-1 CMs after 4 days in presence of αKG and CPI (DMSO, n = 4; αKG, CPI, αKG + CPI, n = 3). 36b4 served as reference gene. Error bars represent mean ± s.e.m. N-numbers refer to independent experiments. Two-tailed, unpaired student t-tests for statistical analysis in a-b. One-way ANOVA with Tukey tests for correction of multiple comparisons in c-i, k-l. *P < 0.05, **P < 0.01, ***P < 0.001, ****P < 0.0001. Source data
Extended Data Fig. 10
Extended Data Fig. 10. Effects of αKG on gene expression, H3K4me3 deposition, and proliferation of CMs are mediated via KDM5.
a, Heat map of gene expression of Kdm5 family members at different stages of heart development and after transaortic constriction (TAC) based on z-scores of DESeq-normalized counts (RNAseq data are from GSE79883). b, Western blot analysis of myc-tagged KDM5B and H3K4me3 in neonatal CMs transduced with a Kdm5b lentivirus. Quantification of H3K4me3 levels is shown in the lower panel (Ctrl n = 4, Kdm5b-myc n = 5). H3 was used as loading control and pan-actin as sample processing control. c, Western blot analysis of H3K4me3 in P0-1 CMs transduced with a Kdm5b lentivirus with and without αKG treatment (n = 3, each). H3 was used as sample processing control. Quantification of H3K4me3 levels is shown in the right panel. d, Immunofluorescence analysis of Ki67 in sarc-actinin+ neonatal CMs (P0-1), 4-days after lentiviral transduction of Kdm5b with and without αKG treatment. Scale bar: 50 μm. e, Western blot analysis of H3K4me3 in P0-1 CMs after 4 days in presence of Kdm5b siRNA, αKG, and a combination of αKG and Kdm5b siRNA (n = 4, each). H3 was used as loading control. Quantification of western blots is in the right panel. f, Immunofluorescence analysis of Ki67 in sarc-actinin+ P0-1 CMs, 4 days after treatment with Kdm5b siRNA with and without αKG. Scale bar: 50 μm. g-h, RT-qPCR analysis of genes related to cardiac maturation (g) and selected house-keeping genes (h) in P0-1 CMs after treatment with Kdm5b siRNA with and without αKG (DMSO n = 6; αKG, Kdm5b KD and αKG+Kdm5b KD, n = 4). 36b4 expression served as reference gene. i, Proposed model: inactivation of Cpt1b in CMs increases αKG levels due to increased expression of IDH and reduced enzymatic activity of OGDH, which stimulates KDM5 activity, leading to reduction of H3K4me3 deposition in cardiac maturation genes, enabling proliferation of CMs. The mechanisms underlying the transport of αKG and citrate (dashed lines) into the nucleus are not fully understood. Error bar represents mean ± s.e.m. N-numbers refer to independent experiments. Two-tailed, unpaired student t-tests for statistical analysis in b. One-way ANOVA with Tukey tests for correction of multiple comparisons in c,e, g-h. *P < 0.05, **P < 0.01, ***P < 0.001, ****P < 0.0001. For gel source data in b,c,e, see Supplementary Information. Source data

Comment in

Similar articles

Cited by

References

    1. Maroli G, Braun T. The long and winding road of cardiomyocyte maturation. Cardiovasc. Res. 2021;117:712–726. doi: 10.1093/cvr/cvaa159. - DOI - PubMed
    1. Yuan X, Braun T. Multimodal regulation of cardiac myocyte proliferation. Circ. Res. 2017;121:293–309. doi: 10.1161/CIRCRESAHA.117.308428. - DOI - PubMed
    1. Horton JR, et al. Characterization of a linked Jumonji domain of the KDM5/JARID1 family of histone H3 lysine 4 demethylases. J. Biol. Chem. 2016;291:2631–2646. doi: 10.1074/jbc.M115.698449. - DOI - PMC - PubMed
    1. Nakada, Y. et al. Hypoxia induces heart regeneration in adult mice. Nature10.1038/nature20173 (2016). - PubMed
    1. Puente BN, et al. The oxygen-rich postnatal environment induces cardiomyocyte cell-cycle arrest through DNA damage response. Cell. 2014;157:565–579. doi: 10.1016/j.cell.2014.03.032. - DOI - PMC - PubMed

MeSH terms