. 2023 Nov;30(11):1774-1785.
doi: 10.1038/s41594-023-01101-9. Epub 2023 Sep 25.

Molecular mechanisms of inorganic-phosphate release from the core and barbed end of actin filaments

Affiliations

Molecular mechanisms of inorganic-phosphate release from the core and barbed end of actin filaments

Wout Oosterheert et al. Nat Struct Mol Biol. 2023 Nov.

Abstract

The release of inorganic phosphate (Pi) from actin filaments constitutes a key step in their regulated turnover, which is fundamental to many cellular functions. The mechanisms underlying Pi release from the core and barbed end of actin filaments remain unclear. Here, using human and bovine actin isoforms, we combine cryo-EM with molecular-dynamics simulations and in vitro reconstitution to demonstrate how actin releases Pi through a 'molecular backdoor'. While constantly open at the barbed end, the backdoor is predominantly closed in filament-core subunits and opens only transiently through concerted amino acid rearrangements. This explains why Pi escapes rapidly from the filament end but slowly from internal subunits. In a nemaline-myopathy-associated actin variant, the backdoor is predominantly open in filament-core subunits, resulting in accelerated Pi release and filaments with drastically shortened ADP-Pi caps. Our results provide the molecular basis for Pi release from actin and exemplify how a disease-linked mutation distorts the nucleotide-state distribution and atomic structure of the filament.


Conflict of interest statement

The authors declare no competing interests.

Figures

Fig. 1
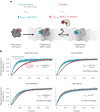
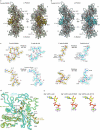
Fig. 1. Cryo-EM structure of the phalloidin-bound barbed end of F-actin.
a, Exemplary two-dimensional (2D) class averages of the barbed-end particles. The particle boxes are 465 × 465 Å2. Additional 2D class averages are depicted in Extended Data Figure 1b. b, Cryo-EM density map of the barbed end at 3.6-Å resolution, shown in two orientations. Actin subunits with complete inter-subunit contacts (A2 and above) are colored dark red, the penultimate subunit (A1) is colored salmon, and the ultimate subunit (A0) is depicted in orange. Phalloidin (cyan) and ADP (yellow) are annotated. c, Superimposition of the A2 and A0 subunits at the barbed end. Actin subdomains (SD1–SD4) and the regions that are different between the two subunits are annotated. P2 loop, residues 154–161. R177 strand, residues 176–178. d, Right, molecular model of the F-actin barbed end. The images on the left depict a zoom-in on the R177–N111 backdoor as seen from the F-actin exterior. Amino acids that form the backdoor are annotated. Although the subunits adopt the ADP state, Pi from PDB 8A2S (F-actin in the Mg2+-ADP-Pi state) is fitted and shown semi-transparently to emphasize the Pi-binding site. e, A slice through the structures of the A2 and A0 subunits near the nucleotide-binding site, shown in surface representation. Similar to d, Pi from PDB 8A2S is shown to emphasize the Pi-binding site.
Fig. 2
Fig. 2. Enhanced sampling simulations reveal several Pi-release paths from the F-actin core.
a, Simulation box containing an explicitly solvated actin pentamer. The core actin subunit is shown in pale green. b, Typical Pi-egress pathways from the actin core, obtained by enhanced sampling. Actin subdomains are annotated. The two plausible egress paths that were analyzed further are the putative R183 backdoor (gold) and R177-N111 backdoor (blue). Implausible Pi release pathways are colored purple and magenta and are further shown in Extended Data Figure 4. The F-actin structure fluctuated during the simulations but is shown in a single, representative conformation for clarity. c,d, Close-up views of the plausible Pi-egress paths. Time-ordered representative Pi positions (1–3) from enhanced sampling trajectories are shown and connected by arrows indicating the direction of Pi movement. Similar to b, the F-actin structure is shown in a single, representative conformation for clarity. Close-up views are depicted for the potential R177-N111 backdoor path (c) and for the potential R183 backdoor path (d).
Fig. 3
Fig. 3. Biochemical characterization of Pi release from actin filaments.
a, Scheme of the synchronous measurement of actin polymerization and subsequent Pi release as measured by the fluorescence intensity increase of pyrene (cyan) and MDCC-PBP (red), respectively. kpoly, apparent rate of actin polymerization; k–Pi, rate constant for phosphate release. F405 nm and F455 nm refer to the measured increase in fluorescent intensity at the specified emission wavelength. b, Timecourses of the normalized fluorescence intensities of 10 µM actin (either wild-type or mutants as indicated) containing 1.5% wild-type, pyrene α-actin (cyan), and 30 µM MDCC-PBP (red) seeded with 160 nM spectrin-actin seeds after initiation of polymerization (t = 0 s). Dark colors indicate the average of three independent experiments, whereas the lighter colored areas indicate the s.d. The black dashed lines correspond to fits of the phosphate release data to a kinetic model (see Methods). Rates of Pi release and relative rate enhancement over wild-type actin as determined either from fits to a kinetic model (wild-type, actin-R183G and actin-R183W) or by estimation from kinetic simulations (actin-N111S, see Methods and Extended Data Fig. 5c,d) are depicted in each graph. Source data
Fig. 4
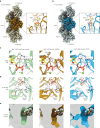
Fig. 4. High-resolution cryo-EM structures of F-actin-R183W and F-actin-N111S.
a,b, Sharpened cryo-EM density maps of F-actin-R183W (a) and F-actin-N111S (b) in the Mg2+-ADP nucleotide state. Five filament subunits are shown. For the R183 mutant, the central subunit is colored gold; the central subunit of the N111S mutant is colored blue. The helical rise and twist are annotated. Densities corresponding to water molecules are shown in red. For each mutant, a zoom-in of the nucleotide-binding pocket with cryo-EM densities for the nucleotide (depicted in yellow), the Mg2+ ion (green), and water molecules (red) is shown. Water molecules that directly coordinate the Mg2+ ion are colored magenta. The polar ends of the actin filament, (−) pointed and (+) barbed, are annotated. ce, Structural comparison between filamentous wild-type α-actin (PDB 82AT, left, green), β-actin-R183W (middle, gold), and β-actin-N111S (right, blue) in the Mg2+-ADP state. The panels depict the amino acid environment near the location of residue 183 (c), the amino acid environment near residues 177 and 111 (d), and a slice through the F-actin interior near the Pi-binding site (e). In c and d, F-actin is shown as a cartoon, and amino acids are shown as sticks and are annotated. In e, F-actin is depicted in surface representation. Water molecules are omitted from ce. Although the depicted structures adopt the ADP state, Pi from PDB 8A2S (F-actin in the Mg2+-ADP-Pi state) is fitted and shown semi-transparently to emphasize the Pi-binding site.
Fig. 5
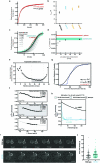
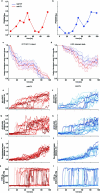
Fig. 5. Effects of the N111S substitution on single actin filaments in vitro and on yeast growth in vivo.
a, Timelapse TIRF imaging of single actin filaments (black, visualized by Lifeact-Alexa-Fluor-488) polymerized from spectrin-coated surfaces in microfluidic flow chambers. The vertical and horizontal axes indicate time and filament length, respectively. Polymerization and depolymerization phases are demarcated by the gray shaded and unshaded areas, respectively. b, Filament lengths tracked over the course of polymerization (gray shaded area) and depolymerization (unshaded area). Points indicate average filament length calculated from 25 and 45 filaments polymerized from either wild-type actin or actin-N111S, respectively. Shaded areas indicate the s.d. Wild-type and N111S filaments were analyzed from 6 and 12 independent experiments, respectively. t, time since depolymerization. Monomermax and monomert are defined as the filament length in monomers at the maximum length and at time = t, respectively. c, The inverse of the instantaneous depolymerization velocity (1 / vdepol), calculated from the average filament length in b, as a function of filament age (τ) upon depolymerization. Points and the shaded area around them indicate average 1 / vdepol calculated from varying window sizes and the s.d., respectively. The dashed line indicates the fit to a kinetic model (see Methods). d, Rate constants of Pi release from the filament interior and barbed end (k–Pi and k–Pi BE) and depolymerization velocities of ADP-Pi or ADP subunits from the filament end (vdepol,ADP and vdepol,ADP-Pi) determined from fits obtained in c. The asterisk indicates the lower bound estimate for N111S (see Methods and Extended Data Fig. 5h). e, Growth phenotype assay of yeast expressing either the wild type or N111S variant of S. cerevisiae actin. The two yeast strains were grown in the absence or presence of 1 μM latrunculin A (LatA). Source data
Fig. 6
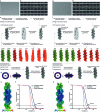
Fig. 6. Backdoor opening mechanism revealed by SMD simulations.
ac, Selected frames from the SMD trajectory. Dotted lines indicate hydrogen bonds. Arrows indicate the side chain and backbone movements involved in the opening of the backdoor. Time t and Pi-release propensity (pBD) along the trajectory are shown. In c, the orange arrows indicate the direction of Pi movement through the open R177-N111 backdoor observed in a representative enhanced sampling simulation.
Fig. 7
Fig. 7. Cartoon model of Pi release from wild-type and N111S-F-actin.
In wild-type F-actin, subunits that reside in the filament core predominantly adopt a closed-backdoor conformation and hence release Pi at slow rates. In the ultimate subunit at the barbed end, the backdoor is open, leading to 300-fold faster Pi release during actin depolymerization. In F-actin-N111S, the amino acid substitution results in an open backdoor in internal subunits, leading to increased Pi-release rates.
Extended Data Fig. 1
Extended Data Fig. 1. Cryo-EM image-processing of the F-actin barbed end.
a, Micrograph depicting short β/γ-actin filaments frozen in vitreous ice, at a defocus of −2.2 µm. The shown micrograph is an example image from a total dataset of 1,316 micrographs. The scale bar is 400 Å. b, Exemplary 2D-class averages of the F-actin barbed end reconstruction, generated by RELION. The box size is 465 × 465 Å2. c, Image processing strategy that was employed to determine the β/γ-actin barbed end structure. All maps are shown in the same orientation. d, Angular distribution of the barbed end particles used to reconstruct the final cryo-EM map, generated by CryoSPARC. e, Fourier-shell correlation plots for the barbed structure of gold-standard refined half-maps, computed by CryoSPARC. The FSC = 0.143 threshold is annotated. f, Local-resolution estimation of the barbed end reconstruction, computed through RELION.
Extended Data Fig. 2
Extended Data Fig. 2. Small-molecule binding sites and Pro-rich loop arrangement in the F-actin barbed end structure.
a, Simplified cartoon representation of the barbed end structure. Actin subunits are annotated. ADP and phalloidin are shown as spheres with carbon atoms colored cyan and yellow, respectively. b, Cryo-EM densities of the ADP and phalloidin binding sites with fitted models. F-actin is shown as simplified cartoon. c, Zoom of the phalloidin-binding site near the R177-N111 backdoor in actin subunit A2. Phalloidin is shown in stick representation with a semi-transparent surface. Residues of the proposed backdoor (R177, N111, H73, G74) are annotated, as well as other residues (N115/R116, T120/V370) that may represent other Pi escape sites. Phalloidin would only interfere with disruption of the classical backdoor. d, Arrangement of the Pro-rich loop in subunits A2 (left panel) and A0 (right panel) in the barbed end structure. In subunit A2, the Pro-rich loop conformation is stabilized by SD4 of subunit A1. Conversely, the Pro-rich loop of subunit A0 does not interact with other subunits.
Extended Data Fig. 3
Extended Data Fig. 3. Alignment of barbed-end subunit structures with previously determined actin structures.
a, Superimposition of the A2 subunit of the barbed end structure (colored dark-red) with the structure of ADP-bound filamentous α-actin (pdb 8a2t, colored green). b, Superimposition of the A2 subunit of the barbed end structure with the structure of ATP-bound monomeric α-actin (pdb 2v52, colored pink). c, Superimposition of the A0 subunit of the barbed end structure (colored orange) with the structure of ATP-bound monomeric α-actin (pdb 2v52). d, Superimposition of the A2 (colored dark-red) and A1 (colored salmon) subunits of the barbed end structure. The only observed change in penultimate subunit A1 is a small rearrangement of the W-loop. This change in the W-loop is expected, because this region would interact with the D-loop of the missing subunit. e, Zoom of the R177-N111S backdoor as seen from the F-actin exterior for the A2 and A1 subunits of the barbed end structure. Amino acids that form the backdoor are annotated. Phalloidin is hidden for clarity. Although the subunits adopt the ADP state, Pi from pdb 8a2s (F-actin in the Mg2+-ADP-Pi state) is shown semi-transparently to emphasize the Pi-binding site. f, Architecture of the Pi-release backdoor in structures of ADP-bound F-actin (left), the ADP-bound A2 subunit at the F-actin barbed end (middle-left), the ADP-bound A0 subunit at the F-actin barbed end (middle-right) and ATP-bound G-actin (right).
Extended Data Fig. 4
Extended Data Fig. 4. Enhanced sampling simulations of Pi release from the F-actin barbed end and core.
a, Representative egress paths from the barbed end show a clear preference for egress through the open R177-N111 backdoor. The F-actin structure fluctuated during the simulations but is shown in a single, representative conformation for clarity. b, Path cluster occupancies in barbed end simulations with the same color code as in panel a. c, A representative path of Pi egress through pathway 2 (purple) in F-actin core simulations. The simulation revealed a highly bent ADP conformer that allowed Pi to escape. Such a drastic rearrangement of the nucleotide binding pocket is physically implausible. In addition, this egress path would not be directly affected by phalloidin and jasplakinolide binding. Hence, this pathway was not considered for further experimental validation. d, A representative path of Pi egress through pathway 3 (magenta) in F-actin core simulations. This escape would also not be directly affected by phalloidin and jasplakinolide binding. Hence, it was not considered for further experimental validation. Similar to panel a, the F-actin structure is shown in a single, representative conformation for clarity. e, Path cluster occupancies in actin core simulations with the same color code as in Fig. 2. Pathways 1 and 4 are further discussed in the main text.
Extended Data Fig. 5
Extended Data Fig. 5. Kinetic analysis of Pi release from actin filaments and dynamics of actin variants in yeast.
a, Time courses of the normalized fluorescence intensity of 30 µM MDCC-PBP (Pi sensor) from 10 µM N111S actin containing either 1% (black) or 10% (red) wild-type, pyrene α-actin, seeded with 100 nM spectrin-actin seeds after initiation of polymerization (t = 0s). b, Characteristic half-times of polymerization for indicated actin variants as determined from mono-exponential fits to the observed polymerization time-courses (Fig. 3b). Dots are values from individual experiments, whereas lines represent the mean from three experiments. Error bars are SD. c, Semi-logarithmic plot of simulated Pi release reaction kinetics (gray to black) depending on the enhancement of Pi release rate constant (x-fold over wild-type actin as indicated) compared to the observed time courses of polymerization (cyan) and of Pi release (red) for N111S actin. d, Apparent rates of Pi release, obtained from mono-exponential fits of the simulated data shown in c as a function of the enhancement of Pi release rate constant (x-fold over wild-type actin as indicated). The cyan and red areas indicate the observed apparent rates of polymerization (cyan) and Pi release (red) with the center of the error bands (dark colors) being the average from three experiments and the error bands (light colors) representing SD. Note that an enhancement of the Pi release rate constant by at least 15-fold is required for the apparent rate of Pi release to fall within the error margin of the observed polymerization rate. e, Effect of varying window sizes on the average prediction error of the three fit parameters from the kinetic model. The average prediction error is large (>10%) for small and large window sizes with a shallow optimum in between (grey shaded region, size 17 to 29). At smaller window sizes the prediction error is large as a result of a higher variance in calculated velocities and for larger window sizes the prediction error increases with decrease in the number of data points available for fitting. f, Exemplary fits (grey dashed lines) calculated from velocities (black points) obtained with different window sizes from within (shaded grey, size 20) and flanking (size 14 and 30) the optimum. The exponential decay function used for these fits and their fit parameters are provided in the bottom-left and top-right parts of each sub-plot respectively. g, Cumulative distribution probability of pauses as a function of time from the onset of depolymerization. Blue line indicates the fraction of tracked filaments that have paused at any given time and the black line is obtained by fitting an analytic model of pause probability (described previously in ref. ) as a function of time. The model is described by the equations in the bottom-right corner of the plot. From this fit we obtained for the fit parameter ω (protomer transition rate) a value of 5.8 × 10⁻⁷ s−1. h, Estimation of lower bounds for the phosphate release rate of N111S mutant. Rates were calculated by fitting exponential decay functions to the observed depolymerization velocity data, so that the observed velocities converged to the mutant’s vdepol,ADP and the vdepol,ADP-Pi rate was either assumed to be equal (high estimate, blue) or twice that of the wild type (low estimate, turquoise). The latter assumption was motivated by the observation that the vdepol,ADP rate of N111S mutant was about 2.2 times that of wild-type actin (Fig. 5d). i, Time-lapse series of confocal microscopy images showing Lifeact-mCherry fluorescence every 5 seconds for actin path detection in yeast cells expressing either wild-type or N111S-actin. The white arrow highlights an exemplary dynamic actin path. The scale bar is 4 µm. The shown images of yeast cells are example images from a total of eight cells per strain. Four independent colonies per strain were imaged. The full experiment was performed in duplicate, obtaining similar results. j, Plot of endocytic actin patch lifespans per strain. Each color dot represents one patch. The average lifespans are 12 s ± 7 s (wild-type actin) and 14 s ± 7 s (N111S-actin). Error bars correspond to mean ± standard deviation. Sample size corresponds to n = 86 patches for WT and n = 89 patches for N111S, from a total of eight cells per strain from four independent colonies. There are no large differences in actin-patch lifespans between the two yeast strains. Source data
Extended Data Fig. 6
Extended Data Fig. 6. Processing of the F-actin-R183W and F-actin-N111S datasets.
a, g, Micrographs depicting R183W (a) and N111S (g) variants of F-actin frozen in vitreous ice, at, respectively, defocus values of −2.3 µm and −1.9 µm. The shown micrographs are example images from total datasets of 7,916 (R183W) and 9,516 (N111S) micrographs. The scale bars are 400 Å. b, h, Exemplary 2D-class averages of the R183W- (b) and N111S-F-actin (h) particles, computed through RELION. The box size is 267 × 267 Å2. c, i, Image processing strategies that were employed to determine the actin-R183W (c) and actin-N111S (i) structures. All maps are shown in the same orientation. d, j, Angular distribution of the particles used to reconstruct the final cryo-EM maps of F-actin-R183W (d) and F-actin-N111S (j), shown along the filament axis (left) and orthogonal to the filament axis (right). e, k, Local-resolution estimations of the R183W- (e) and N111S-F-actin (k) density maps, calculated by RELION. The bar depicts local resolution in Å. f, l, Fourier-shell correlation plots for gold-standard refined masked (black), unmasked (blue) and high-resolution phase randomized (red) half-maps of F-actin-R183W (f) and F-actin-N111S particles (l). The FSC = 0.143 threshold is shown as a dashed line.
Extended Data Fig. 7
Extended Data Fig. 7. High-resolution structures of β-actin variants R183W and N111S.
a, b, Structures of F-actin-R183W (a) and F-actin-N111S (b) shown as cartoon orthogonal to the filament axis. The central subunits are colored gold and blue, respectively. Water molecules modeled in both structures are depicted as red spheres. The pointed and barbed end directions are annotated, as well as the helical rise and twist of both mutant structures. c, Cryo-EM densities and fitted atomic models for selected regions of both reconstructions. Specifically, amino-acid environments near the mutated residues are shown to highlight differences between both structures. d, Alignment of single subunits of filamentous wild-type α-actin (pdb 8a2t, colored green), R183W-β-actin (gold) and N111S-β-actin (blue) in the Mg2+-ADP state. The F-actin subdomains and regions important for Pi release are annotated. e, Nucleotide arrangement in high-resolution Mg2+-ADP-bound F-actin structures of wild-type α-actin (pdb 8a2t, left), β-actin-R183W (middle) and β-actin-N111S (right). The arrangements in wild-type α-actin and β-actin-N111S are similar, whereas the Mg2+ ion adopts a different position in the β-actin-R183W structure.
Extended Data Fig. 8
Extended Data Fig. 8. Acidic amino-acid environment around residue 183.
a–c, Arrangement near residue 183, as show from the filament exterior for filamentous wild-type α-actin (a) (pdb 8a2t, colored green), β-actin-R183W (gold) (b) and β-actin-N111S (blue) (c) in the Mg2+-ADP state. The top image depicts F-actin as cartoon and charged amino acids near residue-183 as cartoon and sticks. In the lower panel, F-actin is shown as surface, which is colored by electrostatic Coulomb potential ranging from −10 kcal (mol e)−1 (red) to +10 kcal (mol e)−1 (blue). The surface is more negatively charged in the F-actin-R183W structure.
Extended Data Fig. 9
Extended Data Fig. 9. Structural dynamics of the R177-N111 backdoor in unbiased and steered MD simulations.
a, Time-series of the R177CZ-N111CG distance (depicted in light green) in an unbiased MD simulation, revealing that the R177-N111 hydrogen bond reversibly breaks and re-forms in unbiased MD simulations. A distance larger than 0.6 nm indicates disruption of the hydrogen bond. For clarity, a centered 2 ns-moving average is shown in dark green. The arrow indicates the used time-frame to capture the F-actin conformation shown in panel b. b, Example configuration with a broken R177-N111 hydrogen bond sampled at 360 ns during the unbiased MD simulation. The surface representation indicates that the backdoor is closed despite the broken R177-N111 hydrogen bond. Solvent accessible area for Pi is depicted in dark grey. There is no accessible path for Pi to escape from the F-actin interior. c-k Snapshots from a representative SMD simulation (neutral meH73, replicate 1). Frames are the same as in Fig. 6. c–e, Solvent-accessible surface representation of the nucleotide binding site and R177-N111 backdoor, side view. The solvent-accessible volume is shown in dark grey. f–h, Solvent-accessible surface representation of the R177-N111 backdoor, external view. Note that in h, Pi is visible from the outside. i–k, Close-up on the inter-subunit contacts.
Extended Data Fig. 10
Extended Data Fig. 10. Evolution of key observables during SMD simulations.
a, Predicted fraction pBD of Pi egress through the R177-N111 backdoor along SMD replicate 1, with neutral meH73, as obtained by classifier analysis of the enhanced sampling trajectories. b, Predicted fraction pBD of Pi egress through the R177-N111 backdoor along SMD replicate 1, with positively charged meHis73, as obtained by classifier analysis of the enhanced sampling trajectories. c, Survival analysis of the R177-N111 hydrogen bond in SMD simulations. For each protonation state of meH73, we computed the fraction of trajectories with the R177-N111 hydrogen bond still formed at time t. A distance cut-off of 0.6 nm between atoms CZ of R177 and CG of N111 was used to define a formed hydrogen bond. The solid lines represent the 2 ns-rolling average of the survival fraction. The dotted lines represent the 2 ns-rolling averages of the survival fraction ± SEM. The background overlays represent the raw values for the survival fraction ± SEM. d, Survival analysis of the rotameric state of H161. For each protonation state of meH73, we computed the fraction of trajectories with H161 in a core-like rotameric state. H161 side-chain rotameric states were defined by χ1 torsion angle being above or below 180 deg. Representation conventions are the same as for panel c. e–l. Evolution of structural observables during for all SMD simulation replicates. For clarity, 2 ns-moving averages are shown.

Similar articles

Cited by

References

    1. Pollard TD, Borisy GG. Cellular motility driven by assembly and disassembly of actin filaments review. Cell. 2003;112:453–465. - PubMed
    1. Le Clainche C, Carlier MF. Regulation of actin assembly associated with protrusion and adhesion in cell migration. Physiol. Rev. 2008;88:489–513. - PubMed
    1. Svitkina T. The actin cytoskeleton and actin-based motility. Cold Spring Harb. Perspect. Biol. 2018;10:a018267. - PMC - PubMed
    1. Rould MA, Wan Q, Joel PB, Lowey S, Trybus KM. Crystal structures of expressed non-polymerizable monomeric actin in the ADP and ATP states. J. Biol. Chem. 2006;281:31909–31919. - PubMed
    1. Oda T, Iwasa M, Aihara T, Maéda Y, Narita A. The nature of the globular- to fibrous-actin transition. Nature. 2009;457:441–445. - PubMed