. 2023 Nov 6;222(11):e202302076.
doi: 10.1083/jcb.202302076. Epub 2023 Sep 25.

Activated Src kinase promotes cell cannibalism in Drosophila

Affiliations

Activated Src kinase promotes cell cannibalism in Drosophila

Alba Yurani Torres et al. J Cell Biol. .

Abstract

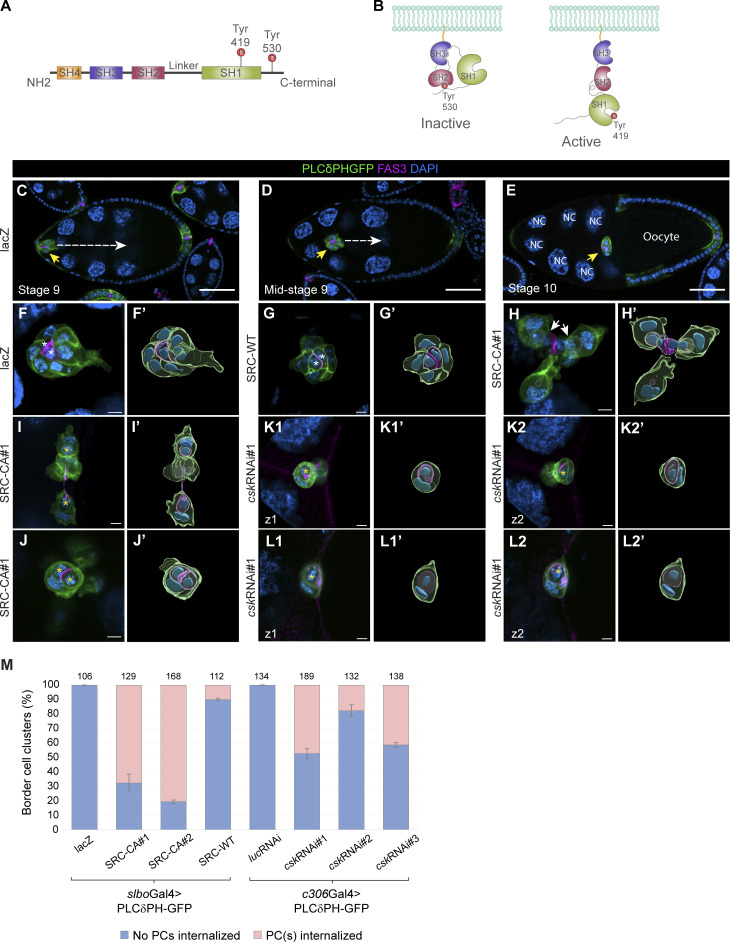
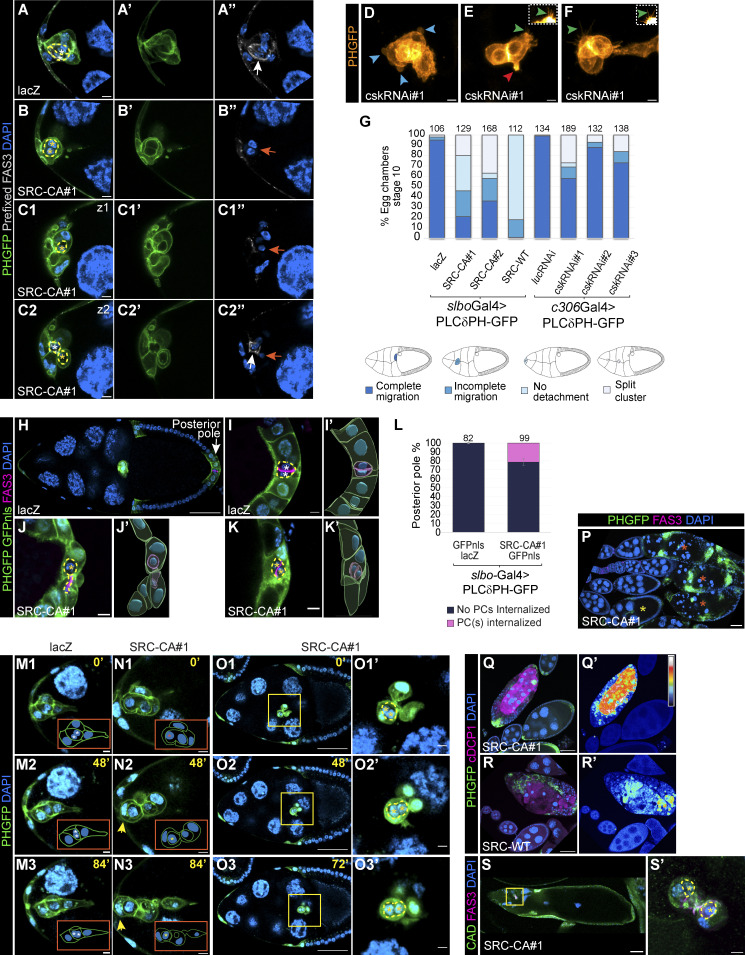
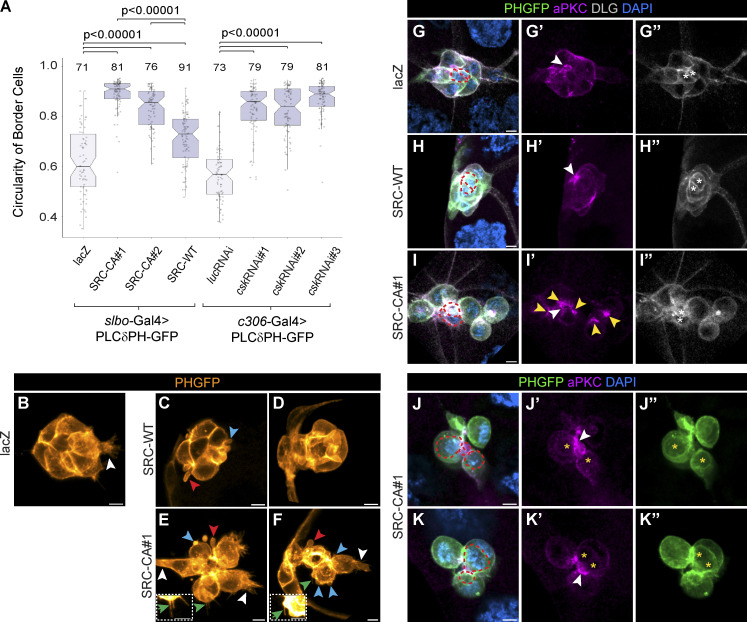
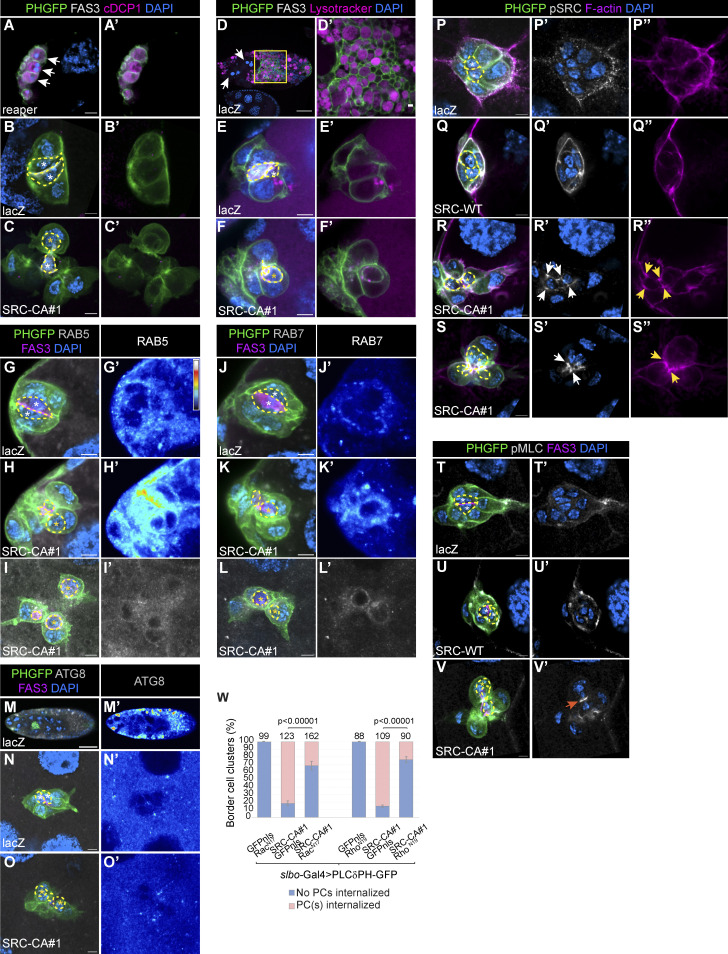
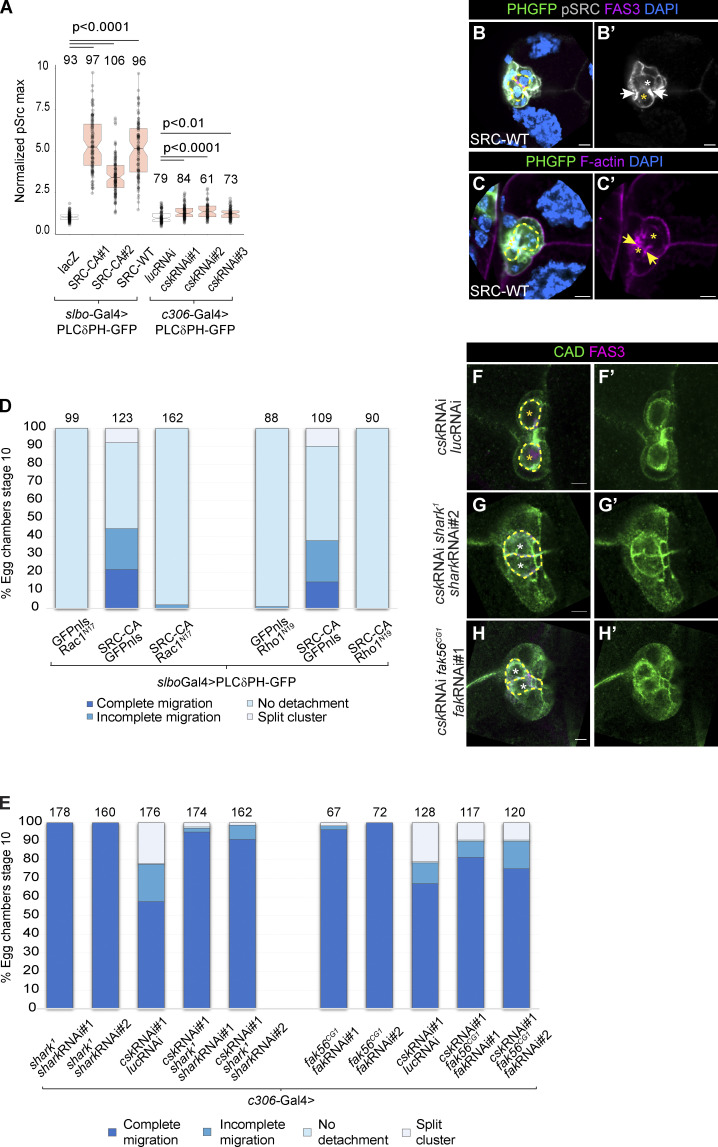
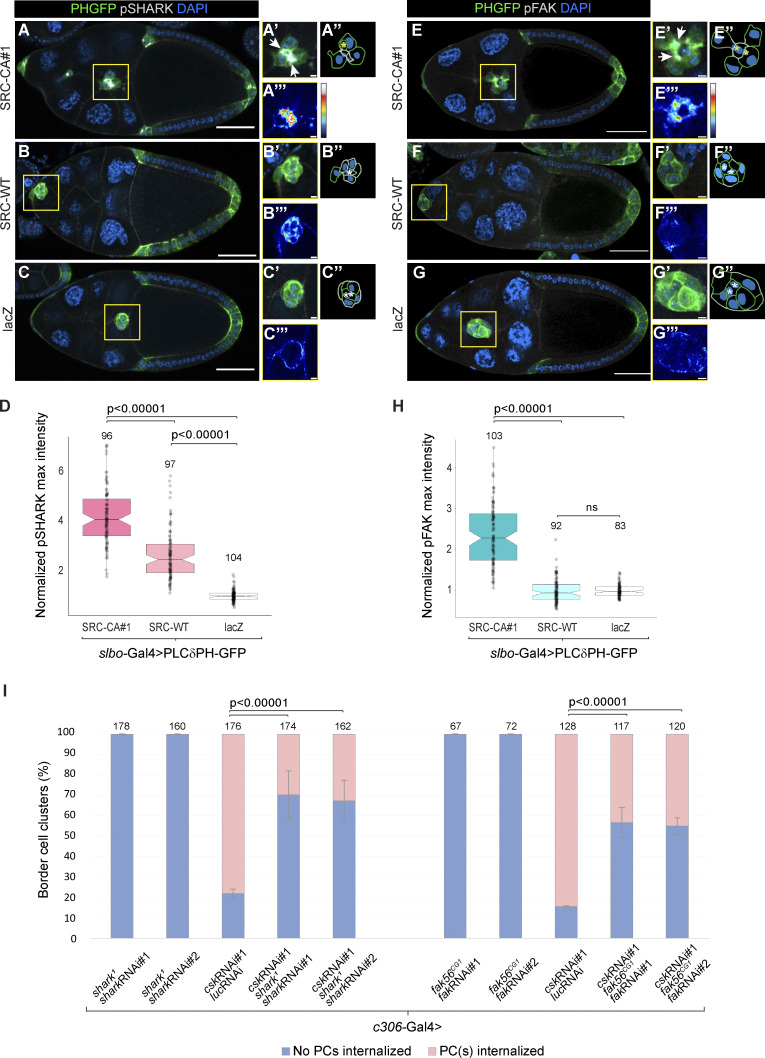
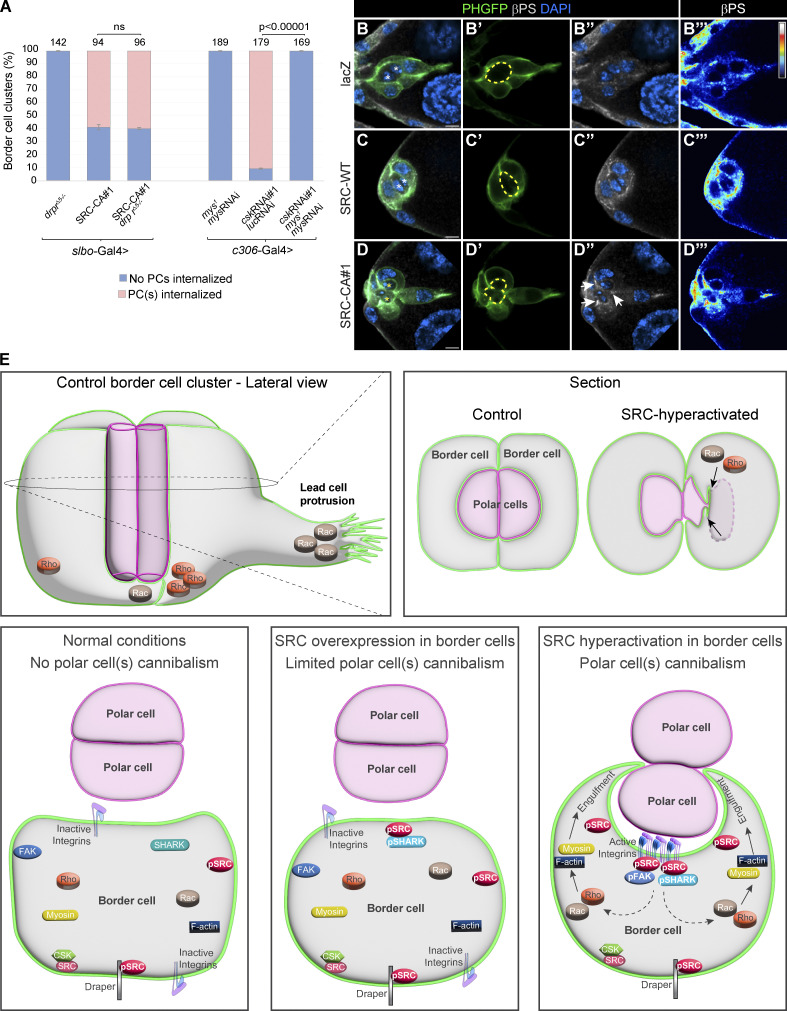
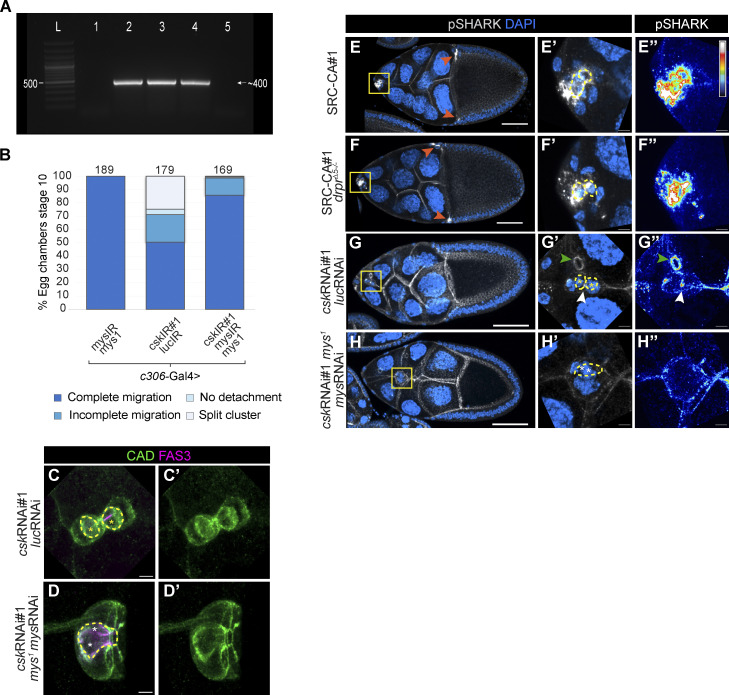
Src family kinases (SFKs) are evolutionarily conserved proteins acting downstream of receptors and regulating cellular processes including proliferation, adhesion, and migration. Elevated SFK expression and activity correlate with progression of a variety of cancers. Here, using the Drosophila melanogaster border cells as a model, we report that localized activation of a Src kinase promotes an unusual behavior: engulfment of one cell by another. By modulating Src expression and activity in the border cell cluster, we found that increased Src kinase activity, either by mutation or loss of a negative regulator, is sufficient to drive one cell to engulf another living cell. We elucidate a molecular mechanism that requires integrins, the kinases SHARK and FAK, and Rho family GTPases, but not the engulfment receptor Draper. We propose that cell cannibalism is a result of aberrant phagocytosis, where cells with dysregulated Src activity fail to differentiate between living and dead or self versus non-self, thus driving this malignant behavior.


Conflict of interest statement

Disclosures: All authors have completed and submitted the ICMJE Form for Disclosure of Potential Conflicts of Interest. A.Y. Torres reported a patent to GENETICALLY ENGINEERED PHAGOCYTES, AND RELATED COMPOSITIONS, VECTORS, METHODS, AND SYSTEMS pending. D.J. Montell reported other from Inceptor Bio outside the submitted work; in addition, D.J. Montell had a patent to 17/995,083 pending “Inceptor Bio.” No other disclosures were reported.

Figures

Figure 1.
Figure 1.
Deregulated SRC activity causes border cells to engulf polar cells. (A) Schematic representation of the domains found in human SRC kinase and the important regulatory sites of tyrosine phosphorylation in the SH1 domain (Tyr419) and in the C-terminal tail (Tyr530). (B) Schematic representation of intramolecular interactions of human SRC in inactive and active conformations. (C–E) Single sections from confocal images of egg chambers at stages 9 and 10 expressing UAS-PLCδPHGFP to label membranes and UAS-lacZ as a negative control. Egg chambers were stained with FAS3 (magenta) and DAPI (blue). Yellow arrows point to the border cell cluster, and dashed white arrows indicate the migration path. NC: nurse cell nuclei. Scale bar, 50 µm. (F–L2) Single sections from confocal images of border cell clusters from egg chambers at stage 9 or 10 expressing UAS-PLCδPHGFP and the indicated UAS transgenes. Polar cells are identified by FAS3 (magenta) and DAPI labels DNA (blue). White asterisks in F and G indicate non-internalized polar cells and yellow asterisks in I, J, K1, K2, L1, and L2 indicate internalized polar cells. (H) White arrows in H point to polar cell nuclei being pinched by border cells. (K1 and K2) Images show two different focal planes of the same cluster, as well as L1 and L2 images. Scale bar: 5 µm. (F’–L2’) Segmentation and 3D reconstructions of the images in F–L2. (M) Quantifications of polar cell internalization from egg chambers at stage 10 of the indicated genotypes. Error bars: mean ± SEM (n = 3 independent experiments). The total number of clusters analyzed (n) is indicated at the top of each bar.
Figure S1.
Figure S1.
Elevated SRC activity promotes the engulfment of living polar cells and alters cluster morphology and migration. (A–C2’’) Confocal images of border cell clusters from egg chambers in stage 9 or 10 expressing UAS-PLCδPHGFP and the genotypes indicated. Egg chambers were incubated with FAS3 (gray) antibody before fixation and without permeabilization treatment (see Materials and methods). A is a maximal projection of 10 slices (z-step: 0.4 µm). White asterisk in A and C2 indicates non-internalized polar cells. Yellow asterisks in B–C2 indicate partially/fully internalized polar cells. White arrows in A” and C2” point to FAS3 accumulation in non-internalized polar cells and orange ones in B”–C2” point to the absence of FAS3 due to polar cell internalization by border cells. (C1–C1”) and (C2–C2”) are single sections of two different focal planes of the same cluster. Scale bar: 5 µm. (D–F) Maximum intensity projection from three slices (z-step: 0.5 µm) of border cell clusters expressing UAS-PLCδPHGFP and UAS-cskRNAi#1. Blue, red, and green arrowheads point to blebs, thick protrusions, and filipodia, respectively. Scale bar: 5 µm. Insets in E and F show a crop with increased intensity for PLCδPHGFP from the corresponding images, allowing the observation of filipodia structures. (G) Quantification of border cell migration of egg chambers at stage 10 for the genotypes indicated. The total number of samples is indicated at the top of each bar. Four categories were established and represented with a scheme at the bottom of the bar graph (see Materials and methods). (H) Single section from confocal images of an egg chamber at stage 10 expressing UAS-PLCδPHGFP, UAS-GFPnls, and UAS-lacZ. Egg chamber was stained with FAS3 (magenta) and DAPI (blue). Posterior pole is labeled and indicated by a white arrow. Scale bar, 50 µm. (I–K) Single section from confocal images of the posterior pole from egg chambers at stage 10 expressing UAS-PLCδPHGFP, UAS-GFPnls, and the genotypes indicated. White asterisks in I indicate non-internalized polar cells. Yellow asterisks in J and K indicate polar cells that were internalized by FC. Scale bar, 5 µm. (I’–K’) 3D reconstructions of the respective images are shown in I–K. (L) Quantifications of posterior polar cells internalization from egg chambers at stage 10 of the indicated genotypes (see Materials and methods). The total number of samples is indicated at the top of each bar. (M–O3′) Single sections from confocal live imaging of border cell clusters from stage 9 or 10 egg chambers expressing UAS-PLCδPHGFP and the genotypes indicated. DAPI was added to the medium to visualize DNA (see Materials and methods). M1–M3 and N1–N3 are still images at 0, 48, and 84 min of Videos 6 and 7, respectively. Orange insets are schematic representations of the images shown. O1–O3 are time-lapse images at 0, 48, and 72 min of Video 8. White asterisks indicate non-internalized polar cells and orange or yellow asterisks indicate partially or fully internalized polar cells, respectively. Yellow arrows in N2 and N3 point to a border cell containing one polar cell. O1–O3 are time-lapse images at 0, 48, and 72 min of Video 8. Yellow insets in O1–O3 frame border cell clusters and their respective crop images are exhibited in O1’–O3’. A smooth filter was applied to the images. Scale bar in M1–N3, and O1–O3: 5 µm. Scale bar in O1–O3: 50 µm. (P) Maximal projection from 10 slices (z-step: 1.5 µm) of confocal images of egg chambers expressing UAS-PLCδPHGFP and UAS-SRC-CA#1. Egg chambers were stained with FAS3 (magenta). DNA is visualized by DAPI (blue). Yellow asterisk indicates a living stage 10 egg chamber and orange asterisks indicate dying egg chambers at later stages of oogenesis. Scale bar: 50 µm. (Q–R) Maximum intensity projection from five slices (z-step: 0.5 µm) of egg chambers in stage 9 or 10 expressing UAS-PLCδPHGFP and the genotypes indicated. Egg chambers were stained with cDCP1 (magenta) and DAPI (blue). Scale bar: 50 µm. (Q’–R’) Images from Q–R showing only cDCP1 staining in Royal LUT where white represents the highest amount of cDCP1 and black the lowest one. (S and S’) Maximal projection of 10 slices from confocal images of an egg chamber at stage 14 (z-step: 0.9 µm) expressing UAS-PLCδPHGFP and UAS-SRC-CA#1, and its respective border cell cluster framed by a yellow insert (z-step: 0.4 µm) and shown at a higher magnification in S’. Egg chambers were stained with CAD (green) and FAS3 (magenta). DNA is visualized by DAPI (blue). Yellow asterisks in R’ label internalized polar cells. Polar cells in panels A–C2, I–K, and S are outlined with a yellow dashed line.
Figure 2.
Figure 2.
SRC hyperactivity disrupts border cell morphology and cluster cohesion. (A) Quantifications of the circularity index of individual border cells for the genotypes indicated. Box plots are used to represent the data. Each box plot shows the median (line) with 25th and 75th percentiles (hinges) plus 1.5 × interquartile ranges (whiskers). Dots represent each cell analyzed, and the total number per genotype is indicated on the top of each box plot. Normal distribution was tested using Kolmogorov–Smirnov test. Since data were not normally distributed, a Mann–Whitney U test (one-tailed) was performed between controls and each experimental condition. P values are shown at the top of the graph. (B–F) Maximum intensity projection from eight slices (z-step: 0.5 µm) of border cell clusters expressing UAS-PLCδPHGFP and the genotypes indicated. White, blue, green, and red arrowheads point to lamellipodia, blebs, filipodia, and thick protrusions, respectively. Scale bar: 5 µm. Insets in E and F correspond to a crop with increased intensity for PLCδPHGFP from E and F images, allowing the observation of filipodia structures. Scale bar: 5 µm. (G–I’’) Maximum intensity projection from 10 slices (z-step: 0.5 µm) of border cell clusters expressing UAS-PLCδPHGFP and the genotypes indicated. Egg chambers were stained with aPKC (magenta) and DLG (gray). DNA was visualized by DAPI (blue). Anterior pole of the cluster exhibited in G–G’’ is pointing to the right. White or yellow arrowheads in G’–I’ point to the apical domain (apical cap) of the polar cells or border cells enriched with aPKC. White asterisks in G”–I” indicate non-internalized polar cells. Scale bar: 5 µm. (J–K’’) Maximum intensity projection from four slices (z-step: 0.4 µm) of border cell clusters expressing UAS-PLCδPHGFP and UAS-SRC-CA#1. Egg chambers were stained with aPKC (magenta). DNA was visualized by DAPI (blue). Yellow asterisks in J’, J’’, K’, and K’’ indicate partially internalized polar cells. White arrowheads in J’ and K’ point to the apical domain of the polar cells enriched with aPKC. Scale bar: 5 µm. Polar cells in G–I, J, and K are outlined with a red dashed line.
Figure 3.
Figure 3.
Internalized polar cells do not exhibit signs of death, and their engulfment depends on Rac and Rho. (A–C) Single sections from confocal images of border cell clusters from stage 10 egg chambers expressing UAS-PLCδPHGFP and the genotypes indicated. Egg chambers were stained with FAS3 (gray), cDCP1 (magenta), and DNA was visualized by DAPI (blue). Arrows in A indicate pyknotic nuclei. White asterisks in B and C indicate non-internalized polar cells, and yellow asterisk in C indicates internalized polar cell. Scale bar: 5 µm. (D–F’) Single sections from confocal images of a dying egg chamber (D and D’) or of border cell clusters from egg chambers in stage 10 (E–F’), expressing UAS-PLCδPHGFP and the genotypes indicated. Egg chambers were stained with FAS3 (gray), LysoTracker dye (magenta) to visualize acidic compartments, and DAPI (blue) to visualize DNA. White arrows in D point to pyknotic nurse cell nuclei. Yellow inset in D is shown in a higher magnification in D’. White asterisks in E indicate non-internalized polar cells, and yellow asterisk in F indicates internalized polar cells. Scale bar is 50 µm for the egg chamber in D and 5 µm for D’ and for border cell clusters in E–F. (G–L) Maximum intensity projection from five slices (G–I’) or nine slices (J–L’; z-step: 0.5 µm for G–H’ and J–K’, 0.16 µm for I, I’, L, and L’) of border cell clusters expressing UAS-PLCδPHGFP and the genotypes indicated. Images in I, I’, L, and L’ were obtained by airyscan imaging to visualize the localization of RAB5 (I and I’) and RAB7 (L and L’) at a high spatial resolution, and are not suitable for comparison of expression levels. Egg chambers were stained for FAS3 (magenta) and for RAB5 (G–I) or RAB7 (J–L; gray). DNA was visualized by DAPI (blue). White asterisks in G and J indicate non-internalized polar cells and yellow asterisks in H–I and K and L indicate internalized polar cells. Scale bar: 5 µm. (G’–L’) Images from G–L showing only RAB5 (G’–I’) or RAB7 (J’–L’) staining in Royal LUT where white represents the highest amount of the indicated protein and black the lowest one. (M–O) Single section (M) or maximum intensity projection from six slides (N and O; z-step: 0.5 µm) of a dying egg chamber (M) or border cell clusters expressing UAS-PLCδPHGFP and the genotypes indicated. Egg chambers were stained for FAS3 (magenta) and ATG8 (gray). DNA was visualized by DAPI (blue). Scale bar is 50 µm for the egg chamber in M and 5 µm for border cell clusters in N and O. (M’–O’) Images from M–O showing only ATG8 staining in Royal LUT. (P–S’’) Single sections from confocal images of border cell clusters from egg chambers at stage 9 or 10 expressing UAS-PLCδPHGFP and the genotypes indicated. Egg chambers were stained with pSRC (gray), F-actin (magenta), and DAPI (blue). White asterisks in P–R indicate non-internalized polar cells. In R, one polar cell is being internalized (yellow asterisk) by one border cell, and in S both polar cells are being internalized (yellow asterisks) by one border cell. White arrows in R’ and S point to pSRC accumulation and yellow arrows in R’’ and S’’ point to F-actin accumulation. Scale bar: 5 µm. (T–V’) Single sections from confocal images of border cell clusters from egg chambers at stage 9 or 10 expressing UAS-PLCδPHGFP and the genotypes indicated. Egg chambers were stained with pMLC (gray), FAS3 (magenta), and DAPI (blue). White asterisks in T and U indicate non-internalized polar cells and the yellow asterisk in V indicates an internalized polar cell. The orange arrow in V’ points pMLC accumulation along with the squeezing of a polar cell nucleus. Scale bar: 5 µm. (W) Quantifications of polar cell internalization events from stage 10 egg chambers of the indicated genotypes. Error bars: mean ± SEM (n = 3). The total number of clusters analyzed (n) is indicated at the top of each bar. Statistical significance was assessed with a Fisher exact test (one-tailed) and P values are shown at the top of the graph. Polar cells in B, C, E, L, and N–V are outlined with a yellow dashed line.
Figure S2.
Figure S2.
Rac, Rho, SHARK, and FAK are required for activated SRC to affect border cell migration and morphology. (A) Quantifications of normalized pSRC maximal intensity from egg chambers in stage 9 or 10 of the indicated genotypes (see Materials and methods). Box plots are used to represent the data. Each box plot shows the median (line) with 25th and 75th percentiles (hinges) plus 1.5 × interquartile ranges (whiskers). Dots represent each cluster analyzed and their total number per genotype (n) is indicated on the top of each box plot. Normal distribution was tested using Kolmogorov–Smirnov test. Since data were normally distributed, an ANOVA test (one-tailed) with post-hoc Tukey was performed to evaluate statistical significance. P values are shown at the top of the graph. (B–C’) Maximum intensity projection from three slices (z-step: 0.5 µm) of border cell clusters expressing UAS-PLCδPHGFP and UAS-SRC-WT. Egg chambers were stained with pSRC (gray) and FAS3 (magenta) in B and B’, and with F-actin (magenta) in C and C’. DNA is visualized by DAPI (blue). White asterisks in B and B’ indicate non-internalized polar cells and yellow ones in B–C’ indicate partially internalized polar cells. White arrows in B’ point to pSRC accumulation, and yellow arrows in C’ point to F-actin accumulation. Scale bar: 5 µm. (D and E) Quantification of border cell migration in stage 10 egg chambers for the genotypes indicated (see Materials and methods). The total number of samples is indicated on top of each bar. (F–H’) Single sections of border cell clusters from stage 10 egg chambers expressing the genotypes indicated. Egg chambers were stained with CAD (green) and FAS3 (magenta). Yellow asterisks in F indicate internalized polar cells and white ones in G and H indicate non-internalized polar cells. Polar cells are outlined with a yellow dashed line. Scale bar: 5 µm.
Figure 4.
Figure 4.
SHARK and FAK kinases function downstream of SRC in polar cell internalization. (A–G’) Single sections from confocal images of egg chambers at stage 10 expressing UAS-PLCδPHGFP and the genotypes indicated. In A–C, egg chambers were stained with SHARK-Y927 (pSHARK; gray), and in E–G, egg chambers were stained with FAK-Y397 (pFAK; gray). DAPI (blue) was used to visualize DNA. Scale bar is 50 µm. Yellow insets frame border cell clusters, and their respective crop images are shown in A’–G’. (A’’–G’’) Schematic representations of the images shown in A’–G’. White or yellow asterisks indicate non-internalized or partially internalized polar cells, respectively. (A’’’–G’’’) Same images are shown in A’–G’, where pSHARK (A’’’–C’’’) or pFAK (E’’’–G’’’) are shown in Royal LUT, where white represents the highest amount of the protein and black the lowest one. Scale bar is 5 µm. (D–H) Quantifications of normalized pSHARK (D) or pFAK (H) maximal intensity (see Materials and methods) from stage 9 or 10 egg chambers of the indicated genotypes. Box plots are used to represent the data. Each box plot shows the median (line) with 25th and 75th percentiles (hinges) plus 1.5 × interquartile ranges (whiskers). Dots represent each cluster analyzed and their total number per genotype (n) is indicated on the top of each box plot. Normal distribution was tested using Kolmogorov–Smirnov test. Since data were normally distributed, an ANOVA test (one-tailed) with post-hoc Tukey was performed to evaluate statistical significance. P values are shown at the top of the graph. ns indicates not significant. (I) Quantifications of polar cells internalization from egg chambers at stage 10 of the indicated genotypes (see Materials and methods). Error bars: mean ± SEM (n = 3). The total number of clusters analyzed (n) is indicated at the top of each bar. Statistical significance was assessed with a Fisher exact test (one-tailed) and P values are shown at the top of the graph.
Figure 5.
Figure 5.
SRC-dependent polar cell internalization requires integrins but not Draper. (A) Quantifications of polar cell internalization from egg chambers at stage 10 for the indicated genotypes (see Materials and methods). Error bars: mean ± SEM (n = 3). The total number of clusters analyzed (n) is indicated at the top of each bar. Statistical significance was assessed with a Fisher exact test (one-tailed) and P values are shown at the top of the graph. ns indicates not significant. (B–D’’’) Single section from confocal images of border cell clusters from egg chambers at stage 9 expressing UAS-PLCδPHGFP (green) and the genotypes indicated. Egg chambers were stained with βPS (gray) and DAPI (blue). White or yellow asterisks indicate non-internalized or partially internalized polar cells, respectively. White arrows in D’’ point to the accumulation of βPS at the contact site(s) between border cell–polar cell. Images in B’’’–D’’’ indicate βPS staining in a Royal LUT, where white represents the highest amount of the protein and black the lowest one. Scale bar: 5 µm. Polar cells are outlined with a yellow dashed line in B’–D’. (E) Model of normal or elevated SRC activity in border cells. Top panels: In control border cell clusters, Rac activity is high in the lead cell protrusion and at the front of follower cells. Rho activity is localized posteriorly. When SRC is hyperactivated, it leads to the enrichment of Rac and Rho at the site of engulfment. Bottom panels: For clarity, only one border cell of the cluster is represented. Left: Wild-type border cells have normal levels of SRC activity. In this condition, cells are ovoid and no cannibalism of polar cells is observed. Most SRC is negatively regulated by CSK, but an active pool of the protein can phosphorylate Draper receptor or other targets, ensuring normal behavior. Integrin receptors remain inactive. Middle: SRC overexpression in border cells leads to a semicircular shape and limited polar cell cannibalism. Elevated SRC activity is sufficient to slightly increase pSHARK, but it is not enough to activate and recruit pFAK at border cell–polar cell contacts. Right: Hyperactivation of SRC causes border cells’ rounding and localized accumulation of active SRC at border cell–polar cell contacts. Localized SRC activity promotes the relocalization of Integrin receptors at the site of engulfment. FAK and SHARK tyrosine kinases are also activated and recruited by SRC to those contact sites. All these activated proteins serve as a node of signal amplification, triggering cannibalism of polar cells through the activation of Rac and Rho GTPases, F-actin, and Myosin. Dashed arrows represent a direct or indirect interaction.
Figure S3.
Figure S3.
SRC is upstream of βPS integrin subunit for polar cell engulfment, border cell migration, and cell cluster morphology. (A) Verification by polymerase chain reaction of the presence of csk inverted repeated sequence which is indicated by a band of ∼400 base pairs (see Materials and methods). “L” indicates Ladder; (1) w1118, (2) cskRNAi, (3) mys1; cskRNAi, (4) mys1/c306-Gal4; cskRNAi/mysRNAi, (5) mysRNAi (see Table S1 to specific genotypes). (B) Quantification of border cell migration of egg chambers at stage 10 for the genotypes indicated (see Materials and methods). The total number of samples is indicated on top of each bar. (C–D’) Maximum intensity projection from seven slices (z-step: 0.6 µm) of confocal images of border cell clusters from stage 10 egg chambers expressing the genotypes indicated. Egg chambers were stained with CAD (green) and FAS3 (magenta). Yellow asterisks in C indicate internalized polar cells and white ones in (D) indicate non-internalized polar cells. Scale bar: 5 µm. (E–H’) Maximum intensity projection from six slices (z-step: 1 µm) (E–F’) or 20 slices (z-step: 0.5 µm) (G–H’) of confocal images of egg chambers at stage 10 (E–F’) or stage 9 (G–H’) expressing the genotypes indicated. (E’–H’) magnify the insets in E–H. Egg chambers were stained with pSHARK (pY927; gray) and DAPI (blue). pSHARK accumulation in centripetal cells is labeled by orange arrows in E–F. (E’’–H’’) Same images are shown in E’–H’ where pSHARK staining is shown in a Royal LUT. White represents the highest amount of protein and black the lowest one. White arrows in G’ and G’’ point to pSHARK accumulation and green arrowheads point to a ring canal enriched in pSHARK. Scale bar: 50 µm in E–H and 5 µm in E’–H’’. Polar cells in panels C–D and E’–H’ are outlined with a yellow dashed line. White or yellow asterisks indicate non-internalized or fully internalized polar cells, respectively.

Similar articles

References

    1. Aceto, N., Bardia A., Miyamoto D.T., Donaldson M.C., Wittner B.S., Spencer J.A., Yu M., Pely A., Engstrom A., Zhu H., et al. . 2014. Circulating tumor cell clusters are oligoclonal precursors of breast cancer metastasis. Cell. 158:1110–1122. 10.1016/j.cell.2014.07.013 - DOI - PMC - PubMed
    1. Barrett, K., Leptin M., and Settleman J.. 1997. The Rho GTPase and a putative RhoGEF mediate a signaling pathway for the cell shape changes in Drosophila gastrulation. Cell. 91:905–915. 10.1016/s0092-8674(00)80482-1 - DOI - PubMed
    1. Biswas, R., Stein D., and Stanley E.R.. 2006. Drosophila Dok is required for embryonic dorsal closure. Development. 133:217–227. 10.1242/dev.02198 - DOI - PubMed
    1. Borensztejn, K., Tyrna P., Gaweł A.M., Dziuba I., Wojcik C., Bialy L.P., and Mlynarczuk-Bialy I.. 2021. Classification of cell-in-cell structures: Different phenomena with similar appearance. Cells. 10:2569. 10.3390/cells10102569 - DOI - PMC - PubMed
    1. Bradshaw, J.M. 2010. The src, syk, and tec family kinases: Distinct types of molecular switches. Cell. Signal. 22:1175–1184. 10.1016/j.cellsig.2010.03.001 - DOI - PubMed

Publication types

Substances