[Preprint]. 2024 Apr 17:2023.09.15.557836.
doi: 10.1101/2023.09.15.557836.

Structural and dynamic changes in P-Rex1 upon activation by PIP3 and inhibition by IP4

Affiliations

Structural and dynamic changes in P-Rex1 upon activation by PIP3 and inhibition by IP4

Sandeep K Ravala et al. bioRxiv. .

Update in

Abstract

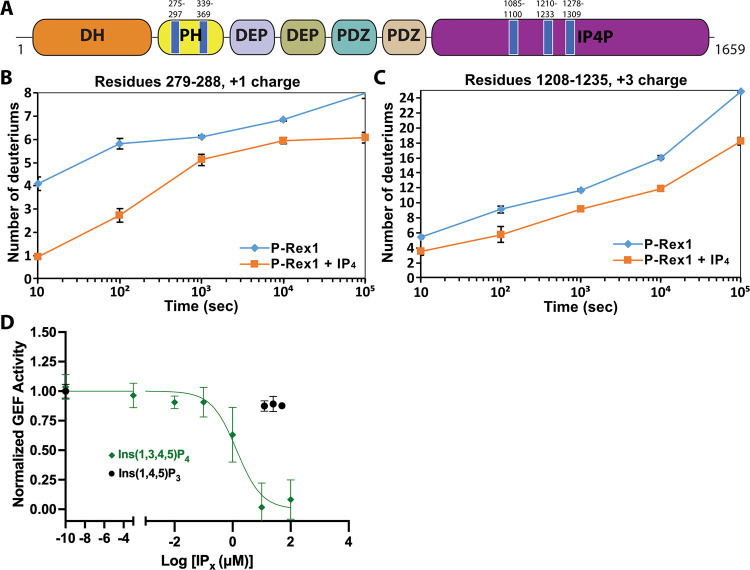
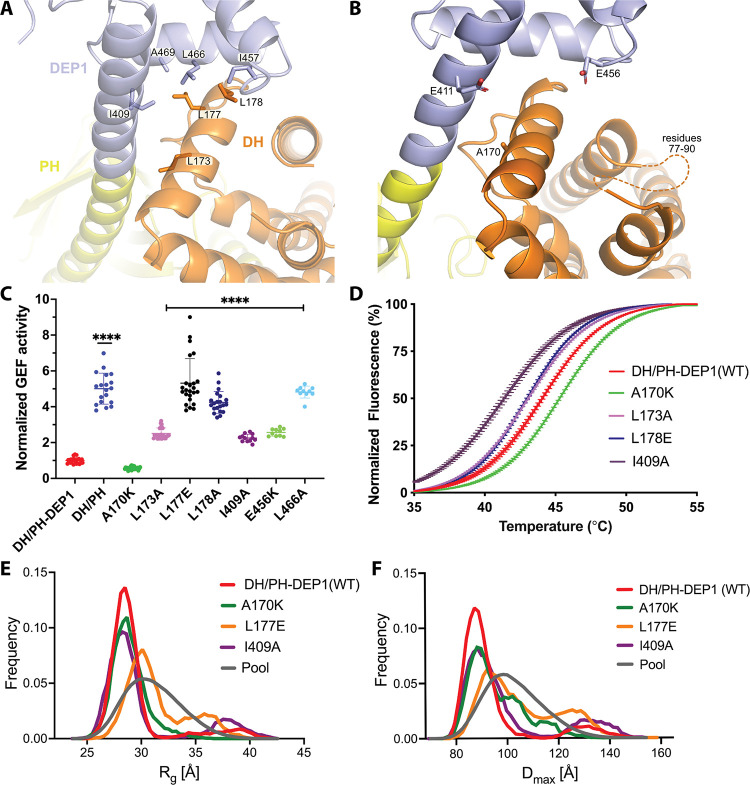
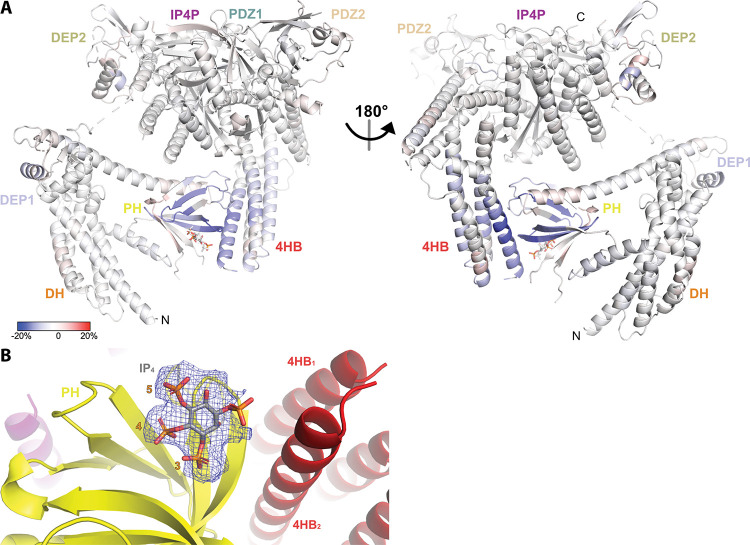
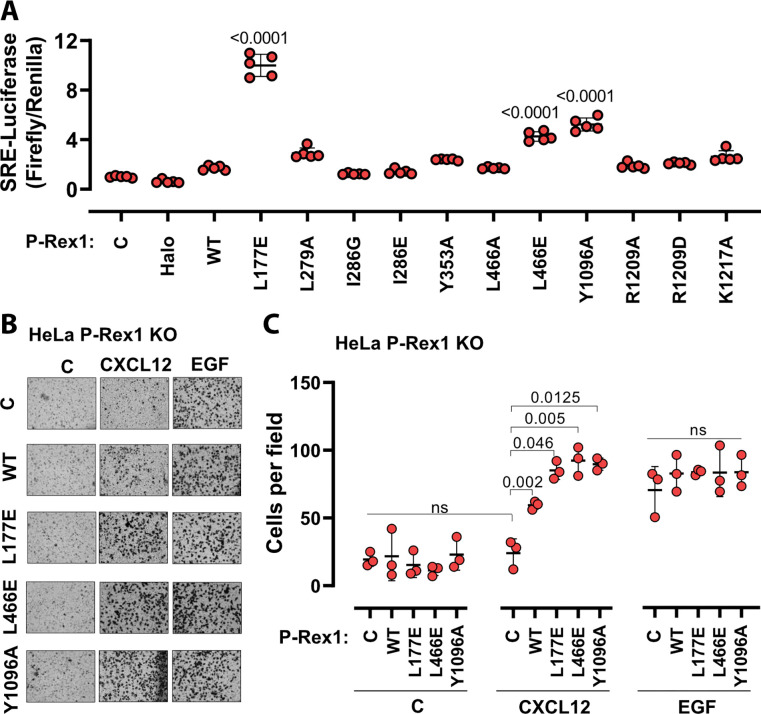
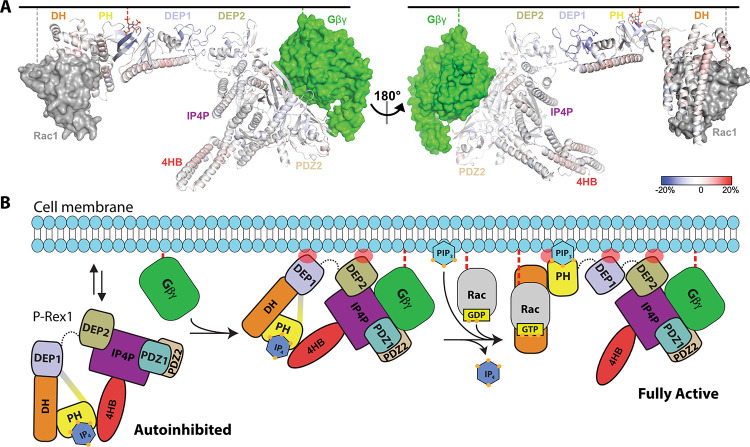
PIP3-dependent Rac exchanger 1 (P-Rex1) is abundantly expressed in neutrophils and plays central roles in chemotaxis and cancer metastasis by serving as a guanine-nucleotide exchange factor (GEF) for Rac. The enzyme is synergistically activated by PIP3 and the heterotrimeric Gβγ subunits, but mechanistic details remain poorly understood. While investigating the regulation of P-Rex1 by PIP3, we discovered that Ins(1,3,4,5)P4 (IP4) inhibits P-Rex1 activity and induces large decreases in backbone dynamics in diverse regions of the protein. Cryo-electron microscopy analysis of the P-Rex1·IP4 complex revealed a conformation wherein the pleckstrin homology (PH) domain occludes the active site of the Dbl homology (DH) domain. This configuration is stabilized by interactions between the first DEP domain (DEP1) and the DH domain and between the PH domain and a 4-helix bundle (4HB) subdomain that extends from the C-terminal domain of P-Rex1. Disruption of the DH-DEP1 interface in a DH/PH-DEP1 fragment enhanced activity and led to a more extended conformation in solution, whereas mutations that constrain the occluded conformation led to decreased GEF activity. Variants of full-length P-Rex1 in which the DH-DEP1 and PH-4HB interfaces were disturbed exhibited enhanced activity during chemokine-induced cell migration, confirming that the observed structure represents the autoinhibited state in living cells. Interactions with PIP3-containing liposomes led to disruption of these interfaces and increased dynamics protein-wide. Our results further suggest that inositol phosphates such as IP4 help to inhibit basal P-Rex1 activity in neutrophils, similar to their inhibitory effects on phosphatidylinositol-3-kinase.


Figures

Figure 1.
Figure 1.. IP4 binding causes dynamic changes in multiple domains of P-Rex1 and inhibits PIP3-induced activation.
A) Difference HDX-MS data plotted onto the domain layout of P-Rex1. Blue regions indicate less deuterium uptake upon IP4 binding. Graphs show the exchange over time for select regions in the P-Rex1 (B) PH domain and (C) an IP4P region that was disordered in the P-Rex1–Gβγ structure. The average of two experiments is plotted with the bars representing the range of each time point. D) In vitro GEF activity of P-Rex1 evaluated on liposomes containing 2.5 μM PIP3 in the presence of varying IP4 concentrations (0–100 μM). Data were fit to exponentials to get rate constants by constraining the span to be shared. The resulting rates for each experiment were normalized by averaging two PIP3 data points and two PC/PS data points to represent the top and bottom of the binding curve. The resulting normalized rates (min−1) were fit with a one-phase binding curve wherein the top and bottom were constrained to 1 and 0, respectively, and the Hill coefficient fixed at −1. The resulting IC50 was 1.4 μM with a confidence interval of 0.81 to 2.3. Data represent 4–5 independent experiments. Error bars represent the mean ± S.D.
Figure 2.
Figure 2.. Structure of the P-Rex1·IP4 complex in an autoinhibited conformation.
A) Cryo-EM reconstruction with atomic model superimposed. The kink between the DH and PH domains and the GTPase binding site are labeled. B) Atomic model without the cryo-EM map. C) The PH–4HB interface primarily involves the β1/β2 and β5/β6 loops of the PH domain, which were previously shown to be involved in protein-protein interactions in crystal structures (Cash et al., 2016), and the 4HB1 and 4HB2 helices of the 4HB domain. Flexible loops, including the basic β3/β4 loop of the PH domain involved in membrane binding (Cash et al., 2016), are shown as dashed lines. We speculate that this loop could interact with phosphorylated residues in the adjacent 4HB unstructured loop. D) Side chains in the PH–4HB interface. The 3-, 4-, and 5-position phosphates of bound IP4 are labeled. Note that PIP3 could not bind to the PH domain in this state due to steric blockade by the 4HB domain. The area of focus in (C) and (D) is circled in transparent grey in (B).
Figure 3.
Figure 3.. Mutations at the DH–DEP1 interface alter stability, conformation, and activity of DH/PH-DEP1.
A) Side chains that contribute to the hydrophobic interface formed between the DH and DEP1 domains. B) Electrostatic interactions contributing the DH–DEP1 interface. The dotted line indicates a disordered region on the DH domain containing positively charged residues that may interact with Glu456. The A170K mutant is expected to form a salt bridge with Glu411 and strengthen the interface. C) Fluorescence based in vitro GEF activity assay on soluble Cdc42 with variants of the purified DH/PH-DEP1 fragment. GEF activity in this experiment was fit to a one phase exponential decay normalized to that of DH/PH-DEP1 (WT). ****, P<0.0001. D) Representative Thermofluor analyses showing that mutations that disrupt the DH–DEP1 interface also destabilize the protein, as evidenced by decreased Tm values for each variant (see Table 2). Data are normalized from 0–100% representing lowest and highest fluorescence values. Note that A170K, which inhibits activity in panel C, increases stability. E, F) EOM analysis of SAXS data collected from mutations disrupting the DH–DEP1 interface indicate that these variants exhibit more extended conformations (see Table 3). EOM analyses provide the Rg and Dmax distributions derived from selected ensembles. The gray curves correspond to the Rg and Dmax distributions for the pool of structures used for each analysis.
Figure 4.
Figure 4.. HDX-MS and cryo-EM data support that IP4 stabilizes a closed conformation of P-Rex1.
A) Difference HDX-MS data plotted onto the structure of the P-Rex1 bound to IP4. Blue regions indicate more protection upon IP4 binding whereas red regions indicate less. See also Supplemental Data 1. B) Map representing IP4 bound in the PIP3-binding site of the PH domain. The 3-, 4-, and 5-phosphates of IP4 are reasonably well-ordered.
Figure 5.
Figure 5.. Disruption of the DH–DEP1 and PH–4HB interfaces leads to increased P-Rex1 activity in cells.
A) SRE luciferase-gene reporter assays. Mutations were cloned into full-length P-Rex1 in the pCEFL-HA-HaloTag vector, and these constructs, along with luciferase reporter genes, were co-transfected into HEK293T cells. Results depicted here are representative of three independent experiments, and error bars represent S.D. Non-transfected control (C) and empty vector transfected control (Halo) are shown. B) Mutations which led to enhanced P-Rex1 activity in luciferase reporter assays were evaluated for their effect on chemotaxis of HeLa cells with endogenous P-Rex1 knocked out (HeLa P-Rex1 KO; see Supplemental Figure 7). P-Rex1 constructs were transfected into HeLa P-Rex1 KO cells, and cell migration was evaluated in a trans-well migration assay upon stimulation with CXCL12 (50 ng/ml) or EGF (50 ng/ml). Data is presented as mean ± S.D. Significance (brackets) was determined using multiple comparison ANOVA followed by Šidák statistic test.
Figure 6.
Figure 6.. HDX-MS supports that P-Rex1 undergoes long range conformational changes when binding PIP3-containing liposomes.
A) HDX-MS of P-Rex1 in the presence of PIP3-containing liposomes. A model of P-Rex1 in an open conformation bound to a membrane containing PIP3 was created and is shown colored according to difference HDX-MS data plotted onto the coordinates. HDX-MS data were collected in the presence of liposomes containing PIP3 and compared to data collected on P-Rex1 alone. Blue and red regions indicate less and more protection, respectively, upon PIP3-containing liposome binding. These changes occur specifically in the presence of PIP3 (see Supplemental Figure 8). The black line at the top represents a membrane surface and the dashed lines represent covalent lipid modifications. Using available structural information, Gβγ and Rac1 were docked into this model (although neither were present in this HDX-MS experiment). B) Cartoon schematic of our model of the steps involved in the activation of P-Rex1.

Similar articles

References

    1. Bandekar SJ, Arang N, Tully ES, Tang BA, Barton BL, Li S, Gutkind JS, Tesmer JJG. 2019. Structure of the C-terminal guanine nucleotide exchange factor module of Trio in an autoinhibited conformation reveals its oncogenic potential. Sci Signal 12. doi:10.1126/scisignal.aav2449 - DOI - PMC - PubMed
    1. Barber MA, Donald S, Thelen S, Anderson KE, Thelen M, Welch HCE. 2007. Membrane Translocation of P-Rex1 Is Mediated by G Protein betaSubunits and Phosphoinositide 3-Kinase. Journal of Biological Chemistry 282:29967–29976. doi:10.1074/jbc.m701877200 - DOI - PubMed
    1. Barber MA, Hendrickx A, Beullens M, Ceulemans H, Oxley D, Thelen S, Thelen M, Bollen M, Welch HCE. 2012. The guanine-nucleotide-exchange factor P-Rex1 is activated by protein phosphatase 1α. The Biochemical journal 443:173–183. doi:10.1042/bj20112078 - DOI - PubMed
    1. Cash JN, Davis EM, Tesmer JJG. 2016. Structural and Biochemical Characterization of the Catalytic Core of the Metastatic Factor P-Rex1 and Its Regulation by PtdIns(3,4,5)P 3. Structure 24:730–740. doi:10.1016/j.str.2016.02.022 - DOI - PMC - PubMed
    1. Cash JN, Urata S, Li S, Ravala SK, Avramova LV, Shost MD, Gutkind JS, Tesmer JJG, Cianfrocco MA. 2019. Cryo–electron microscopy structure and analysis of the P-Rex1–Gβγ signaling scaffold. Sci Adv 5:eaax8855. doi:10.1126/sciadv.aax8855 - DOI - PMC - PubMed

Publication types